The Office for Students annual review 2023
A statistical overview of higher education in England
This section uses the latest available data from a range of OfS reports and data dashboards to present key statistics about higher education in England. It is not a comprehensive overview; the endnotes include information where fuller statistical information is available on the OfS website.57
This section focuses on:
- Higher education providers: The number of providers, diversity of provision, TEF 2023 ratings, and financial sustainability.
- Students in higher education: Entrants to higher education and their experiences of their courses.
- Student outcomes: Continuation, completion, attainment and progression rates.
Where available we have included data on specific groups of students whose outcomes may be impacted by their disadvantaged or underrepresented status. Universities and colleges should be supporting these students to improve their outcomes, including targeting them where appropriate in their access and participation plan intervention strategies.
These groups include, among others:
- Students who were entitled to free school meals while at school.
- Care experienced students, those who are estranged from their families, and students from Gypsy, Roma and Traveller communities.
- Students sharing a protected characteristic identified by the Equality Act 2010 who experience inequality of opportunity because of that protected characteristic.
- Students who experience multiple barriers to higher education, or who are identified when looking at intersections of different student characteristics, such as male students who are in receipt of free school meals.58
Higher education providers
Registration
There were 2,048,216 full-time equivalent students (at all levels of study) at higher education providers registered with the OfS in 2021-22.59 On 5 December 2023, there were 423 registered providers. 78 of them were in the ‘Approved’ category and 345 in the ‘Approved (fee cap)’ category, which allows them to access certain funding and charge fees up to the higher statutory fee limit. On the same date, there were 163 providers with degree awarding powers (38.5 per cent of all registered providers). 105 providers (24.8 per cent) can award research degrees. 124 providers are universities (29.3 per cent), 71 are registered as a charity and 266 are exempt charities (which means that they are not registered with the Charity Commission and the OfS is their principal regulator).60
TEF 2023
In September 2023 we published the final Teaching Excellence Framework 2023 ratings for 175 higher education providers. The TEF is a cyclical peer review process run by the OfS every four years. It aims to encourage higher education providers to deliver excellent teaching, above the high quality baseline of our regulatory framework.
Providers that take part in the TEF receive an overall rating and two underpinning aspect ratings, for student experience and student outcomes. 227 higher education providers took part in TEF 2023. Their overall ratings include the following:
- 51 were rated Gold (meaning the student experience and student outcomes are typically outstanding).
- 125 were rated Silver (meaning the student experience and student outcomes are typically of very high quality).
- 48 were rated Bronze (meaning the student experience and student outcomes are typically of high quality, and there are some features of very high quality).61
Financial sustainability
Each year we analyse financial data returned by registered higher education providers in England (excluding further education colleges).62 This year’s analysis (published in May 2023) concluded that the overall aggregate financial position of higher education registered with the OfS remained sound, although there was significant variation between providers, and there were some material risks. We did not have concerns about the short-term viability of most providers, but the financial position of many was expected to be tighter than in previous years.
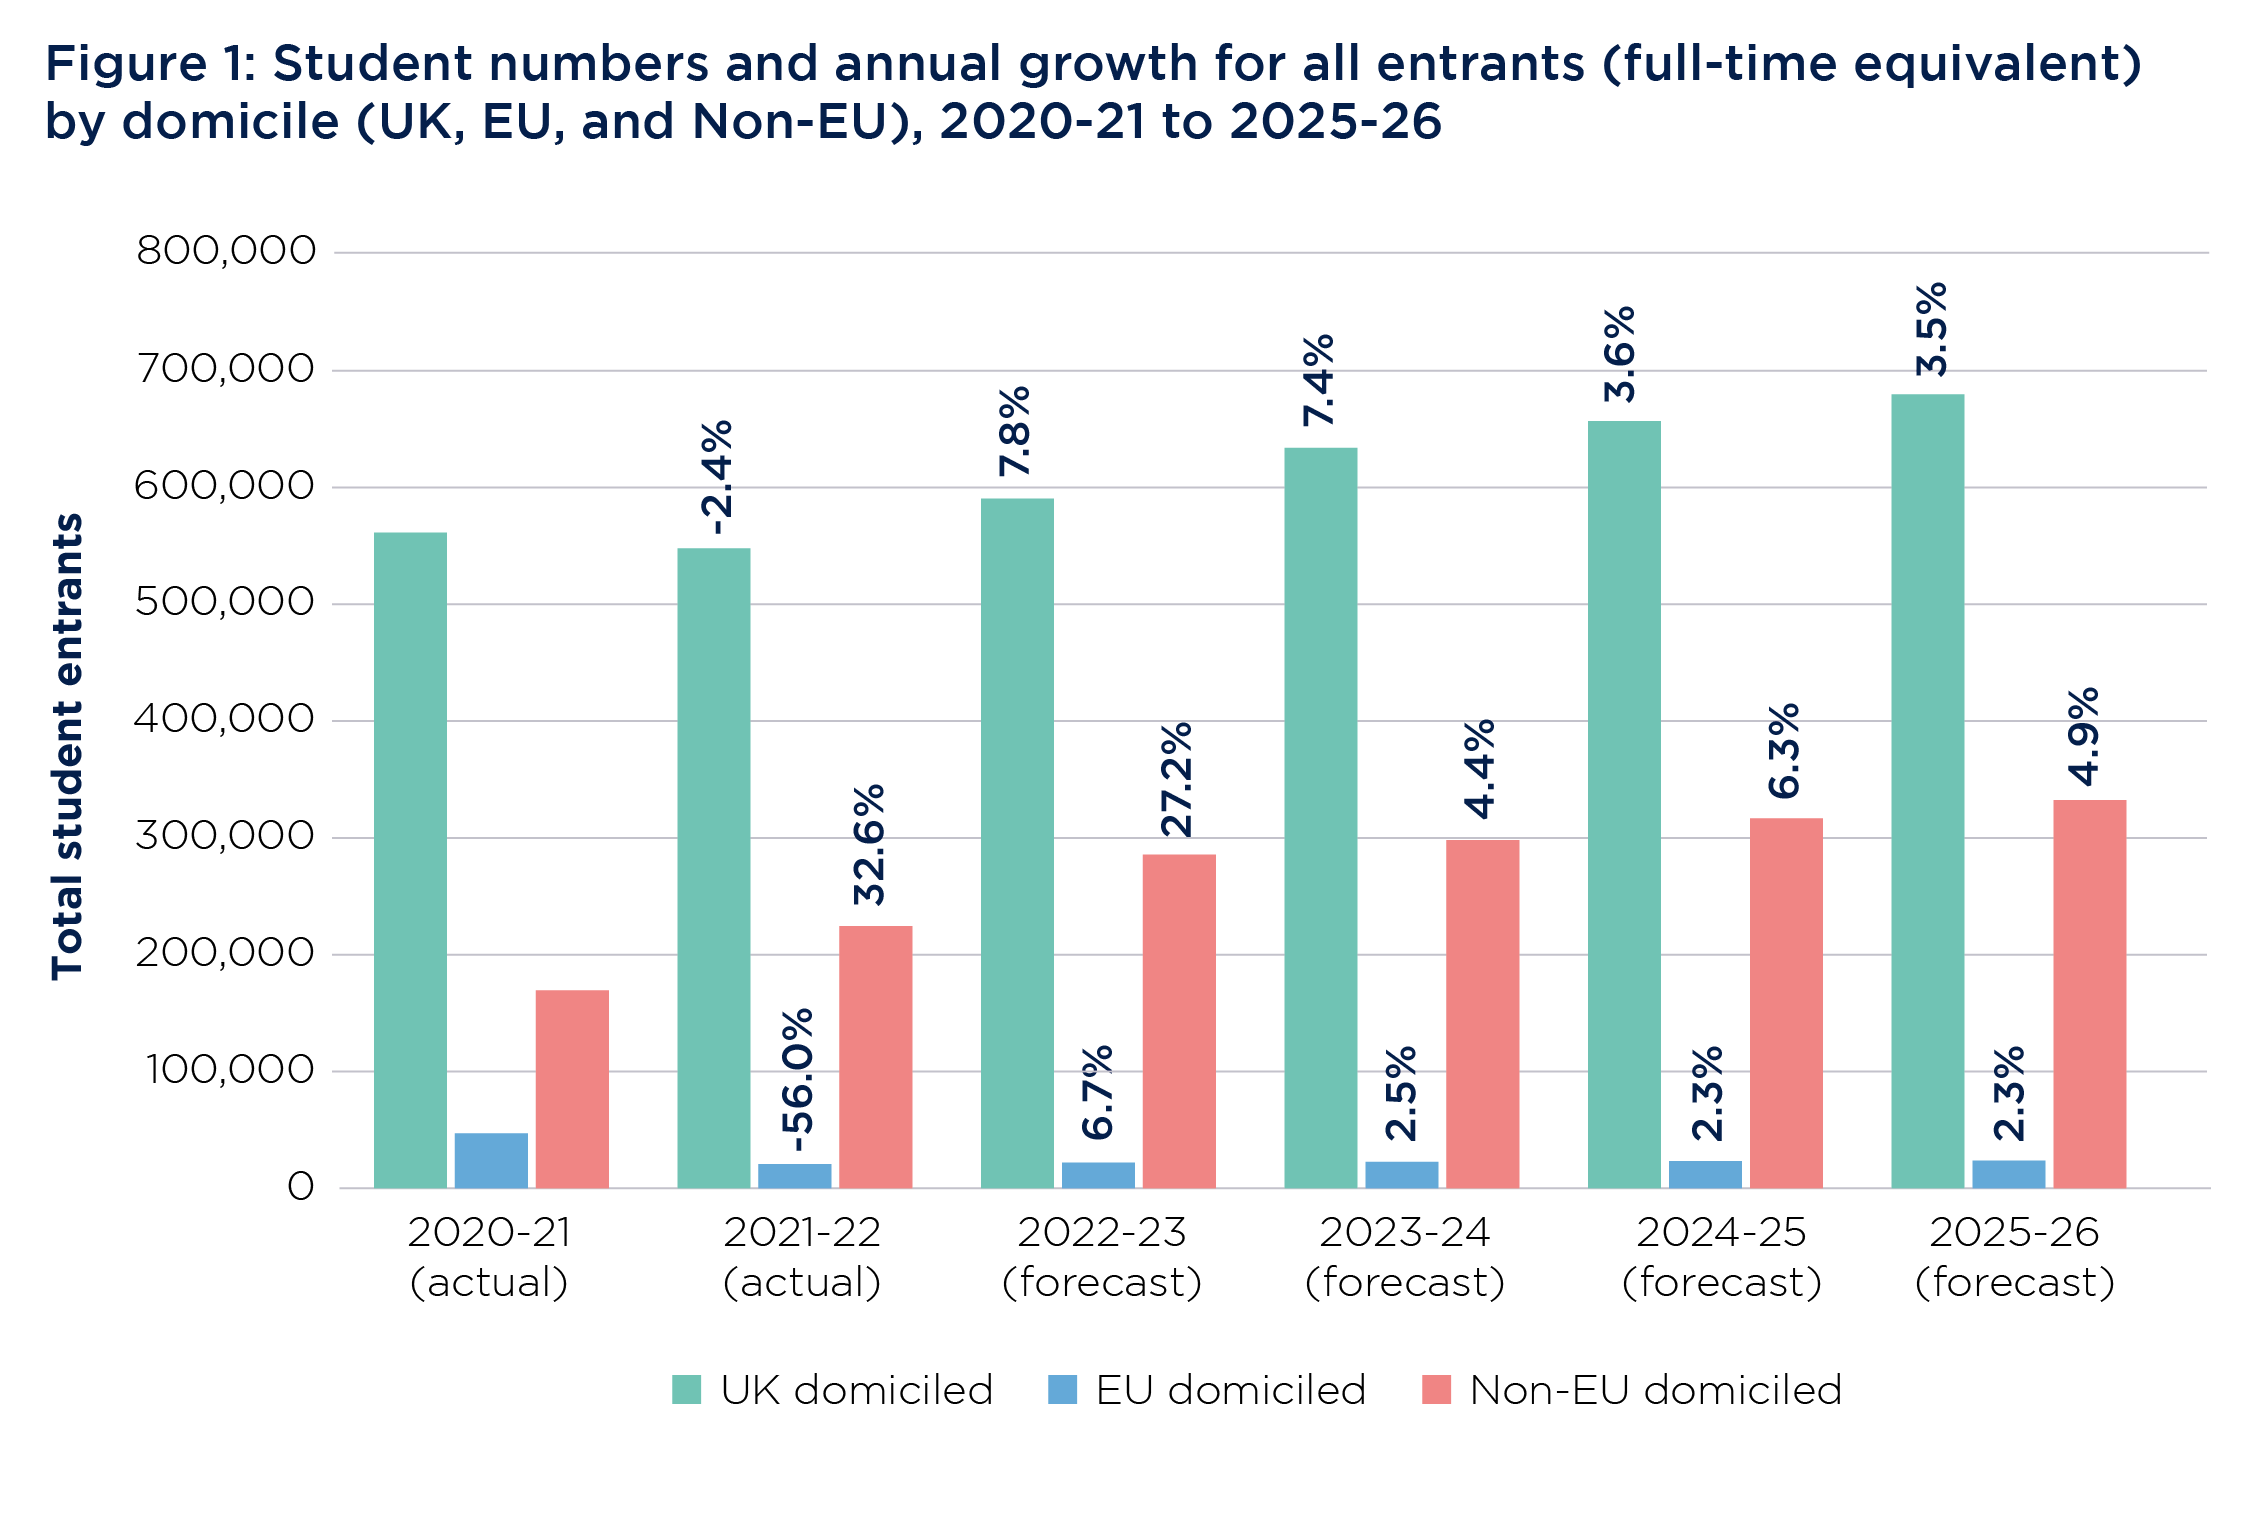
Table 1 gives a breakdown of the sources of income (using actual and forecast data from providers) across the sector in the academic years 2020-21 to 2025-26. Course fees and education contracts make up the largest source of income for the sector as a whole. For many higher education providers, financial sustainability continues to be underpinned by actual and forecast income from international students (who pay increased fees). There are particular risks where providers are over-reliant on the income from students from a single country. Figure 1 shows the annual change in actual and forecast entrants to higher education (full-time equivalents) by student domicile across all levels of study.
Table 2 shows the top ten source countries for overseas students from 2020-21 to 2021-22. China was the top source country for overseas students in 2021-22. Students from China made up 22.3 per cent of the total number of overseas students in that academic year. The number of students from India has grown significantly in recent years.
Table 1: Sources of income, 2020-21 to 2025-26
|
Income source |
Income £M
|
|||||
| 2020-21 (actual) | 2021-22 (actual) | 2022-23 (forecast) | 2023-24 (forecast) | 2024-25 (forecast) | 2025-26 (forecast) | |
| Course fees and education contracts | 20,682 | 22,501 | 24,139 | 25,974 | 27,690 | 29,280 |
| Funding body grants | 4,105 | 4,042 | 4,049 | 4,044 | 4,042 | 4,032 |
| Research grants and contracts | 5,377 | 5,748 | 5,966 | 6,254 | 6,583 | 6,916 |
| Other income | 5,941 | 7,438 | 7,648 | 8,060 | 8,397 | 8,719 |
| Investment income | 288 | 291 | 383 | 400 | 382 | 376 |
| Donations and endowments | 789 | 829 | 761 | 727 | 761 | 785 |
| Total income | 37,181 | 40,848 | 42,947 | 45,461 | 47,855 | 50,107 |
Source: OfS, ‘Financial sustainability of higher education providers in England 2023 update’ (OfS 2023.20), 2023, pages 13-14.63
Source: OfS, ‘Financial sustainability of higher education providers in England 2023 update’ (OfS 2023.20), 2023, page 15.64
Note: Percentages show the year-to-year change for each domicile.
Figure 1 is a triple bar chart showing student numbers for the years 2020-21 to 2021-22 (actual) and 2022-23 to 2025-26 (forecast), for UK-domiciled, EU-domiciled and non-EU domiciled entrants. For each year from 2021-22, the percentage change since the previous year is shown for each population. In every year, there are significantly more UK students than non-EU-domiciled students, of whom there are in turn significantly more than EU-domiciled students. The total number of students is forecast to grow; however, the chart shows an overall decrease in EU-domiciled students over the period compared with 2020-21, while the other groups are forecast to grow in size.
Table 2: Top ten source countries for overseas students (EU and non-EU), 2020-21 to 2021- 22
|
Country |
2020-21 (actual) |
2021-22 (actual) |
Proportion of total overseas students 2020-21 |
Proportion of total overseas students 2021-22 |
|
China |
119,275 |
124,385 |
23.6% |
22.3% |
|
India |
72,110 |
107,320 |
14.3% |
19.2% |
|
Nigeria |
16,980 |
34,010 |
3.4% |
6.1% |
|
Pakistan |
10,975 |
18,305 |
2.2% |
3.3% |
|
United States |
13,260 |
15,825 |
2.6% |
2.8% |
|
Hong Kong |
15,035 |
15,805 |
3.0% |
2.8% |
|
Bangladesh |
5,420 |
10,005 |
1.1% |
1.8% |
|
France |
11,710 |
9,905 |
2.3% |
1.8% |
|
Malaysia |
9,565 |
9,715 |
1.9% |
1.7% |
|
Italy |
12,390 |
9,580 |
2.5% |
1.7% |
Source: OfS, ‘Financial sustainability of higher education providers in England 2023 update’ (OfS 2023.20), 2023, page 20; Higher Education Statistics Agency data including amendments approved by the OfS data amendment panel.65 Student numbers have been rounded to the nearest five.
Students in higher education
Profile of students entering higher education
546,110 full-time students, 75,870 part-time students and 25,240 apprentices entered undergraduate education in 2021-22 (the latest year of data).66 The numbers of full-time and part-time undergraduate entrants have decreased since the previous academic year (2020-21). The number of apprentices has been increasing since 2018-19. Table 3 shows the number of undergraduate entrants by domicile for each academic year from 2018-19 to 2021-22.
The OfS’s KPM 5 measures the number of young, full-time undergraduate students entering higher education, by differing levels of individual disadvantage. In 2021-22, approximately 286,700 young, full-time students who were domiciled in England (and could be linked to their school record in their GCSE year) entered undergraduate higher education in England. This is the highest total in the past five years. Of these students, 49,600 were categorised as ‘significantly disadvantaged’. This number has decreased from 51,100 in the previous academic year.67
322,120 full-time students, 86,690 part-time students and 7,840 apprentices entered postgraduate education in 2021-22 (the latest year of data).68 Full-time postgraduate entrants have been increasing in number each year since 2018-19. In 2021-22, part-time postgraduate entrants decreased in number by 5,380, and postgraduate apprenticeship entrants decreased in number by 560, compared with the previous academic year. However, the latest number of postgraduate apprentices entering higher education is more than double the number in 2018-19. See Table 4 for details of the number of postgraduate entrants by domicile for each academic year from 2018-19 to 2021-22.
Students domiciled outside of the UK comprised 16.4 per cent of full-time undergraduate entrants and 65.1 per cent of full-time postgraduate entrants in 2021-22.
Female students made up the majority of full-time undergraduate and postgraduate entrants in the latest academic year of data, 2021-22 (55.1 and 55.8 per cent respectively; see Table 5). However, these are sector-wide figures and it should be noted that there are striking differences in the proportions of male and female students in certain course subjects. For example, in 2021-22 the majority of entrants for engineering, technology and computing were male (82.4 per cent of undergraduate entrants and 69.8 per cent of postgraduate entrants). Female students made up the majority of education and teaching entrants in the same year (82.5 per cent of undergraduate entrants and 72.3 per cent of postgraduate entrants).69
Table 3: Number of undergraduate entrants by domicile from 2018-19 to 2021-22
|
Academic year |
Domicile |
Full-time undergraduate |
Part-time undergraduate |
Apprenticeship undergraduate |
|
2018-19 |
UK |
411,650 |
76,470 |
18,780 |
|
EU |
28,750 |
470 |
30 |
|
|
Other international |
60,390 |
540 |
30 |
|
|
Unknown |
0 |
0 |
10 |
|
|
|
All domiciles |
500,790 |
77,480 |
18,850 |
|
2019-20 |
UK |
423,700 |
75,070 |
19,550 |
|
EU |
29,980 |
360 |
30 |
|
|
Other international |
72,880 |
650 |
20 |
|
|
Unknown |
10 |
10 |
0 |
|
|
|
All domiciles |
526,560 |
76,090 |
19,610 |
|
2020-21 |
UK |
451,130 |
86,980 |
21,240 |
|
EU |
32,100 |
500 |
30 |
|
|
Other international |
69,560 |
2,360 |
20 |
|
|
Unknown |
40 |
0 |
0 |
|
|
|
All domiciles |
552,830 |
89,830 |
21,290 |
|
2021-22 |
UK |
456,660 |
74,160 |
24,950 |
|
EU |
10,750 |
270 |
50 |
|
|
Other international |
78,700 |
1,450 |
240 |
|
|
Unknown |
0 |
0 |
0 |
|
|
|
All domiciles |
546,110 |
75,870 |
25,240 |
Source: OfS, ‘Size and shape of provision data dashboard’. Data from all OfS registered providers.70
Note: For each category, student numbers have been rounded to the nearest ten, and totals were calculated using unrounded numbers and then rounded. This means that totals may not match the sum of the categories.
Table 4: Number of postgraduate entrants by domicile from 2018-19 to 2021-22
|
Academic year |
Domicile |
Full-time postgraduate |
Part-time postgraduate |
Apprenticeship postgraduate |
|
2018-19 |
UK |
102,710 |
74,530 |
3,660 |
|
|
EU |
19,040 |
2,580 |
20 |
|
|
Other international |
107,240 |
3,670 |
20 |
|
|
Unknown |
0 |
10 |
0 |
|
|
All domiciles |
228,990 |
80,780 |
3,700 |
|
2019-20 |
UK |
104,070 |
72,590 |
5,200 |
|
|
EU |
18,780 |
2,400 |
20 |
|
|
Other international |
134,110 |
3,690 |
50 |
|
|
Unknown |
0 |
0 |
0 |
|
|
All domiciles |
256,960 |
78,680 |
5,280 |
|
2020-21 |
UK |
128,270 |
84,780 |
8,350 |
|
|
EU |
18,730 |
2,710 |
20 |
|
|
Other international |
140,300 |
4,570 |
40 |
|
|
Unknown |
10 |
10 |
0 |
|
|
All domiciles |
287,310 |
92,070 |
8,400 |
|
2021-22 |
UK |
112,270 |
80,440 |
7,560 |
|
|
EU |
10,960 |
1,600 |
40 |
|
|
Other international |
198,890 |
4,620 |
250 |
|
|
Unknown |
0 |
20 |
0 |
|
|
All domiciles |
322,120 |
86,690 |
7,840 |
Source: OfS, ‘Size and shape of provision data dashboard’. Data from all OfS registered providers.71
Note: For each category, student numbers have been rounded to the nearest ten and totals were calculated using unrounded numbers and then rounded. This means that totals may not match the sum of the categories.
Table 5: Sex of full-time entrants to higher education from 2018-19 to 2020-21
|
|
Proportion of full-time undergraduate entrants |
Proportion of full-time postgraduate entrants |
||||||
|
|
2018-19 |
2019-20 |
2020-21 |
2021-22 |
2018-19 |
2019-20 |
2020-21 |
2021-22 |
|
Female |
55.9% |
55.7% |
56.0% |
55.1% |
58.7% |
57.6% |
56.7% |
55.8% |
|
Male |
44.0% |
44.3% |
43.9% |
44.7% |
41.2% |
42.2% |
43.1% |
43.9% |
|
Other sex |
0.1% |
0.1% |
0.1% |
0.2% |
0.2% |
0.2% |
0.2% |
0.3% |
Source: OfS, ‘Size and shape of provision data dashboard’. Data from all OfS registered providers.72
Entrants to higher education from disadvantaged groups in 2021-22
Data is for full-time undergraduate entrants at OfS registered providers (unless otherwise noted). Where a student characteristic is unknown or not applicable, the students are excluded from the relevant calculation of proportions.73
Socioeconomic background and students from the most deprived areas
23.0 per cent of entrants came from the most deprived areas (quintile 1 measured by the Index of Multiple Deprivation) and 19.5 per cent came from the least deprived areas in England in 2021-22 (quintile 5).74
50.2 per cent of entrants had parents working in higher managerial, administrative and professional occupations, 27.4 per cent had parents working in routine and manual occupations, and 0.7 per cent had parents who had never worked or were long-term unemployed.75
18.5 per cent of entrants were eligible for free school meals at key stage 4 or during the prior six years.76
Students from areas of low higher education participation
13.7 per cent of England-domiciled entrants came from areas of England with the lowest rates of participation in higher education (TUNDRA quintile 1).77
Black, Asian and minority ethnic students
The proportions of entrants to higher education by ethnic group were as follows:
- Asian or Asian British – Bangladeshi: 3.0 per cent
- Asian or Asian British – Chinese: 0.7 per cent
- Asian or Asian British – Indian: 3.8 per cent
- Asian or Asian British – other: 2.9 per cent
- Asian or Asian British – Pakistani: 5.2 per cent
- black or black British – African: 8.0 per cent
- black or black British – Caribbean: 1.8 per cent
- black or black British – other: 0.7 per cent
- Gypsy or Traveller: 0.1 per cent
- mixed – other: 1.7 per cent
- mixed – white and Asian: 1.7 per cent
- mixed – white and black African: 0.8 per cent
- mixed – white and black Caribbean: 1.3 per cent
- other ethnic group: 2.9 per cent
- white: 65.6 per cent.78
Mature students
Most of the students entering courses in 2021-22 were under the age of 21 on entry (70.4 per cent of entrants). In contrast, most of the students entering part-time undergraduate courses were mature students, aged 21 or over (86.3 per cent).79
Disabled students
15.6 per cent of entrants in 2021-22 reported having a disability. The proportions of entrants reporting different types of disability were:
- cognitive or learning difficulties – 5.1 per cent
- mental health conditions – 4.5 per cent
- multiple or other impairments – 2.8 per cent
- sensory, medical or physical impairments – 2.1 per cent
- social or communication impairments – 1.0 per cent.80
Care experienced students
1.2 per cent of entrants in 2021-22 have experience of being in care.
National Student Survey 2023 findings
In 2023, an updated NSS was distributed to final-year undergraduates across the UK. It asked about their academic experiences, including the teaching on their course, assessment and feedback, and how well courses are organised. There were new questions about mental wellbeing services and, in England, about freedom of expression. The response rate in England in 2023 was 71.3 per cent, with 290,706 students taking part.
The OfS’s KPM 4 uses data from the NSS. It evaluates the percentage of students responding positively to groups of questions about aspects of the quality of their academic experience. The results from the NSS in 2023 showed that in England:
- 84.7 per cent of students responded positively to questions about the teaching on their course
- 78.0 per cent responded positively to questions about assessment and feedback
- 83.4 per cent responded positively to questions about academic support
- 86.1 per cent responded positively to questions about learning resources
- 71.9 per cent responded positively to questions about student voice.81
Some findings from the NSS 2023 (English higher education providers)
- 90.6 per cent responded positively to ‘How good are teaching staff at explaining things?’
- 89.4 per cent responded positively to ‘How well have the library resources (e.g., books, online services and learning spaces) supported your learning?’
- 85.4 per cent responded positively to ‘How easy is it to access subject specific resources (e.g., equipment, facilities, software) when you need them?’
- 84.1 per cent responded positively on ‘How often is the course intellectually stimulating?’
- 75.9 per cent responded positively to ‘How well communicated was information about your university/college’s mental wellbeing support services?’
- 85.9 per cent responded positively to ‘During your studies, how free did you feel to express your ideas, opinions, and beliefs?’82
Student outcomes
It should be noted that the coronavirus pandemic could have had an impact on the student outcomes data given here. The UK entered three national lockdowns in 2020 and 2021, and there were also public health related restrictions outside these periods. The consequent changes to the structure of learning and assessment could have affected students’ decisions about continuing with their studies and negatively affected their opportunities to continue or complete higher education.
Continuation
Continuation rate: The proportion of entrants who were continuing to study a higher education qualification (or who had gained a qualification) one year and 15 days after they started their course (two years and 15 days for part-time students).
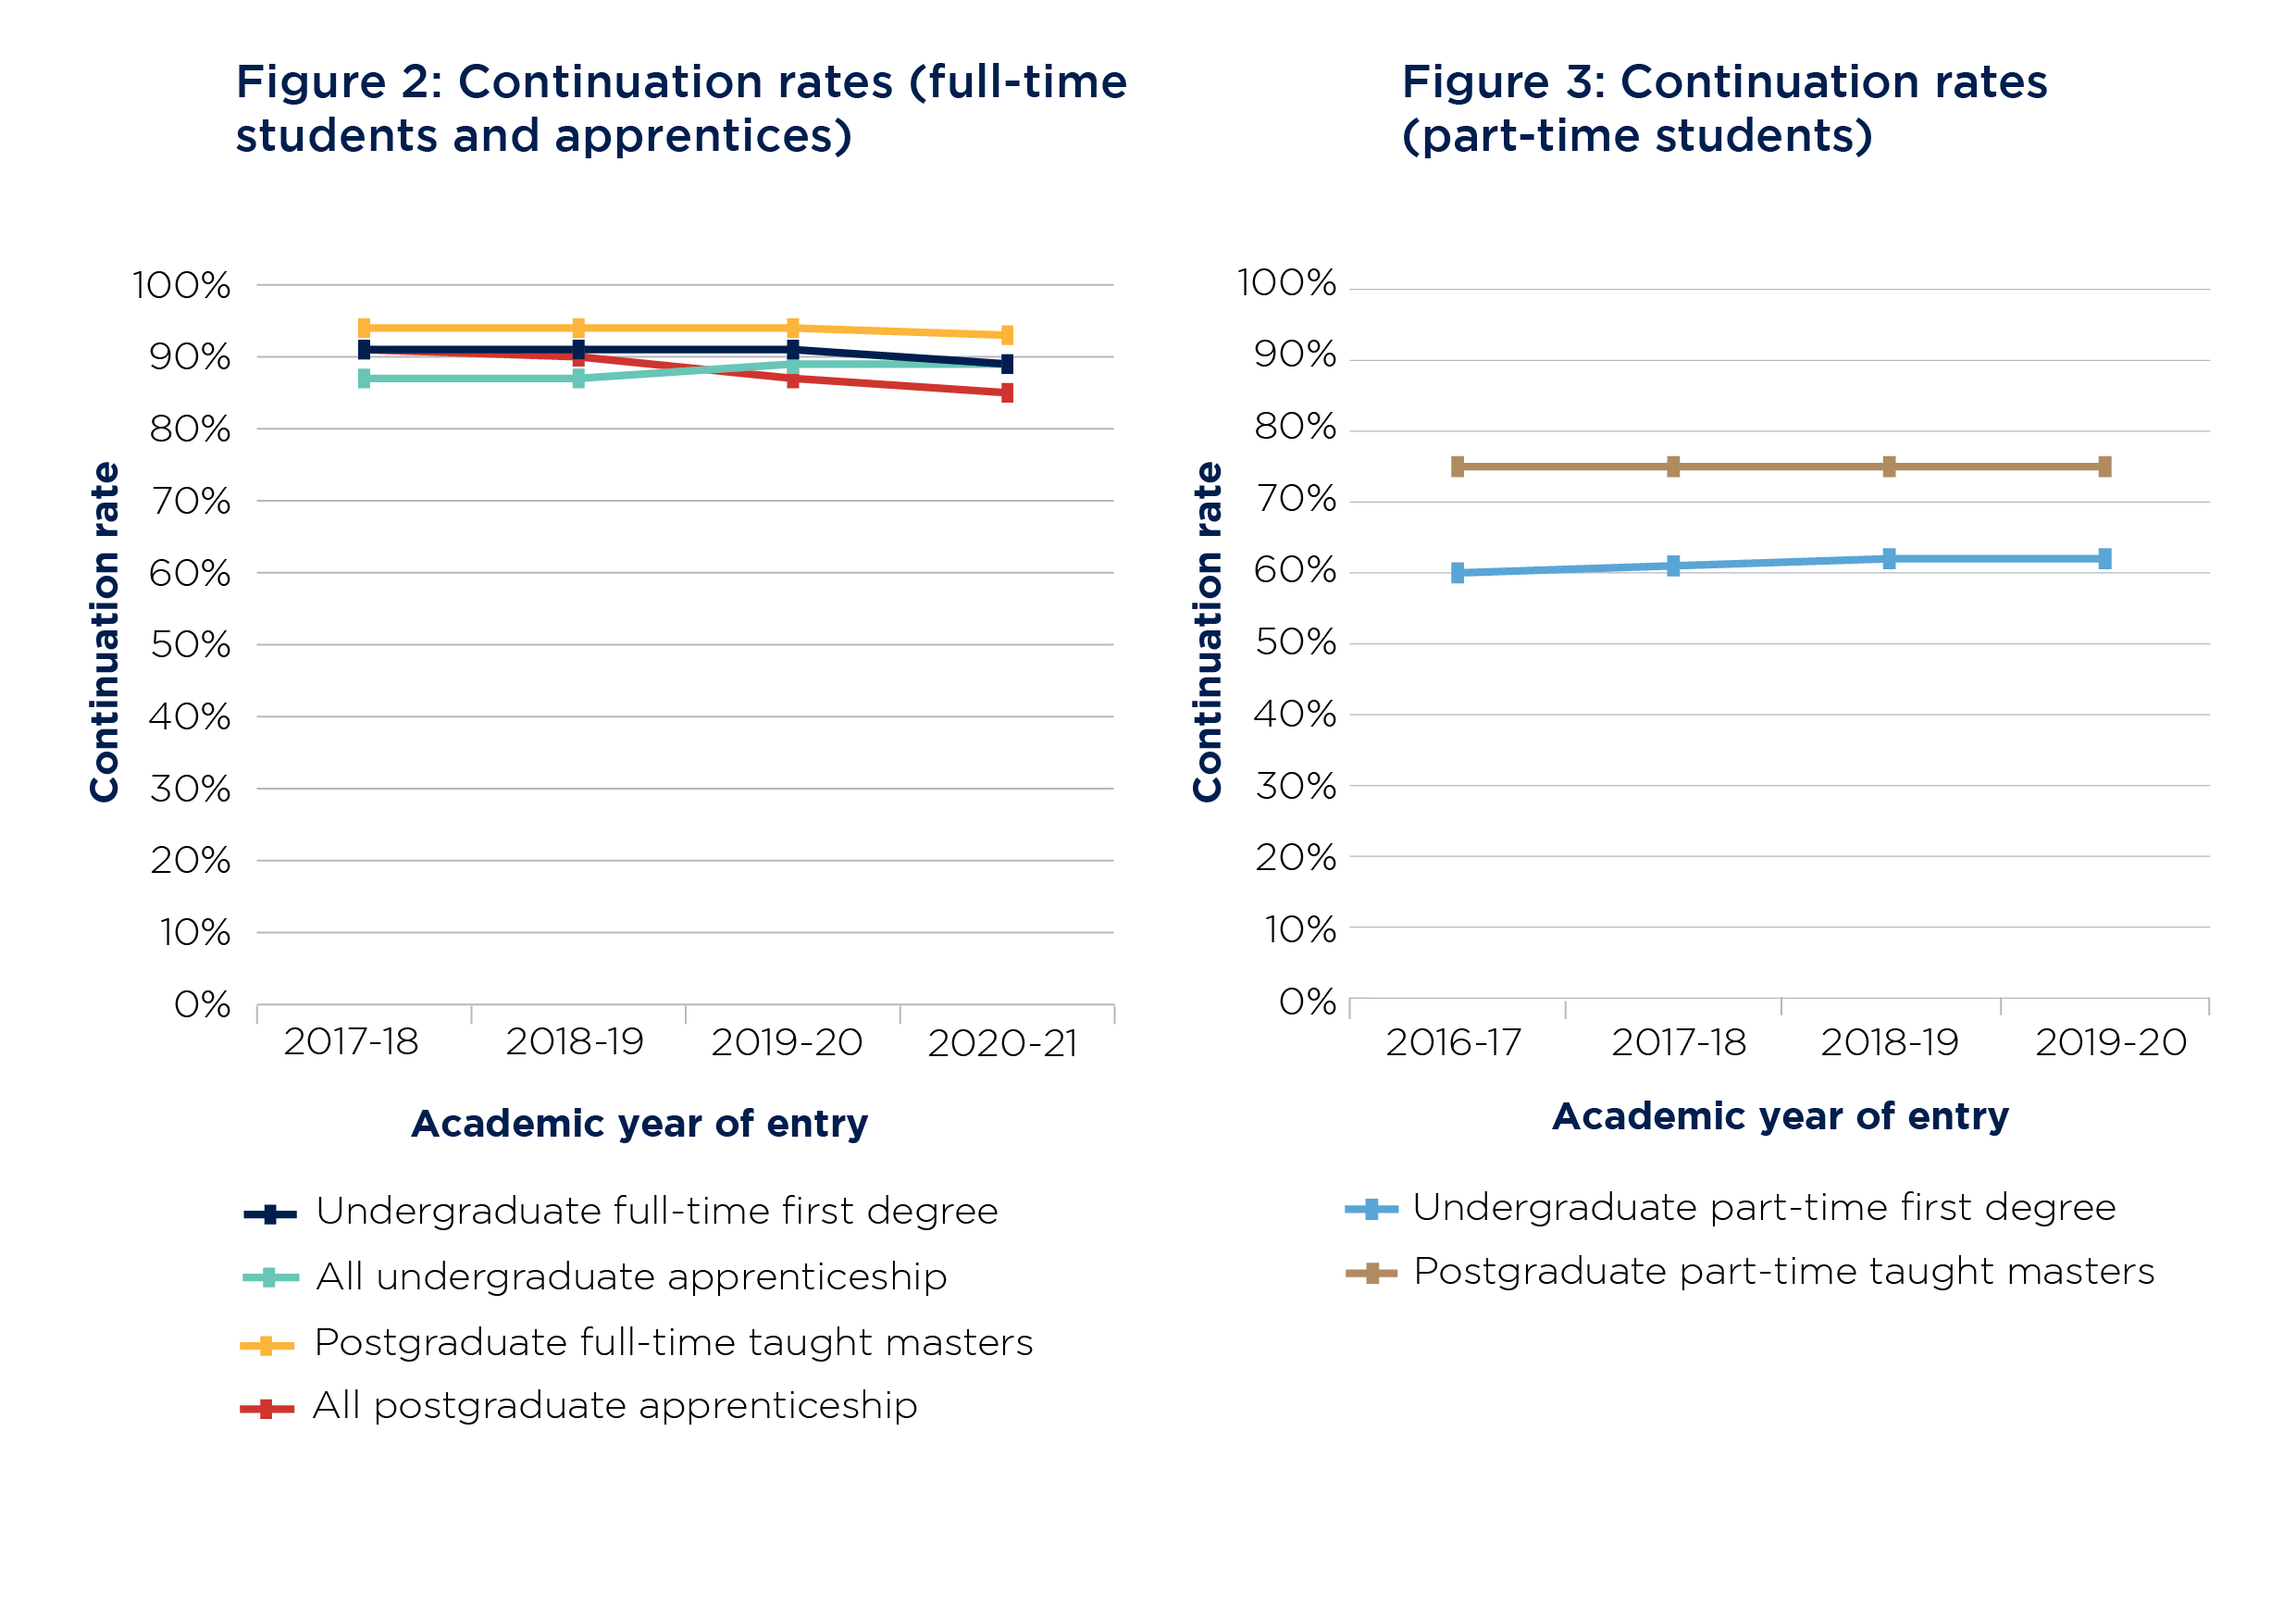
The continuation rate for full-time first degree students entering higher education in 2020-21 was 88.9 per cent, a decrease from 91.1 per cent for students entering in the previous academic year. Undergraduate apprentices (all modes of study) entering higher education in 2020-21 had a continuation rate of 88.5 per cent (a very slight decrease from 88.9 per cent for those entering in 2019-20).
For postgraduate students studying a full-time taught masters’ (entering higher education in 2020-21), the rate was 93.1 per cent. This is a slight decrease from the rate for the previous academic year (93.9 per cent). Postgraduate apprentices (all modes of study) entering higher education in 2020-21 had a continuation rate of 85.2 per cent (a decrease from 86.8 per cent for those entering in 2019-20).
Students studying part-time have lower continuation rates. Part-time undergraduate students entering first degrees in 2019-20 had a continuation rate of 62.1 per cent, an increase of 0.3 percentage points from 2018-19.83 See Figures 2 and 3 for more details about continuation rates.
Female full-time first degree students had a higher continuation rate than their male counterparts (92.0 per cent and 88.5 per cent respectively).84
The OfS’s KPM 1 looks at the extent of poor student outcomes. The proportion of students at providers where the relevant continuation indicator is below our minimum numerical threshold was 4.7 per cent for the most recent year of entry (2020-21 for full-time students and apprentices, 2019-20 for part-time students). This decreased from 7.9 per cent over the previous four years.85
Source: OfS, ‘Student outcomes data dashboard’. Data from all OfS registered providers – taught or registered population.86
Note: Part-time continuation rates are not yet available for entrants in 2020-21.
Figure 2 is a quadruple line graph showing continuation rates as a percentage for the years of entry 2017-18 to 2020-21 for the following groups of students: undergraduate full-time first degree, all undergraduate apprenticeship, postgraduate full-time taught masters, and all postgraduate apprenticeship. The rates for all undergraduate apprenticeships have risen slightly from 2018-19, while those for all the other groups have fallen slightly, most clearly in the case of all postgraduate apprenticeships.
Figure 3 is a double line graph showing continuation rates as a percentage for the years of entry 2016-17 to 2019-20 for the following groups of students: undergraduate part-time first degree and postgraduate part-time taught masters. Both have remained roughly similar over time, with slight growth in the rates for undergraduate part-time first degree students. Both rates, however, are significantly lower overall than those for full-time students shown in Figure 2.
Continuation rates for disadvantaged groups
Except where otherwise noted, this data is for full-time first degree students (all domiciles) and is for four years in aggregate (entrants from 2017-18 to 2020-21).87 It describes actual differences between the disadvantaged group chosen and a reference group. No other factors (for example, entry qualifications) have been taken into account.
Socioeconomic background and students from the most deprived areas
Students from the most deprived areas of England (quintiles 1 and 2 measured by the Index of Multiple Deprivation) and least deprived areas (quintiles 3, 4, and 5) have continuation rates of 87.5 per cent and 92.5 per cent respectively.88 Those students who were eligible for free school meals at key stage 4 (or any stage before that) have a continuation rate of 88.4 per cent, compared with 93.1 per cent for those not eligible for free school meals.89
Black, Asian and minority ethnic students
Most black and minority ethnic groups have lower continuation rates than the white ethnic group (91.5 per cent). Exceptions to this are the following ethnic groups: Asian or Asian British – Chinese; Asian or Asian British – Indian; and Mixed ethnicity – white and Asian. The continuation rates for student groups by ethnic background are as follows:
- Asian or Asian British – Bangladeshi – 86.2 per cent
- Asian or Asian British – Chinese – 95.3 per cent
- Asian or Asian British – Indian – 93.6 per cent
- Asian or Asian British – Pakistani – 89.7 per cent
- Asian or Asian British – other – 91.1 per cent
- black or black British – African – 87.0 per cent
- black or black British – Caribbean – 83.8 per cent
- black or black British – other – 83.6 per cent
- mixed – white and Asian – 92.7 per cent
- mixed – white and black African – 88.0 per cent
- mixed – white and black Caribbean – 87.5 per cent
- mixed – other – 88.5 per cent
- other ethnic group – 87.7 per cent
- Gypsy or Traveller – 79.1 per cent.90
Mature students
Mature students (whose ages on entry to higher education were 21 or over) have lower continuation rates in every age group, compared with 92.3 per cent for young students. The continuation rates for mature students by age group on entry to higher education are as follows:
- 21 to 25 years – 85.4 per cent
- 26 to 30 years – 83.8 per cent
- 31 to 40 years – 84.6 per cent
- 41 to 50 years – 84.7 per cent
- 51 years and over – 81.4 per cent.
Disabled students
Students with no reported disability have a continuation rate of 90.6 per cent. Students with reported disabilities have lower continuation rates, with the exception of students with reported cognitive or learning difficulties. The continuation rates for these students by reported disability are as follows:
- cognitive or learning difficulties – 92.1 per cent
- mental health condition – 87.7 per cent
- multiple or other impairments – 89.3 per cent
- sensory, medical or physical impairments – 89.7 per cent
- social or communication impairment – 89.2 per cent
Care experienced students
Students who have experienced being in care have lower continuation rates than those who have not (85.6 per cent and 91.3 per cent respectively).91
Completion
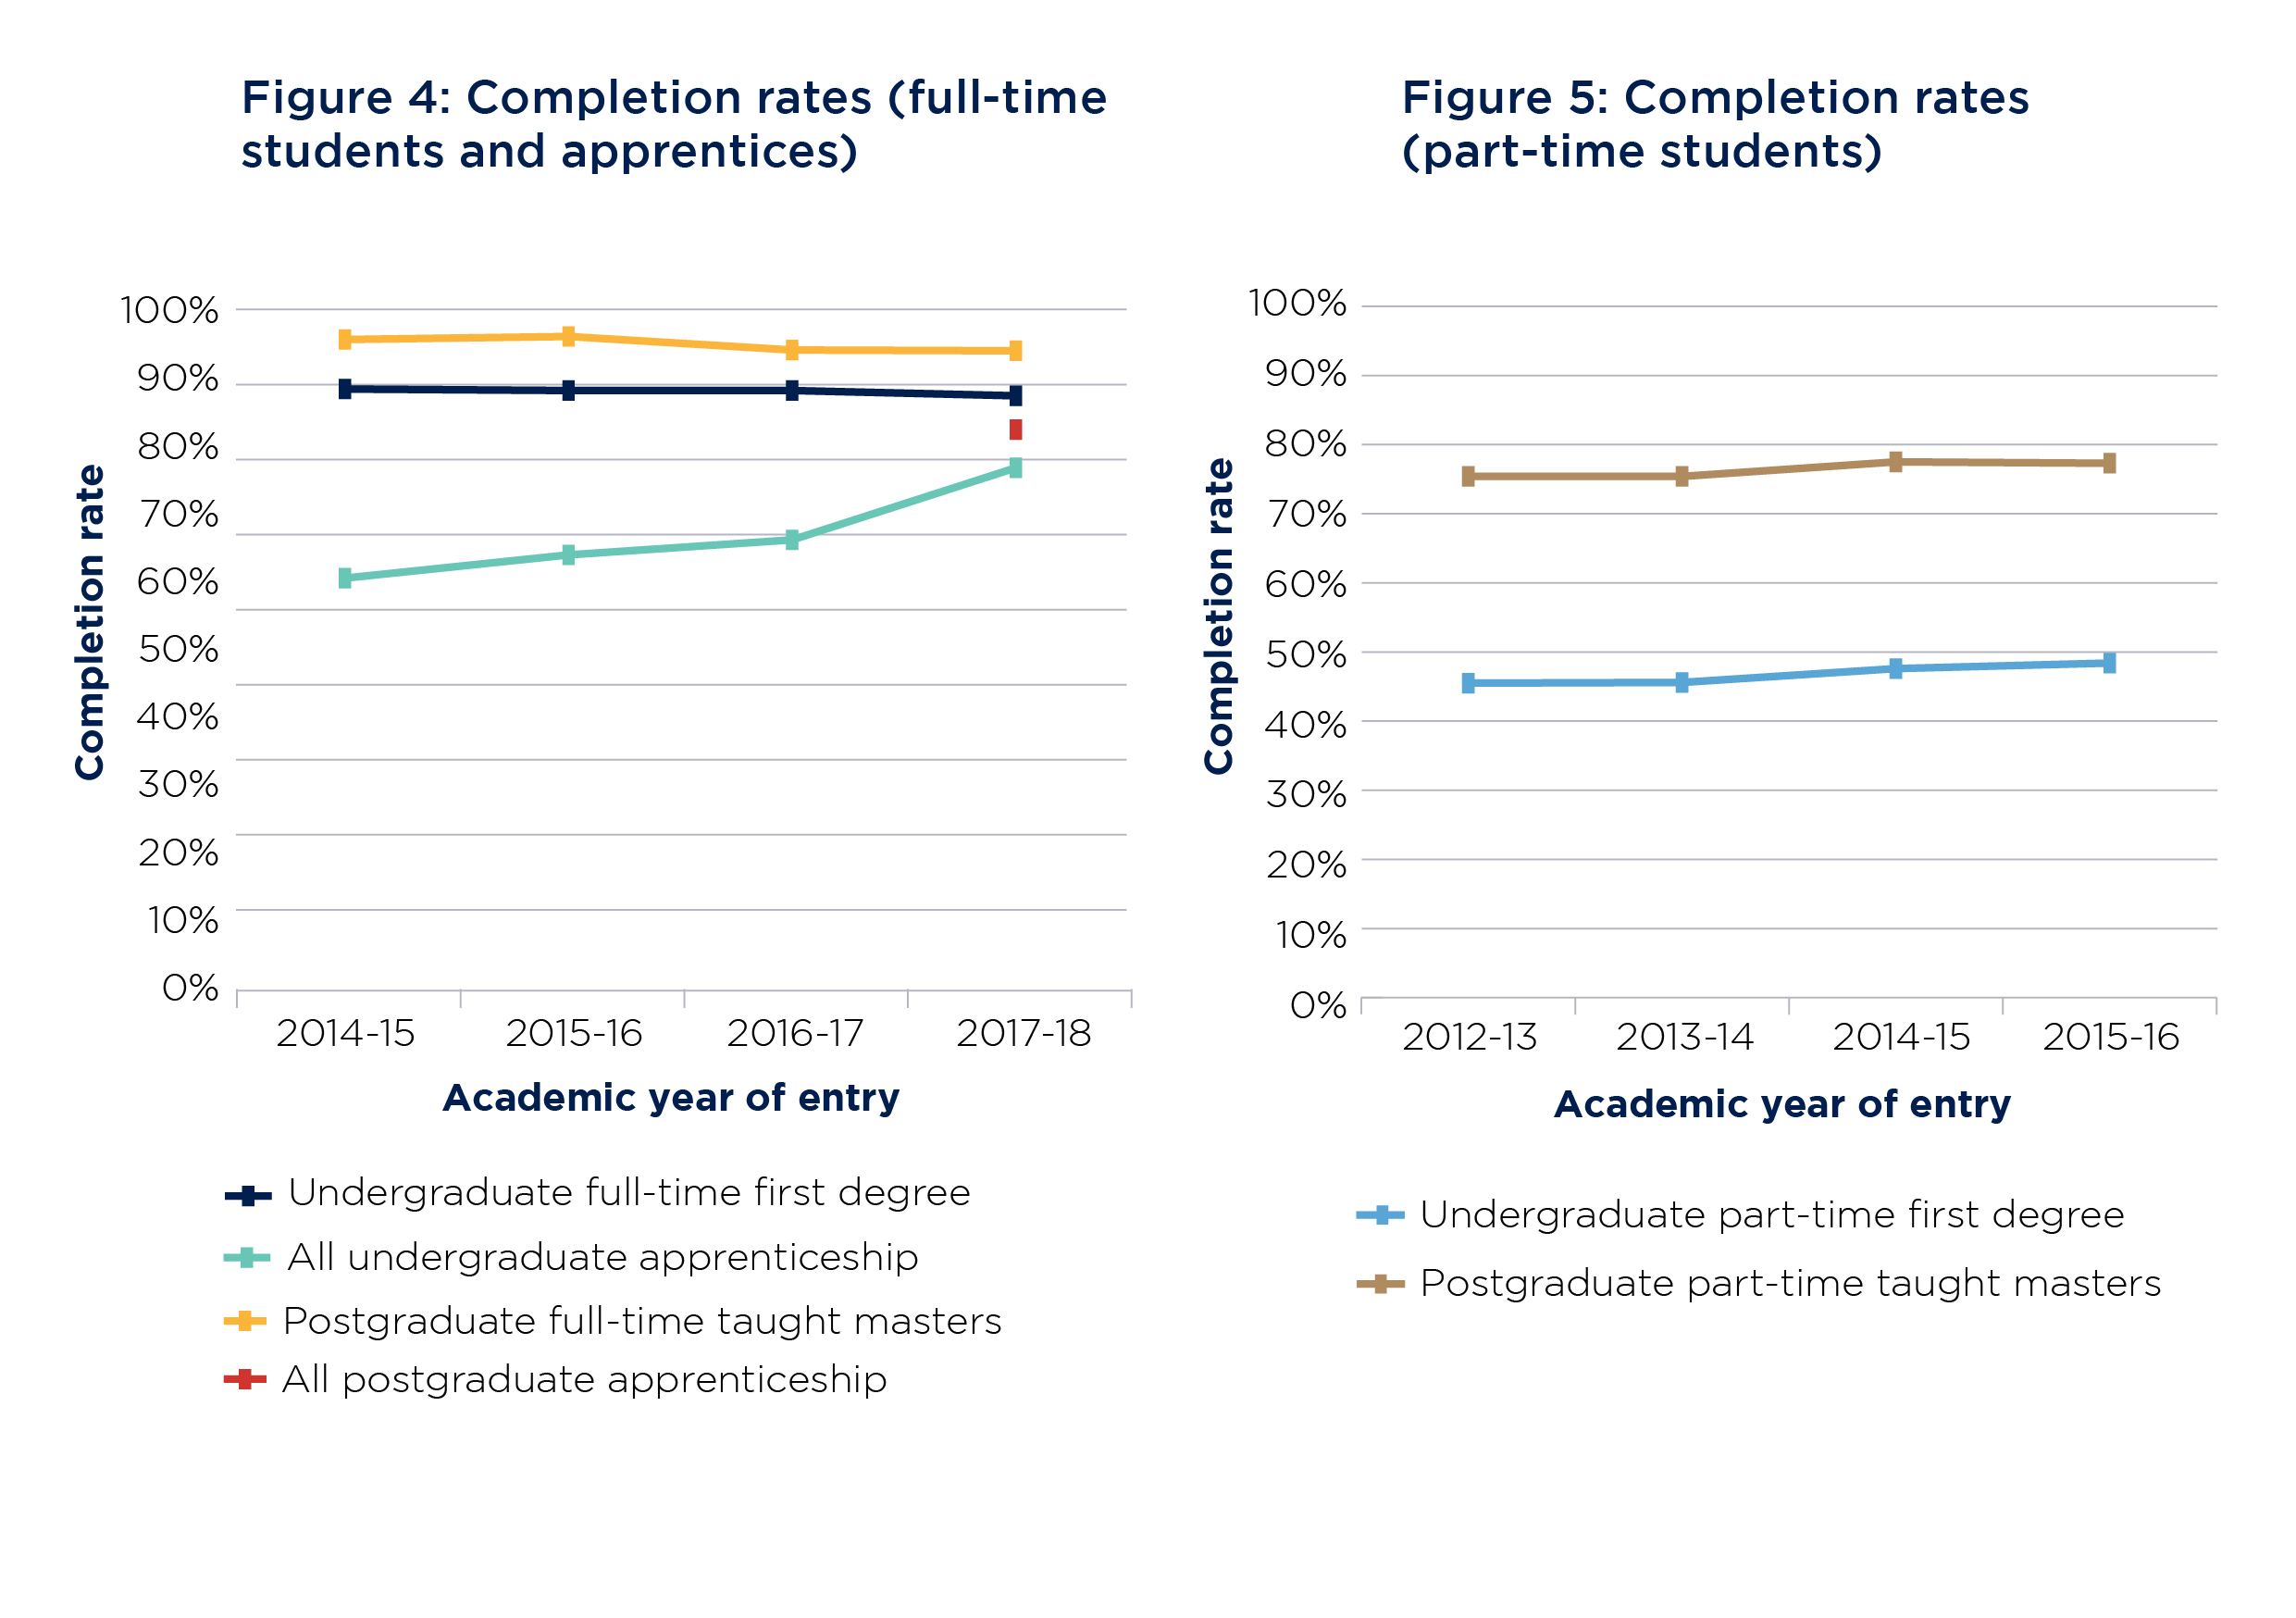
Completion rate: The proportion of entrants who gained a higher education qualification (or were continuing in the study of a qualification) four years and 15 days after they started their course (six years and 15 days for part-time students).
The completion rate for full-time students entering first degrees in 2017-18 is 88.5 per cent (a decrease of 0.7 percentage points from the previous year). For their part-time counterparts the rate for those entering in 2015-16 (the latest available data) is much lower, 48.4 per cent (an increase of 0.8 percentage points from the previous year). Female full-time first degree students have a higher completion rate than their male equivalents (91.3 per cent and 86.1 per cent respectively).92
Undergraduate apprentices (all modes of study) entering in 2017-18 have a completion rate of 78.9 per cent. This is noticeably higher than the previous academic year (an increase of 9.6 percentage points). For postgraduate apprentices (all modes of study) entering in the same year, the completion rate is 84.0 per cent. There is no data available for previous years for postgraduate apprenticeships.
For postgraduate students starting a full-time taught masters’ in 2017-18, the completion rate is 94.5 per cent, 0.1 percentage points lower than the previous academic year. The completion rate for their part-time counterparts entering in 2015-16 is lower at 77.3 per cent.93
For more information on completion rates, see Figures 4 and 5.
The proportion of students at higher education providers where the relevant completion indicator is below our minimum numerical threshold is 7.0 per cent for the most recent year (2017-18 for full-time students and apprentices, 2015-16 for part-time students). This decreased from 9.4 per cent over the previous four years.94
Source: OfS, ‘Student outcomes data dashboard’. Data from all OfS registered providers – taught or registered population.95
Note: Part-time completion rates are not yet available for 2016-17 onwards. Postgraduate apprenticeship completion rates are only available for the year of entry 2017-18.
Figure 4 is a triple line graph showing completion rates as a percentage for the years of entry 2014-15 to 2017-18 for the following groups of students: undergraduate full-time first degree, all undergraduate apprenticeship, and postgraduate full-time taught masters. Rates of completion for postgraduate apprenticeship students are only available from 2017-18, so are shown as a single point. During this time the rates for undergraduate full-time first degree and postgraduate full-time taught masters have declined slightly, while those for all undergraduate apprenticeship have risen sharply.
Figure 5 is a double line graph showing completion rates as a percentage for the years of entry 2012-13 to 2015-16 for the following groups of students: undergraduate part-time first degree and postgraduate part-time taught masters. Both have remained roughly similar over time, with slight growth. Both rates, however, are significantly lower overall than those for full-time students shown in Figure 4.
Completion rates for disadvantaged groups
Except where otherwise noted, this data is for full-time first degree students (all domiciles) and is for four years in aggregate (entrants from 2014-15 to 2017-18).96 It describes actual differences between the disadvantaged group chosen and a reference group. No other factors (for example, entry qualifications) have been taken into account.
Socioeconomic background and students from the most deprived areas
Students from the most deprived areas of England (quintiles 1 and 2 measured by the Index of Multiple Deprivation) and least deprived areas (quintiles 3, 4, and 5) have completion rates of 84.5 per cent and 90.9 per cent respectively.97 Those students who were eligible for free school meals at key stage 4 (or any stage before that) have a completion rate of 84.0 per cent, compared with 91.2 per cent for those not eligible for free school meals.98
Black, Asian and minority ethnic students
Black, Asian and minority ethnic groups have lower completion rates than the white ethnic group (89.7 per cent). The exceptions to this are the following ethnic groups: Asian or Asian British – Chinese, Asian or Asian British – Indian, and Mixed ethnicity – white and Asian. The completion rates for student groups by ethnic background are as follows:
- Asian or Asian British – Bangladeshi – 84.3 per cent
- Asian or Asian British – Chinese – 93.9
- Asian or Asian British – Indian – 91.5
- Asian or Asian British – Pakistani – 86.1
- Asian or Asian British – other – 88.1 per cent
- black or black British – African – 83.9 per cent
- black or black British – Caribbean – 80.2 per cent
- black or black British – other – 79.1 per cent
- mixed – white and Asian – 90.8 per cent
- mixed – white and black African – 84.3 per cent
- mixed – white and black Caribbean – 83.8 per cent
- mixed – other – 85.5 per cent
- other ethnic group – 85.1 per cent
- Gypsy or Traveller – 81.3 per cent.99
Mature students
Mature students (whose ages on entry to higher education were 21 or over) have lower completion rates in every age group, compared with young students at 90.6 per cent. The completion rates for mature students by age group on entry to higher education are as follows:
- 21 to 25 years – 84.0 per cent
- 26 to 30 years – 82.5 per cent
- 31 to 40 years – 83.5 per cent
- 41 to 50 years – 82.7 per cent
- 51 years and over – 75.9 per cent.
Disabled students
Students with no reported disability have a completion rate of 89.4 per cent. Students with reported disabilities have lower continuation rates. The completion rates for these students by reported disability are as follows:
- cognitive or learning difficulties – 89.1 per cent
- mental health condition – 82.8 per cent
- multiple or other impairments – 85.2 per cent
- sensory, medical or physical impairments – 87.0 per cent
- social or communication impairment – 84.7 per cent
Care experienced students
Students who have experienced being in care have lower completion rates than those who have not (79.6 per cent and 89.2 per cent respectively).100
Attainment
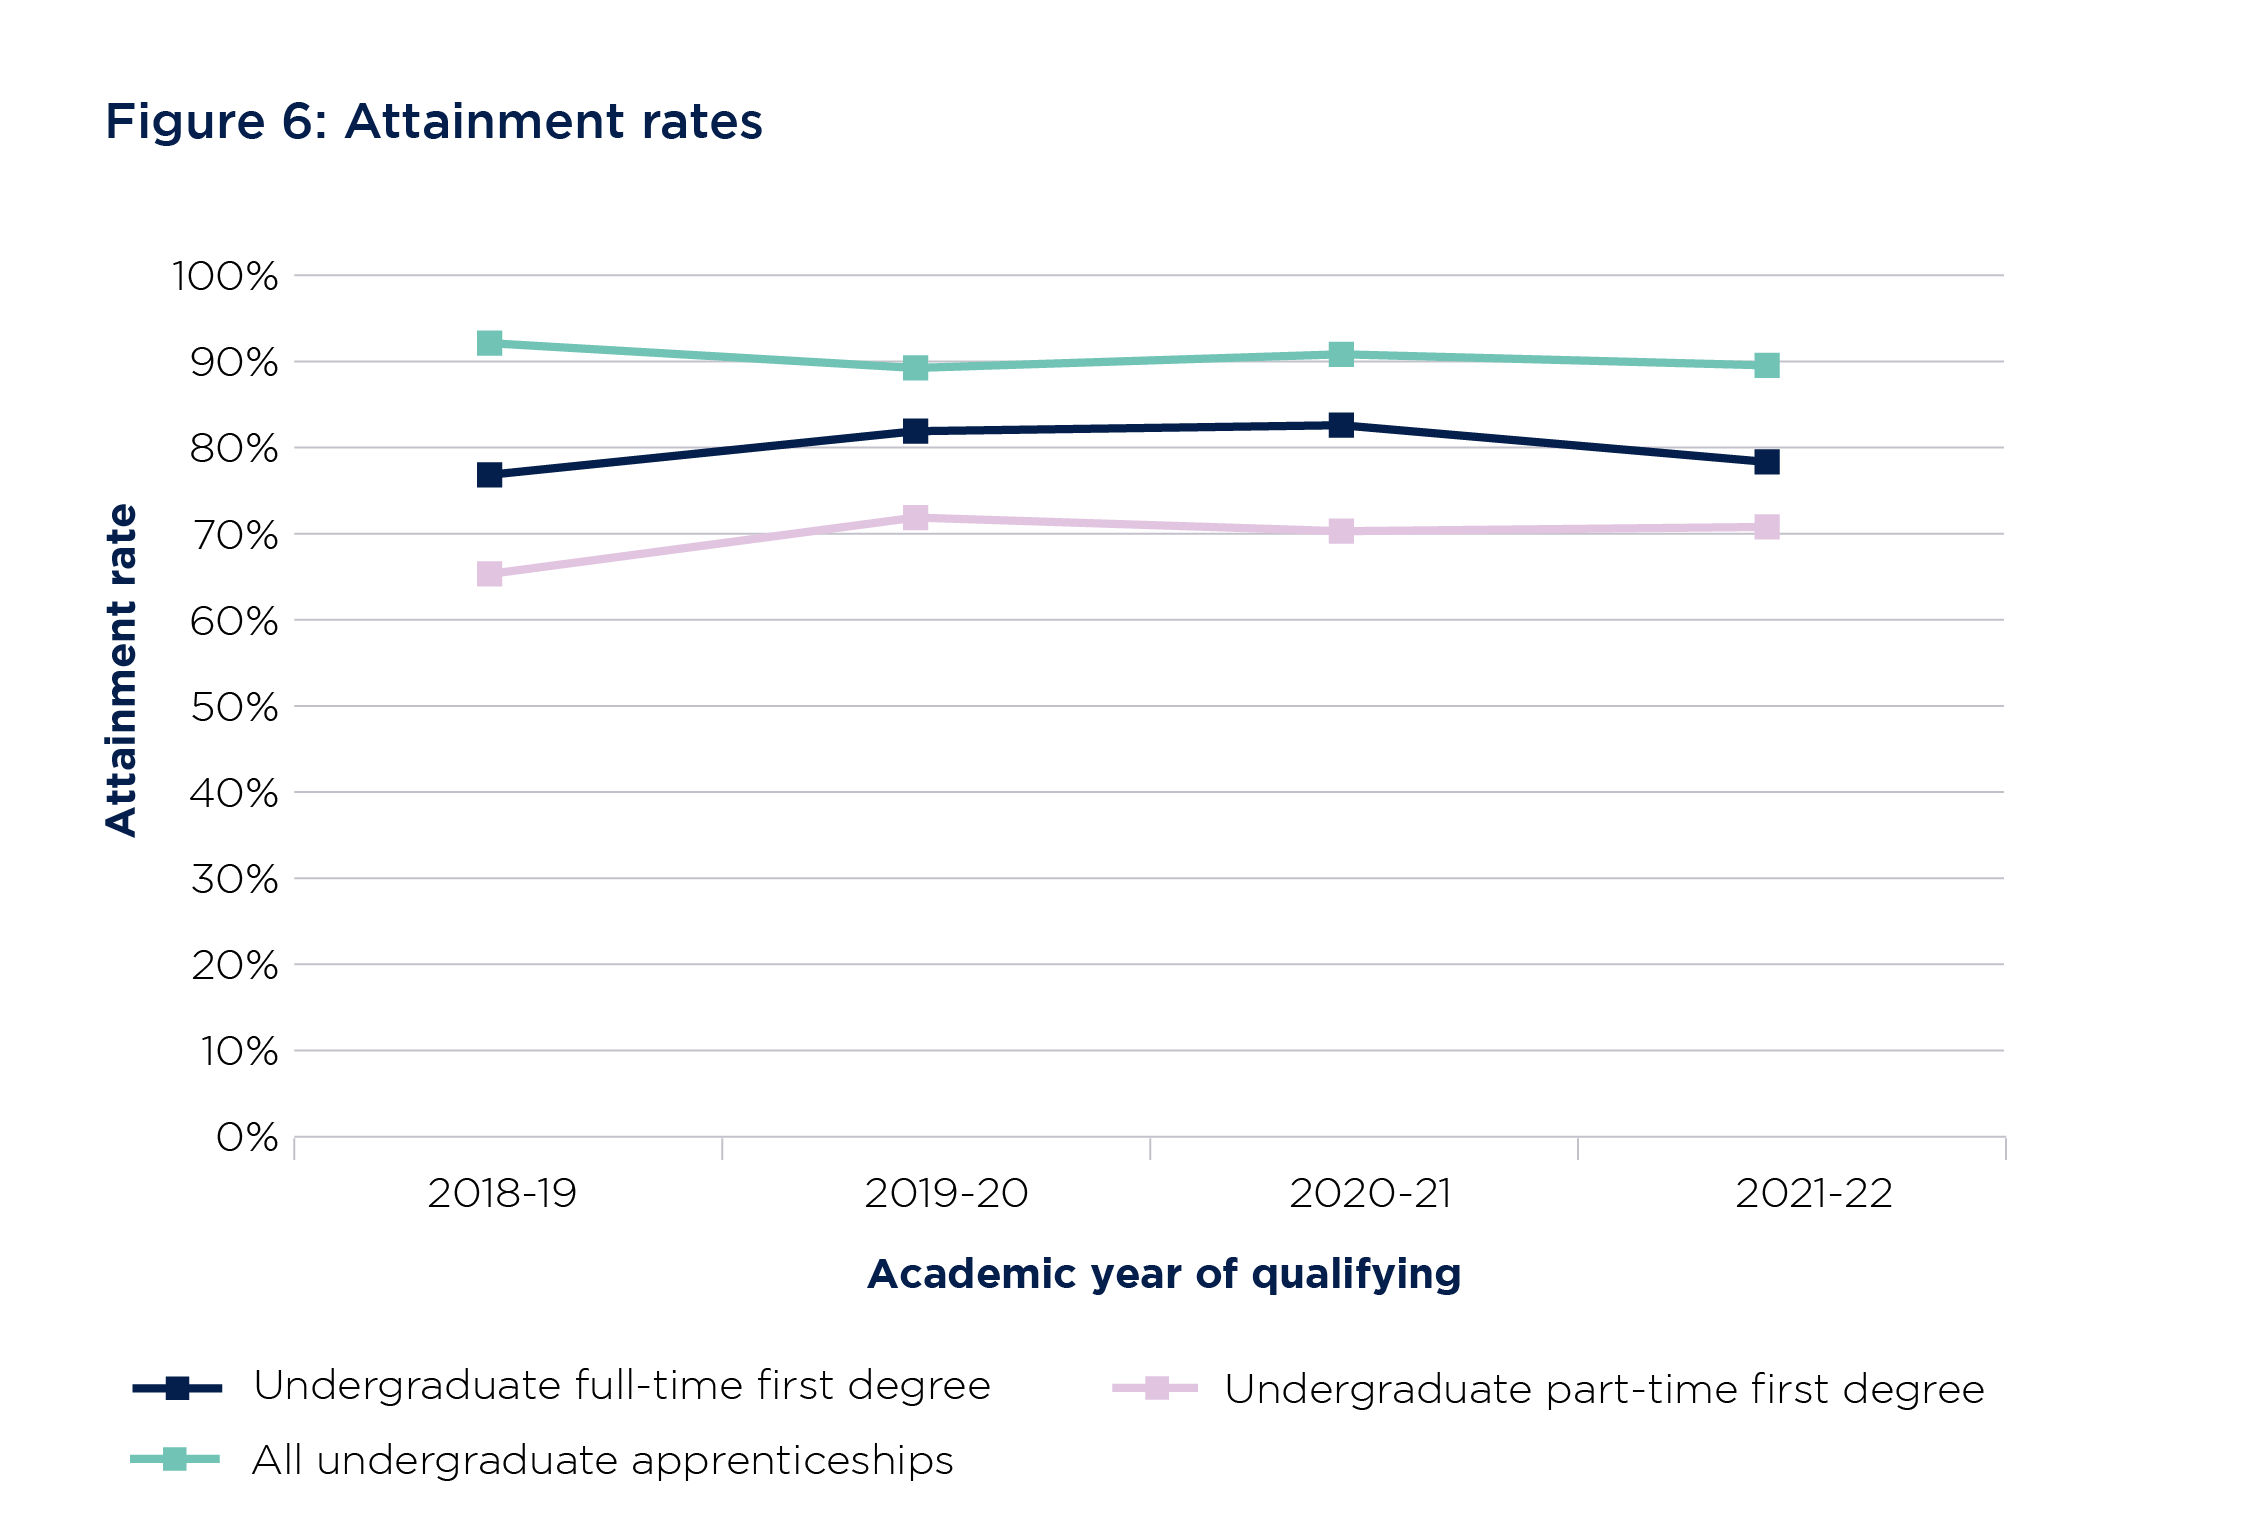
Attainment rate: The proportion of undergraduate qualifiers who achieved a first or upper second class grade for their first degree.
The data for overall attainment rates is taken from the access and participation data dashboard as this data is not included in the Student outcomes data dashboard, and only applies to undergraduate qualifiers.101
Undergraduate full-time first degree students who qualified in 2021-22 have an attainment rate of 78.1 per cent. This is a decrease from 82.4 per cent in 2020-21. Their part-time counterparts have a lower attainment rate of 70.5 per cent for qualifiers in 2021-22 (a 0.5 percentage point increase from the previous academic year). The attainment rate for undergraduate apprentices (all modes of study) is 89.4 per cent for those qualifying in 2021-22 (a decrease of 1.3 percentage points from 2020-21).102 See Figure 6 for information about attainment rates for years of qualifying 2018-19 to 2021-22. The introduction by many OfS-registered providers in the 2019-20 and 2020-21 academic years of a ‘no detriment’ policy typically ensured no student would be awarded a final grade lower than the most recent provider assessment of their attainment.103 This may have affected attainment rates in the 2019-20 and 2020-21 academic years.
Female full-time first degree students have a higher attainment rate than their male equivalents (81.5 per cent and 77.1 per cent respectively).104
Source: OfS, ‘Access and participation data dashboard’, last updated July 2023. Data from all OfS registered providers – registered population.105
Note: Attainment rates pertain only to undergraduate qualifiers.
Figure 6 is a triple line graph showing attainment rates as a percentage for the years of qualifying 2018-19 to 2021-22 for the following groups of students: undergraduate full-time first degree, undergraduate part-time first degree, and all undergraduate apprenticeships. While the attainment rates for undergraduate apprenticeships have remained roughly steady over time, the attainment rates for both full-time and part-time undergraduate first degree qualifiers increased between 2018-19 and 2019-20. The highest completions rates are for all undergraduate apprenticeships, whereas the lowest are for undergraduate part-time first degree.
Attainment rates for disadvantaged groups
Except where otherwise noted, this data is for full-time first degree students (all domiciles) and is for four years in aggregate (qualifiers from 2018-19 to 2021-22).106 It describes actual differences between the disadvantaged group chosen and a reference group. No other factors (for example, entry qualifications) have been taken into account. The four-year aggregate includes data from 2019-20 and 2020-21 during which many OfS-registered providers introduced ‘no detriment’ policies because of the coronavirus pandemic. Attainment rates in 2019-20 and 2020-21 were higher than in pre-pandemic years and 2021-22, contributing to elevated aggregate attainment rates. See also our KPM 7: Degree attainment by ethnicity.107
Socioeconomic background and students from the most deprived areas
Students from the most deprived areas of England (quintiles 1 and 2 measured by the Index of Multiple Deprivation) and least deprived areas (quintiles 3, 4, and 5) have attainment rates of 72.5 per cent and 83.9 per cent respectively. Those students who were eligible for free school meals at key stage 4 (or any stage before that) have an attainment rate of 71.2 per cent, compared with 82.8 per cent for those not eligible for free school meals.108
Black, Asian and minority ethnic students
Black, Asian and minority ethnic groups all have lower attainment rates than the white ethnic group (83.6 per cent). The exception to this is the mixed – white and Asian ethnic group. The attainment rates for student groups by ethnic background are as follows:
- Asian or Asian British – Bangladeshi – 70.6 per cent
- Asian or Asian British – Chinese – 81.5 per cent
- Asian or Asian British – Indian – 80.5 per cent
- Asian or Asian British – Pakistani – 70.1 per cent
- Asian or Asian British – other – 73.0 per cent
- black or black British – African – 62.8 per cent
- black or black British – Caribbean – 66.2 per cent
- black or black British – other – 60.6 per cent
- mixed – white and Asian – 84.8 per cent
- mixed – white and black African – 74.8 per cent
- mixed – white and black Caribbean – 77.0 per cent
- mixed – other – 78.7 per cent
- other ethnic group – 72.1 per cent
- Gypsy or Traveller – 65.0 per cent.109
Mature students
Young students (aged under 21 years on entry to higher education) have an attainment rate of 81.6 per cent. Mature students have lower attainment rates (compared with young students) for all age groups. The attainment rates for mature students by age group on entry to higher education are as follows:
- 21 to 25 years – 73.5 per cent
- 26 to 30 years – 74.1 per cent
- 31 to 40 years – 71.5 per cent
- 41 to 50 years – 66.9 per cent
- 51 years and over – 63.5 per cent.
Disabled students
Students with no reported disability have an attainment rate of 79.9 per cent. Students with reported disabilities have lower attainment rates, with the exception of students with a reported mental health condition. The attainment rates for these students by reported disability are as follows:
- cognitive or learning difficulties – 77.9 per cent
- mental health condition – 80.8 per cent
- multiple or other impairments – 79.8 per cent
- sensory, medical or physical impairments – 79.4 per cent
- social or communication impairment – 74.4 per cent.
Care experienced students
Students who have experienced being in care have lower attainment rates than those who have not (68.8 per cent and 81.1 per cent respectively).110
Progression
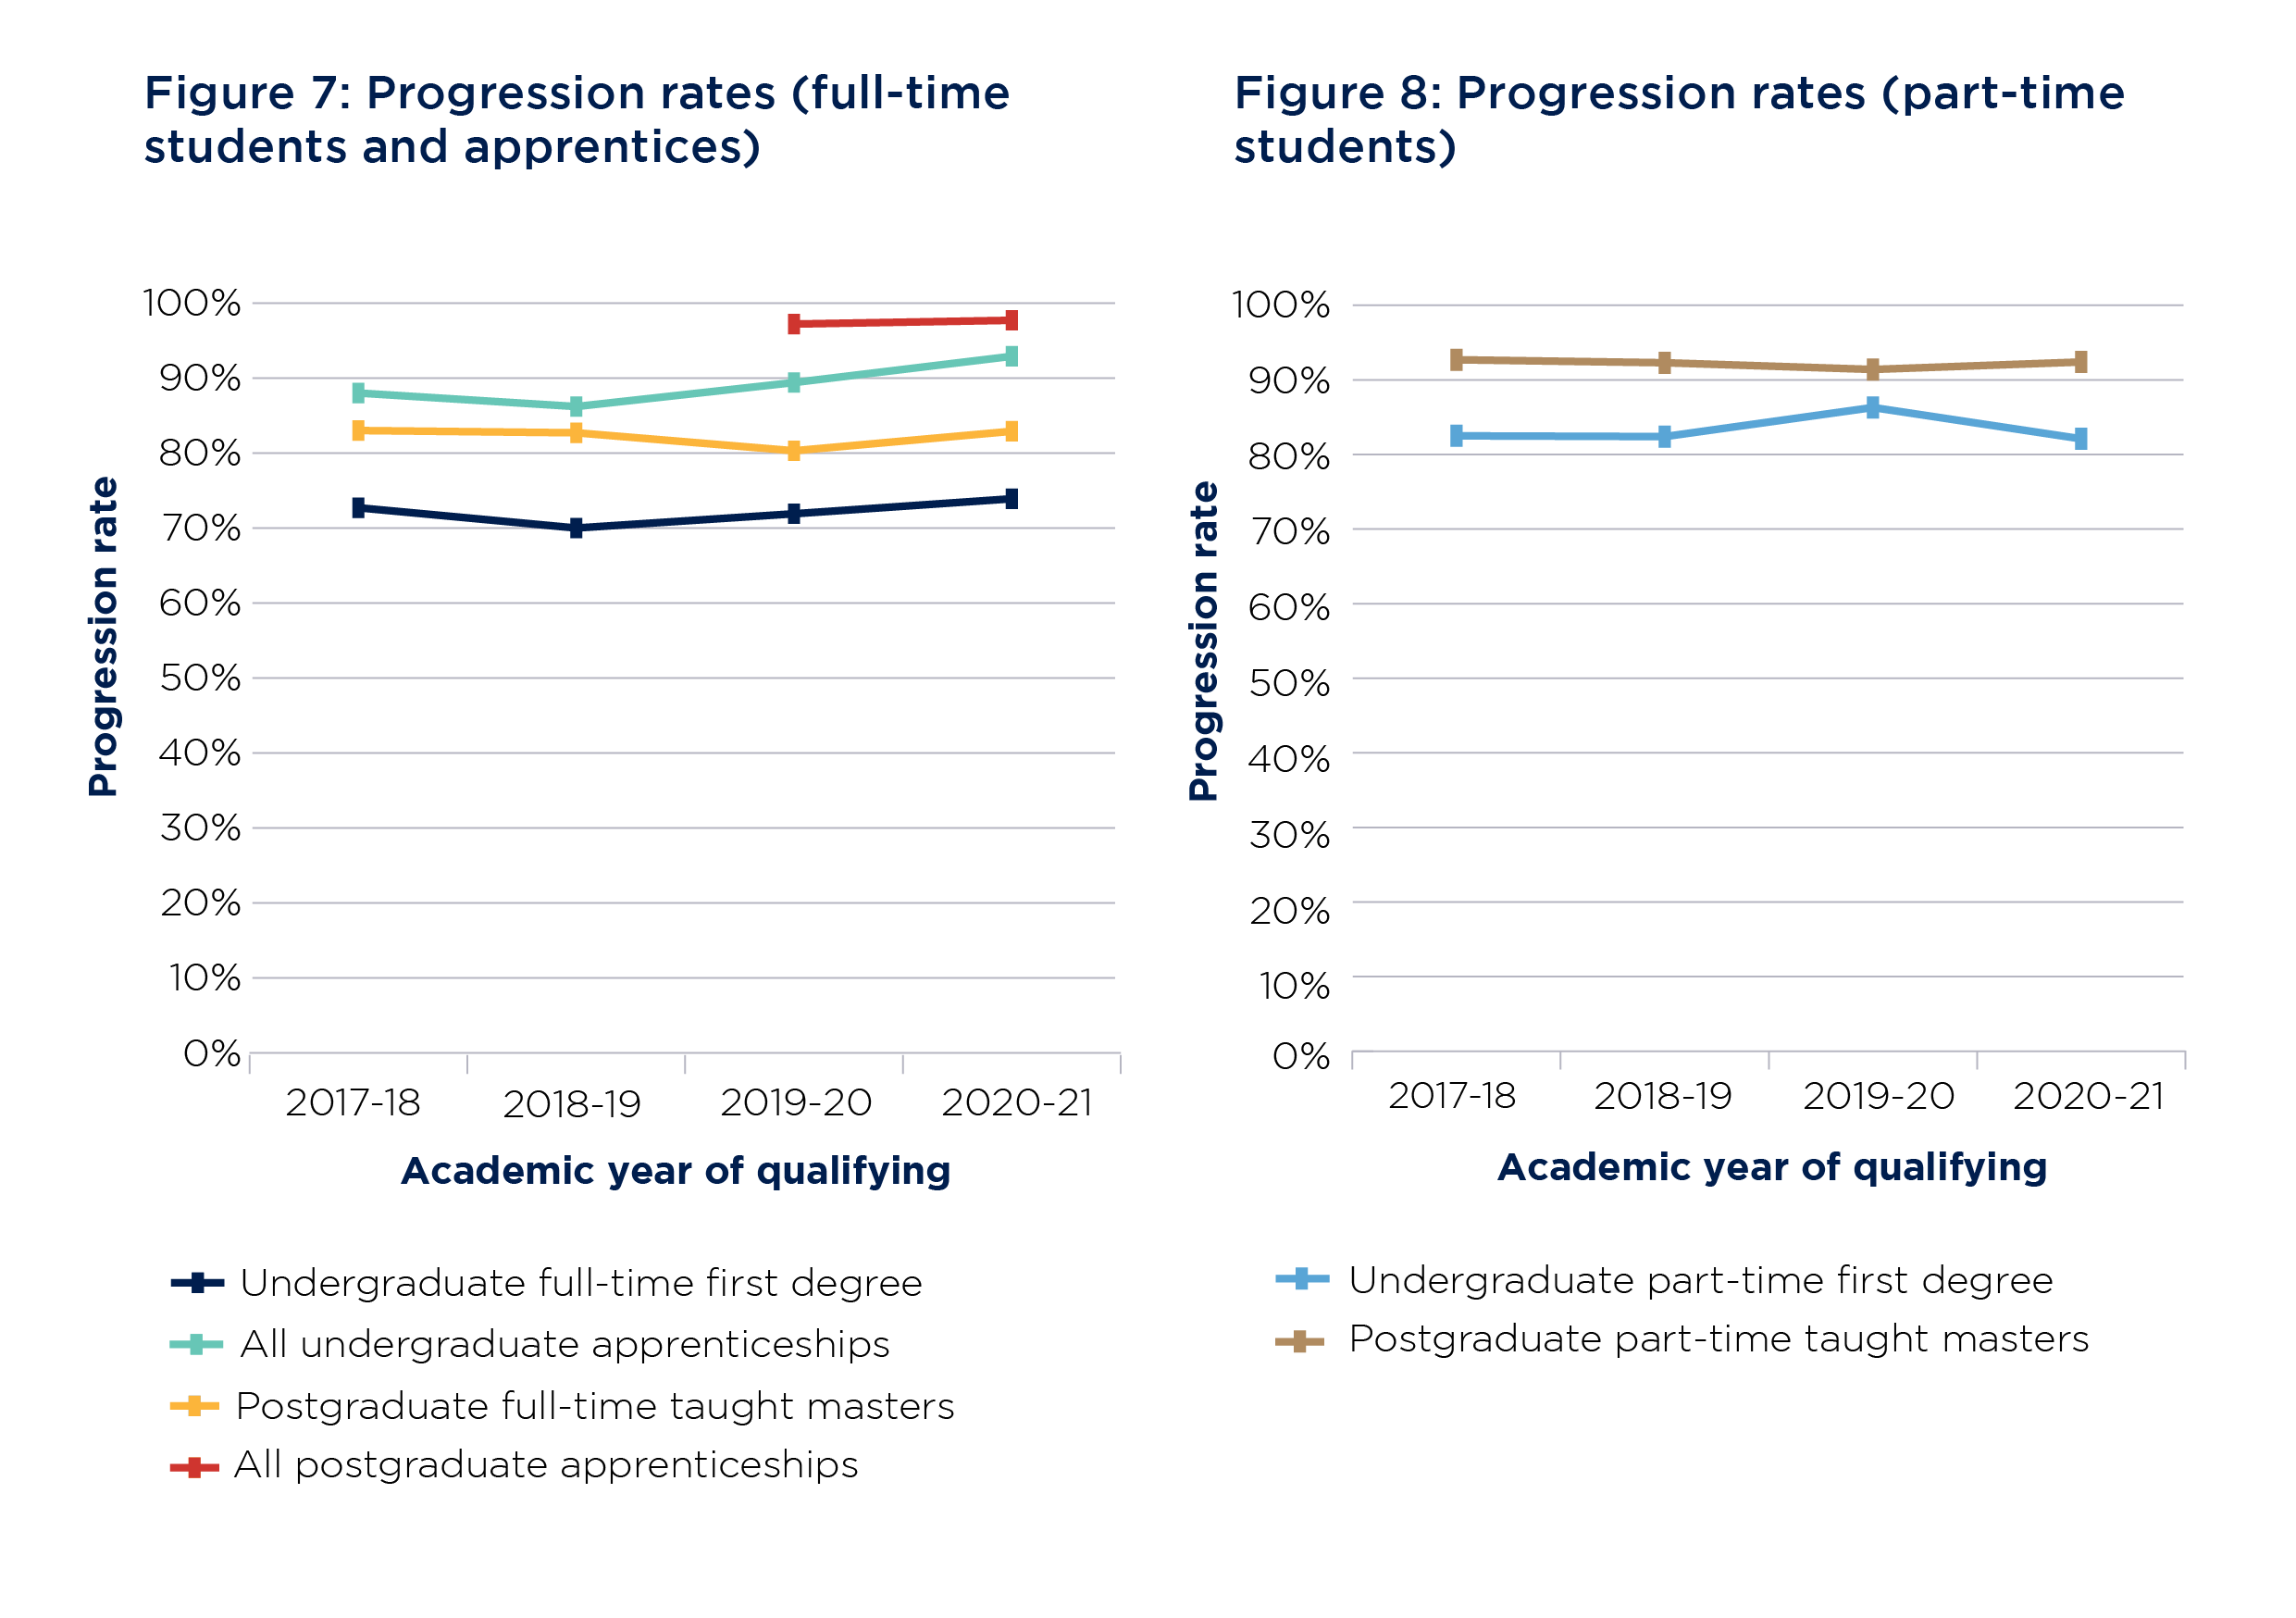
Progression rate: The proportion of qualifiers who identified managerial or professional employment, further study, or other positive outcomes among the activities that they were undertaking at the Graduate Outcomes survey census date, 15 months after they left higher education.111
The progression rate for full-time first degree students gaining a higher education qualification in 2020-21 is 73.9 per cent (an increase from 71.9 for the previous academic year). Their part-time counterparts have a higher progression rate of 82.1 per cent (a decrease from 86.3 per cent in the previous academic year).
Female full-time first degree students have a slightly lower progression rate than male students (71.6 per cent and 72.8 per cent respectively).112
For postgraduate students studying a full-time taught masters and qualifying in 2020-21, the progression rate is 82.9 per cent (an increase from 80.3 per cent in 2019-20). Part-time postgraduate students studying a taught masters have a higher progression rate of 92.4 per cent (an increase from 91.4 in 2019-20).
Undergraduate apprentices (all modes of study) qualifying in 2020-21 have a progression rate of 92.9 per cent (an increase of 3.5 percentage points from the previous academic year). For postgraduate apprentices (all modes of study) qualifying the same year, the progression rate is 97.7 per cent (an increase of 0.5 percentage points from 2019-20).113
For more information on progression rates for years of qualifying 2017-18 to 2020-21, see Figures 7 and 8.
The proportion of students at higher education providers where the relevant progression indicator is below our minimum numerical threshold is 1.0 per cent for the most recent year of qualifying (2020-21), a rise from 0.7 per cent four years before.114
Source: OfS, ‘Student outcomes data dashboard’. Data from all OfS registered providers – taught or registered population.115
Note: Postgraduate apprenticeships (all) progression rates are only available for 2019-20 and 2020-21 years of qualifying.
Figure 7 is a quadruple line graph showing progression rates as a percentage for the years of qualifying 2017-18 to 2020-21 for the following groups of students: undergraduate full-time first degree, all undergraduate apprenticeship, postgraduate full-time taught masters, and all postgraduate apprenticeship. Rates of progression for postgraduate apprenticeship students are only available from 2019-20, so this line is shorter than the others. Rates for all undergraduate apprenticeships have risen somewhat during this time, while those for all the other groups have remained roughly steady.
Figure 8 is a double line graph showing progression rates as a percentage for the years of qualifying 2017-18 to 2020-21 for the following groups of students: undergraduate part-time first degree and postgraduate part-time taught masters. Both have remained roughly similar over time. The progression rates for part-time students are higher than those for their full-time counterparts shown in Figure 7.
Progression rates after higher education for underrepresented groups
Except where otherwise noted, this data is for full-time first degree students (UK-domiciled only) and is for four years in aggregate (qualifiers from 2017-18 to 2020-21).116 It describes actual differences between the disadvantaged group chosen and a reference group. No other factors (for example, entry qualifications) have been taken into account.
See also the OfS’s KPM 6, which measures the completion and employment from entrant data rate over time for full-time undergraduate students at different levels of individual disadvantage. In the most recent year, this rate was 53.6 per cent for ‘significantly disadvantaged’ students, 60.6 per cent for ‘economically precarious’ students, and 68.4 per cent for students from the ‘other’ group.117
Socioeconomic background and students from the most deprived areas
Students from the most deprived areas of England (quintiles 1 and 2 measured by the Index of Multiple Deprivation) and least deprived areas (quintiles 3, 4, and 5) have progression rates of 68.3 per cent and 74.1 per cent respectively.118 Those students who were eligible for free school meals at key stage 4 (or any stage before that) have a progression rate of 65.3 per cent, compared with 71.4 per cent for those not eligible for free school meals.119
Black, Asian and minority ethnic students
Black, Asian and minority ethnic groups have lower progression rates than the white ethnic group (73.0 per cent). The exceptions to this are the following ethnic groups: Asian or Asian British – Indian and Mixed ethnicity – white and Asian. The progression rates for student groups by ethnic background are as follows:
- Asian or Asian British – Bangladeshi – 62.1 per cent
- Asian or Asian British – Chinese – 71.5 per cent
- Asian or Asian British – Indian – 73.9 per cent
- Asian or Asian British – Pakistani – 66.1 per cent
- Asian or Asian British – other – 68.2 per cent
- black or black British – African – 70.5 per cent
- black or black British – Caribbean – 68.0 per cent
- black or black British – other – 67.2 per cent
- mixed – white and Asian – 74.0 per cent
- mixed – white and black African – 70.3 per cent
- mixed – white and black Caribbean – 70.7 per cent
- mixed – other – 71.7 per cent
- other ethnic group – 68.5 per cent
- Gypsy or Traveller 50.0 per cent.120
Mature students
Students under 21 on entry to higher education have a progression rate of 71.5 per cent. Those aged 31 to 40 have the highest progression rate (78.1 per cent), while those aged 51 years and over have the lowest (68.5 per cent). The progression rates for mature students by age group on entry to higher education are as follows:
- 21 to 25 years – 72.3 per cent
- 26 to 30 years – 77.9 per cent
- 31 to 40 years – 78.1 per cent
- 41 to 50 years – 75.3 per cent
- 51 years and over – 68.5 per cent.
Disabled students
Students with no reported disability have a progression rate of 72.5 per cent. Students with reported disabilities have lower progression rates, with the exception of students with reported cognitive or learning difficulties. The progression rates for these students by reported disability are as follows:
- cognitive or learning difficulties – 73.6 per cent
- mental health condition – 67.8 per cent
- multiple or other impairments – 70.1 per cent
- sensory, medical or physical impairments – 71.4 per cent
- social or communication impairment – 61.0 per cent
Care experienced students
Students who have experienced being in care have lower progression rates than those who have not (68.0 per cent and 71.1 per cent respectively).
[57] It should be noted that each time we update our data resources, we may also incorporate approved amendments to the data previously published, and changes to a provider’s registration status with the OfS. This can result in the data in our latest publications differing from previously published numbers.
[58] OfS, ‘Regulatory notice 1: Access and participation plan guidance’ (OfS 2023.67), 2023, p6.
[59] Higher education full-time equivalent data split by level for higher education providers that returned Student, Student Alternative or Individualised Learner Record data in line with requirements for OfS registered providers in 2021-22. OfS, ‘Student number data’, last updated November 2023.
[60] OfS, ‘The OfS Register’; see OfS, ‘Regulatory advice 5: Exempt charities’ (OfS 2018.23), May 2018.
[61] OfS, ‘TEF 2023 ratings dashboard’, last updated December 2023.
[62] OfS, ‘Financial sustainability of higher education providers in England 2023 update’ (OfS 2023.20), 2023. Audited financial data from 2019-20 and 2020-21 and forecasts to 2024-25.
[63] OfS, ‘Financial sustainability of higher education providers in England 2023 update’ (OfS 2023.20), 2023, pp13-14.
[64] OfS, ‘Financial sustainability of higher education providers in England 2023 update’ (OfS 2023.20), 2023, p15.
[65] OfS, ‘Financial sustainability of higher education providers in England 2023 update’ (OfS 2023.20), 2023, p20.
[66] Data on the profile of students entering higher education is taken from OfS, ‘Size and shape of provision data dashboard’, last updated June 2023. Data is from all OfS registered providers.
[67] OfS, ‘Key performance measure 5: Access to higher education’, last updated March 2023.
[68] Data on the profile of students entering higher education is taken from OfS, ‘Size and shape of provision data dashboard’, last updated June 2023. Data is from all OfS registered providers.
[69] OfS, ‘Student characteristics data: Population data’, last updated July 2023.
[70] OfS, ‘Size and shape of provision data dashboard', last updated June 2023.
[71] OfS, ‘Size and shape of provision data dashboard’, last updated June 2023.
[72] OfS, ‘Size and shape of provision data dashboard’, last updated June 2023.
[73] For more information and for proportions that include data where student characteristics are unknown or not applicable, see OfS, ‘Size and shape of provision data dashboard’, last updated June 2023.
[74] Index of Multiple Deprivation data for UK-domiciled students only who have a home postcode in the same country as their provider.
[75] Data is for UK-domiciled students only and only from providers that submit data to the HESA student record. The collection of the National Statistics Socio-economic Classification data differs depending on the student’s entry age. For students aged 21 and over at entry, it is based on their occupation prior to starting their course. For students under 21, it is based on the occupation of their parent, stepparent or guardian who earns the most.
[76] Data is for students under 21 years at age of entry who attended English schools, using information from the National Pupil Database for England.
[77] Tracking underrepresentation by area (TUNDRA) is an area-based measure of young participation in higher education at age 18 or 19 for state-funded mainstream school students in England. It classifies local areas across England using middle super output area and lower super output area according to this young participation rate.
[78] OfS, ‘Student characteristics data: Population data’, last updated July 2023. Data is for UK-domiciled students only.
[79] Data is for all domiciles.
[80] Data is for all domiciles.
[81] OfS, ‘Key performance measure 4: Students’ views on aspects of quality’, last updated October 2023. For more detail of how positive responses are measured, see ‘How do you calculate theme measures?’ under ‘Understanding the NSS data’ at OfS, ‘Changes in NSS 2023’.
[82] For full findings, see OfS, ‘National Student Survey’.
[83] Data on continuation rates is for all domiciles and is taken from OfS, ‘Student outcomes data dashboard’, last updated July 2023.
[84] The data for male and female students is for full-time first degree students (all domiciles) and for four years in aggregate (entrants from 2017-18 to 2020-21).
[85] OfS, ‘Key performance measure 1: Extent of poor student outcomes’, last updated August 2023.
[86] OfS, ‘Student outcomes data dashboard’, last updated July 2023.
[87] A four-year aggregate has been derived using rounded data from OfS, ‘Student characteristics data: Outcomes data’, last updated July 2023.
[88] Data is for England-domiciled students only and is taken from OfS, ‘Student outcomes data dashboard’, last updated July 2023.
[89] Data is for students under 21 years at age of entry who attended English schools, using information from the National Pupil Database for England and is derived using rounded data from OfS, ‘Student outcomes data dashboard’, last updated July 2023.
[90] Data is for UK-domiciled students only.
[91] Data is for UK-domiciled students only.
[92] The data for male and female students is for full-time first degree students (all domiciles) and for four years in aggregate (entrants from 2014-15 to 2017-18).
[93] Data on completion rates is for all domiciles and is taken from OfS, ‘Student outcomes data dashboard, last updated July 2023.
[94] OfS, ‘Key performance measure 1: Extent of poor student outcomes’, last updated August 2023.
[95] OfS, ‘Student outcomes data dashboard’, last updated July 2023.
[96] A four-year aggregate has been derived using rounded data from OfS, ‘Student characteristics data: Outcomes data’, last updated July 2023.
[97] Data is for England-domiciled students only and is taken from OfS, ‘Student outcomes data dashboard', last updated July 2023.
[98] Data is for students under 21 years at age of entry who attended English schools, using information from the National Pupil Database for England and is taken from OfS, ‘Student outcomes data dashboard’, last updated July 2023.
[99] Data is for UK-domiciled students only.
[100] Data is for UK-domiciled students only.
[101] The Access and participation data covers UK-domiciled undergraduate entrants registered at English higher education providers, while the Student outcomes data dashboard has a broader coverage and includes all students registered or taught at English higher education providers. However, each of the student outcomes and experience measures has a specific definition of which students are included and the coverage of some characteristics is also restricted. For more information see OfS, ‘Student outcome and experience measures: Documentation’.
[102] Data on overall attainment rates is for all domiciles and is taken from OfS, ‘Access and participation data dashboard’, last updated July 2023.
[103] See HESA, ‘Higher Education Student Statistics: UK, 2020/21 - Qualifications achieved’, published January 2022.
[104] The data for male and female students is for full-time first degree students (all domiciles) and for four years in aggregate (qualifiers from 2018-19 to 2021-22) and is taken from OfS, ‘Access and participation data dashboard’, last updated July 2023.
[105] OfS, ‘Access and participation data dashboard’, last updated July 2023.
[106] A four-year aggregate has been derived using rounded data from OfS, ‘Student characteristics data: Outcomes data’’, last updated July 2023. This is a different data source to that used for the overall attainment figures.
[107] OfS, ‘Key performance measure 7: Degree attainment by ethnicity, last updated March 2023.
[108] Undergraduate students aged under 21 years on entry who were found in the National Pupil Database key stage 4 data in 2009-10 or later.
[109] Data is for UK-domiciled students only. The rate for Gypsy and Traveller students is based on much smaller numbers compared with other ethnic groups.
[110] Data is for UK-domiciled students only.
[111] See Graduate Outcomes survey.
[112] The data for male and female students is for full-time first degree students (UK-domiciled only) and for four years in aggregate (qualifiers from 2017-18 to 2020-21).
[113] Data on progression rates is for UK students only and is taken from OfS, ‘Student outcomes data dashboard’, last updated July 2023.
[114] OfS, ‘Key performance measure 1: Extent of poor student outcomes’, last updated August 2023.
[115] OfS, ‘Student outcomes data dashboard’, last updated July 2023. (For UK students only.)
[116] A four-year aggregate has been derived using rounded data from OfS, ‘Student characteristics data: Outcomes data’, last updated July 2023.
[117] OfS, ‘Key performance measure 6: Success and progression’, published March 2023. The latest year of data combines completion rates for entrants in 2017-18 with progression rates for qualifiers in 2019-20.
[118] Data is for students domiciled in England only and is taken from OfS, ‘Student outcomes data dashboard’, last updated July 2023.
[119] Data is for students under 21 years at age of entry who attended English schools, using information from the National Pupil Database for England and is taken from OfS, ‘Student outcomes data dashboard’, last updated July 2023.
[120] Data for Gypsy and Traveller students is based on two years of data and very small numbers.
Describe your experience of using this website