The Office for Students annual review 2022
Published 15 December 2022
A statistical overview of higher education in England
Introduction
At a time of global political, social and economic change, and with the implications for higher education of the pandemic still playing out, the need for well evidenced analysis to inform policy and practice is more important than ever. This section offers a statistical overview of key trends and developments in English higher education, using the latest available data. It draws together key findings from a range of OfS reports and data dashboards. It is not a comprehensive overview – the endnotes include information where fuller statistical information is available on the OfS website.
This section focuses on some key statistics relating to higher education in England:
- Higher education providers: The number of providers, diversity of provision and financial sustainability.
- Students in higher education: Entrants to higher education and their experiences of their courses.
- Student outcomes: Continuation, completion and progression rates.
We have included, where this data is available, information on underrepresented groups of students. The OfS considers these to include, among others: students from deprived areas, areas of lower higher education participation, or both; some black, Asian and minority ethnic students; mature students; and disabled students (whether or not they receive a Disabled Students Allowance).51
Higher education providers
Registration
There were 2.4 million students studying in the UK at higher education providers registered with the OfS in 2020-21.52 On 5 December 2022, there were 409 registered providers, 67 of them in the ‘Approved’ category and 342 in the ‘Approved (fee cap)’ category, which allows them to access certain funding and charge fees up to the higher statutory fee limit.53 They include a variety of organisations, and in 2022 we developed a new methodology for grouping higher education providers to help our presentation of sector data.54
The OfS Register includes details such as whether a higher education provider has the power to award degrees and at what level, its charitable status and whether it has the right to use ‘university’ in its title.55 On 5 December 2022, there were 160 providers with degree awarding powers (just under 40 per cent of all registered providers). 105 providers (about a quarter) can award research degrees. 124 providers are universities (just under a third of all). 70 are registered as a charity and 268 are exempt charities (which means that they are not registered with the Charity Commission and the OfS is their principal regulator).56
Financial sustainability
We analysed financial data returned by registered higher education providers in England (excluding further education colleges).57 The analysis (published in June 2022) concluded that the overall aggregate financial position of universities, colleges and other registered higher education providers remains sound. However, there is significant variation between providers in terms of financial performance and strength. Overall, they reported a moderate increase in total income of 3.2 per cent in 2020-21, compared with 2019-20. On average, sector income is forecast to be 21.7 per cent higher in 2024-25 than in 2019-20 (see Table 1). Table 2 shows the actual and expected sources of income for providers.
The current and continuing sound financial position reported by the higher education sector is significantly underpinned by providers’ assumptions about fee income from overseas students. Overseas (non-EU) student numbers are forecast by providers to increase by 40.2 per cent from 2020-21 to 2021-22. EU student numbers are expected by providers to decline by 37.3 per cent in the same time period (see Figure 1). This is most likely a consequence of increases in their tuition fees and inability to access student finance since the UK’s exit from the EU. However, the increased tuition fees that EU students will pay will partly mitigate any negative financial impact for providers stemming from these decreased numbers.
Table 1: Peer group analysis of changes in income, 2020-21 to 2024-25
| Total income (year on year change) | ||||||
|---|---|---|---|---|---|---|
| Peer group | 2020-21 (actual) | 2021-22 (forecast) | 2022-23 (forecast) | 2023-24 (forecast) | 2024-25 (forecast) | Change 2020-21 to 2024-25 |
|
Non-specialist: high average tariff |
1.5% |
8.4% |
3.4% |
4.5% |
3.3% |
21.1% |
|
Non-specialist: medium average tariff |
4.3% |
4.9% |
4.3% |
4.4% |
4.7% |
19.5% |
|
Non-specialist: low average tariff |
7.0% |
4.1% |
6.2% |
5.9% |
5.4% |
23.2% |
|
Non-specialist: unclassified |
-22.8% |
26.8% |
15.3% |
15.5% |
14.9% |
94.2% |
|
Specialist |
6.4% |
6.7% |
6.1% |
5.8% |
5.6% |
26.6% |
|
Sector |
3.2% |
6.8% |
4.3% |
4.8% |
4.2% |
21.7% |
Source: OfS, ‘Financial sustainability of higher education providers in England 2022 update’ (OfS 2022.32), June 2022, page 8.58
Note: The ‘Non-specialist: unclassified’ group consists of 30 financially small providers, where relatively low year-to-year changes can appear as large percentage movements. 2020-21 numbers are actual; numbers from 2021-22 onwards are forecast.
Table 2: Sources of income, 2019-20 to 2024-25
| Income £M | ||||||
|---|---|---|---|---|---|---|
| Source | 2019-20 (actual) | 2020-21 (actual) | 2021-22 (forecast) | 2022-23 (forecast) | 2023-24 (forecast) | 2024-25 (forecast) |
|
Income – Course fees and education contracts |
19,394 |
20,811 |
22,449 |
23,771 |
25,117 |
26,425 |
|
Income – Funding body grants |
3,905 |
4,099 |
3,887 |
3,743 |
3,755 |
3,749 |
|
Income – Research grants and contracts |
5,188 |
5,364 |
5,692 |
5,835 |
6,103 |
6,371 |
|
Income – Other income |
6,482 |
5,960 |
6,967 |
7,434 |
7,853 |
8,138 |
|
Income – Investment income |
324 |
287 |
270 |
289 |
304 |
314 |
|
Income – Donations and endowments |
851 |
784 |
713 |
696 |
704 |
733 |
|
Sector |
36,145 |
37,306 |
39,979 |
41,768 |
43,837 |
45,729 |
Source: OfS, ‘Financial sustainability of higher education providers in England 2022 update’ (OfS 2022.32), June 2022, page 9.59
Figure 1: Student numbers and annual growth for total entrants by domicile
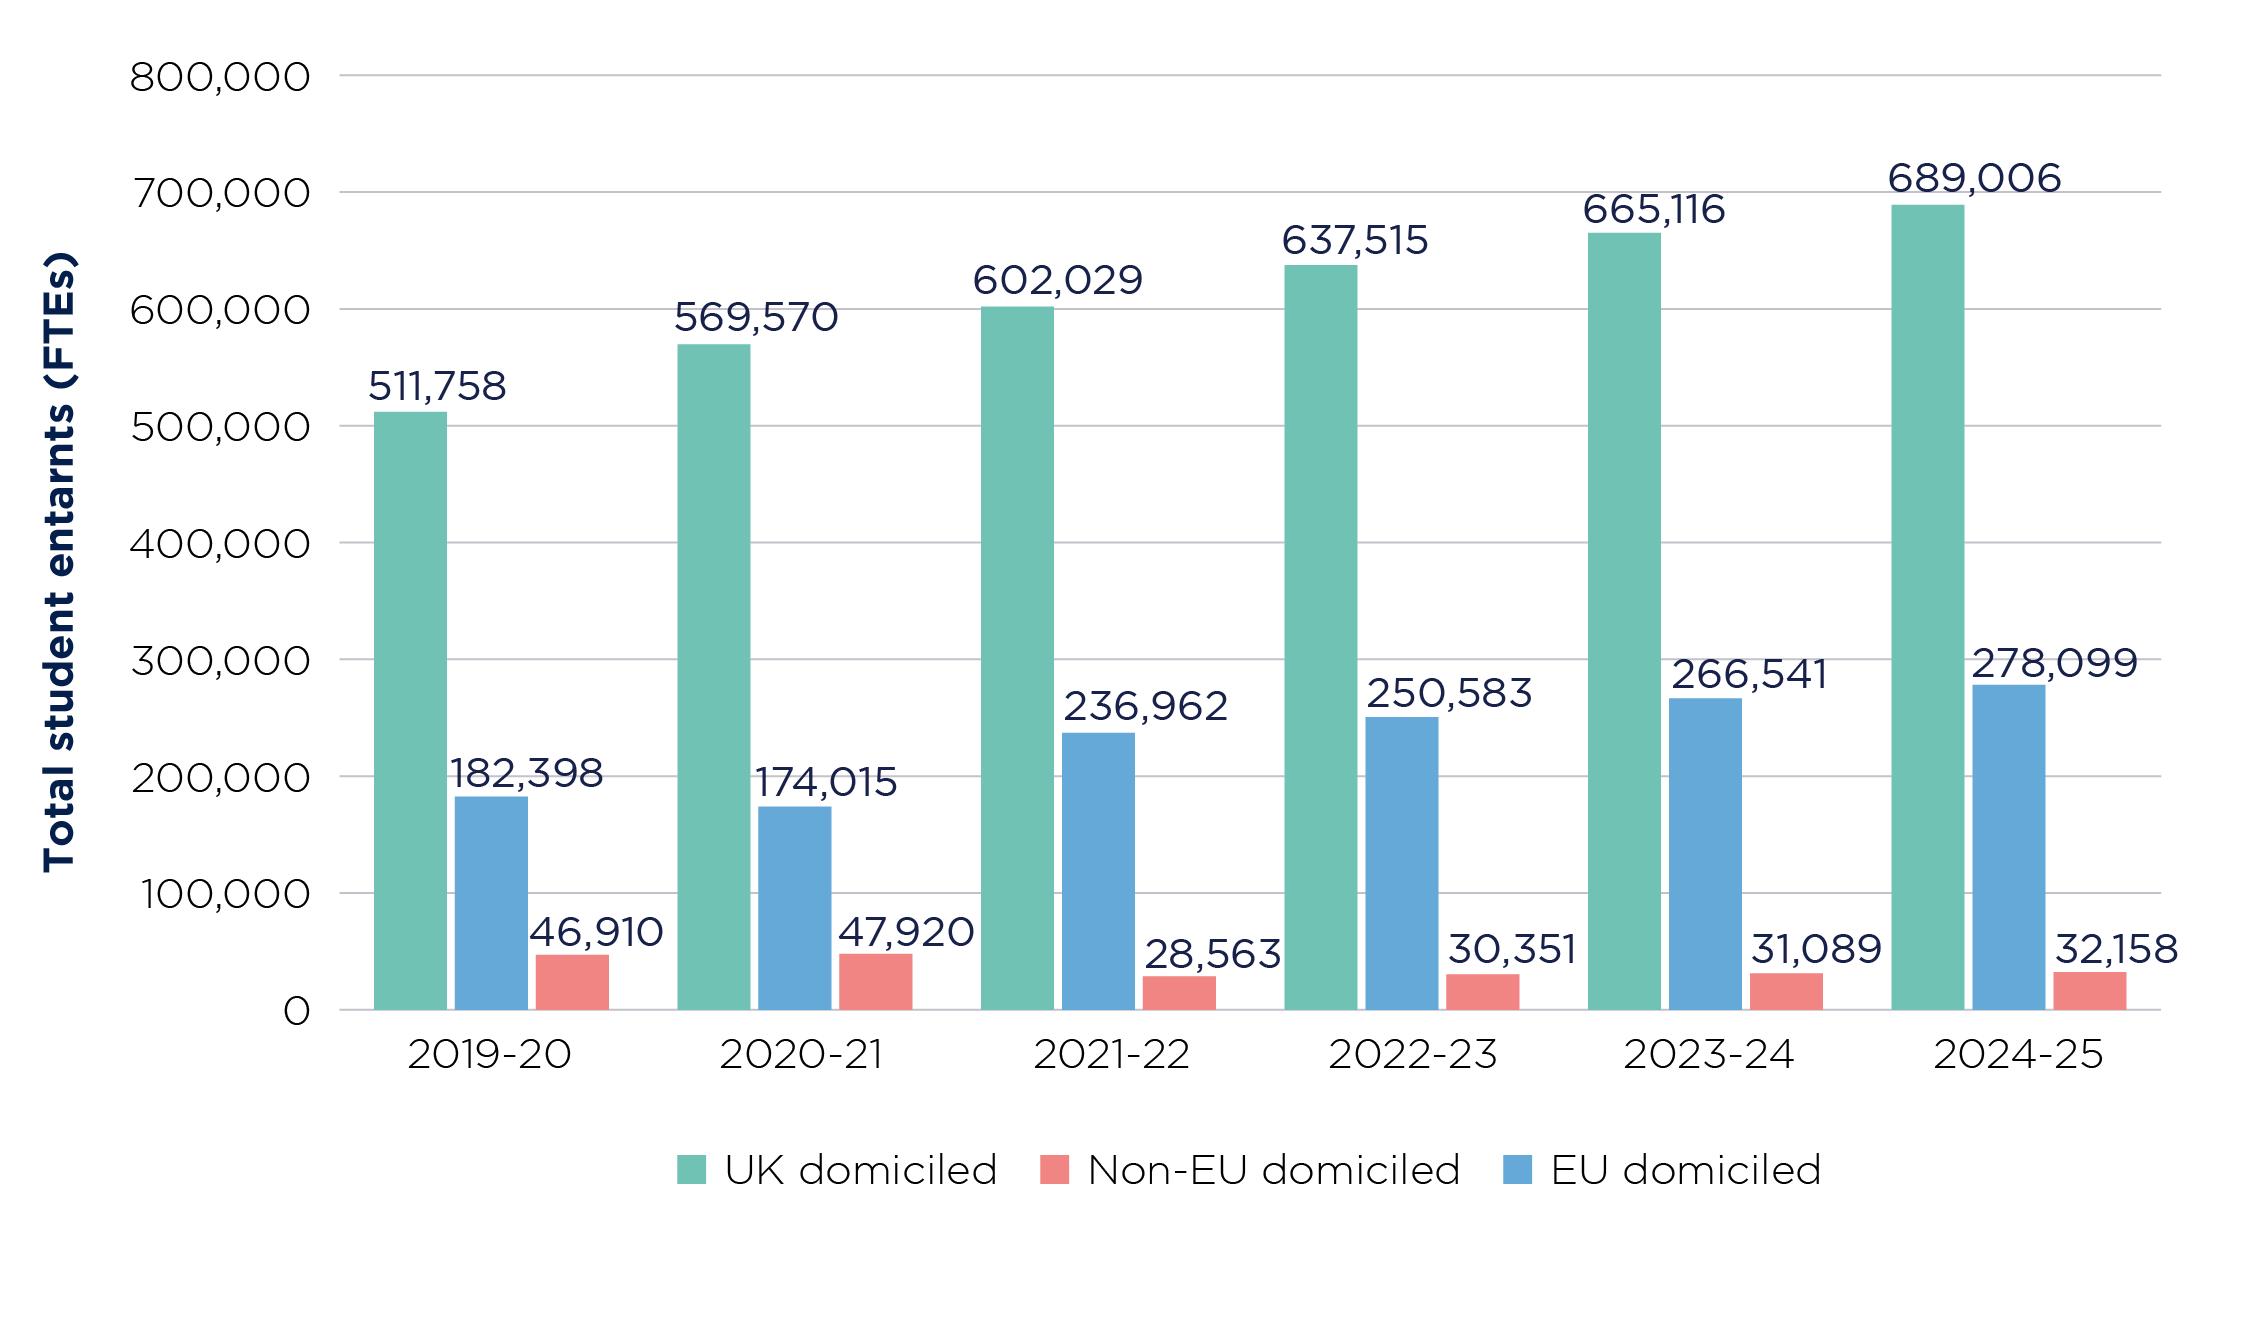
Source: OfS, ‘Financial sustainability of higher education providers in England 2022 update’ (OfS 2022.32), June 2022, page 11.60
Note: ‘FTE’ = ‘full-time equivalent’. 2019-20 and 2020-21 numbers are actual; numbers from 2021-22 onwards are forecast.
Figure 1 is a triple bar chart showing student numbers for the years 2019-20 to 2020-21 (actual) and 2021-22 to 2024-25 (forecast), for UK-domiciled, EU-domiciled and non-EU domiciled students. In every year, there are significantly more UK students than non-EU-domiciled students, of whom there are in turn significantly more than EU-domiciled students. The total number of students has grown; however, the chart shows an overall decrease in EU-domiciled students of over the period, while the other groups have grown in size.
Reportable events and notifications
Registered higher education providers are required to report to the OfS certain events or matters that could negatively impact their ability to meet ongoing registration requirements. These are called ‘reportable events’ and are defined in the OfS’s regulatory framework.61 The OfS received reports of 197 such events in the first and second quarters of 2022, and resolved 172 reportable events in this period.62
Higher education providers registered with the OfS must meet the ongoing conditions of registration. If students, staff or members of the public believe that a registered provider is not meeting these requirements, they can send us a notification.63 123 notifications were received and 120 were resolved in the third and fourth quarters of 2021. 103 notifications were received in the first and second quarters of 2022 and 85 were resolved in the same period.64
Students in higher education
Profile of students entering higher education
552,860 full-time students, 89,780 part-time students and 21,290 apprentices entered undergraduate education in 2020-21.65 Table 3 shows how the number of entrants has changed since 2017-18; for instance, full-time numbers have increased each year. There were noticeable increases in both full-time and part-time student numbers between 2019-20 and 2020-21. For the latter, this increase reversed a decline in numbers in recent years.
Postgraduate student entrant numbers have followed a similar pattern, with increases for full-time students since 2017-18. 287,300 full-time students, 92,560 part-time students and 7,900 apprenticeship students entered postgraduate education in 2020-21. Part-time student numbers declined between 2017-18 and 2019-20. As with undergraduate students, there were notable increases for both full- and part-time postgraduate entrants between 2019-2020 and 2020-21. Students domiciled outside of the UK comprised 18.4 per cent of full-time undergraduate entrants and 55.3 per cent of full-time postgraduate entrants in 2020-21 (see Tables 3 and 4).
The OfS’s Key performance measure 5 shows that, in 2020-21, approximately 282,400 young, full-time students domiciled in England entered undergraduate higher education here, the highest total in the past four years. This included around 51,200 students categorised as ‘significantly disadvantaged’, the highest number in the past four years.66
Female students made up the majority of full-time undergraduate and postgraduate entrants in 2020-21 (56.0 and 56.7 per cent respectively; see Table 5). However, these aggregate figures obscure stark differences in the proportions of male and female students in certain course subjects. For example, in 2020-21, 82.9 per cent of undergraduate entrants and 71.5 per cent of postgraduate entrants for engineering, technology and computing were male. Female students made up 86.2 per cent of undergraduate entrants and 71.3 per cent of postgraduate entrants for education and teaching in the same year.67
Table 3: Number of undergraduate entrants by domicile from 2017-18 to 2020-21
| Academic year | Domicile | Full-time undergraduate | Part-time undergraduate | Apprenticeship undergraduate |
|---|---|---|---|---|
|
2017-18 |
UK |
412,120 |
78,330 |
13,130 |
|
|
EU |
26,270 |
490 |
10 |
|
|
Other international |
56,000 |
600 |
10 |
|
|
Unknown |
0 |
0 |
20 |
|
|
All domiciles |
494,380 |
79,410 |
13,170 |
|
2018-19 |
UK |
410,790 |
76,470 |
18,780 |
|
|
EU |
28,750 |
470 |
30 |
|
|
Other international |
60,390 |
540 |
30 |
|
|
Unknown |
0 |
0 |
10 |
|
|
All domiciles |
499,920 |
77,480 |
18,850 |
|
2019-20 |
UK |
423,750 |
75,030 |
19,550 |
|
|
EU |
29,980 |
360 |
30 |
|
|
Other international |
72,880 |
650 |
20 |
|
|
Unknown |
10 |
10 |
0 |
|
|
All domiciles |
52,610 |
76,0480 |
19,610 |
|
2020-21 |
UK |
451,170 |
86,930 |
21,240 |
|
|
EU |
32,100 |
500 |
30 |
|
|
Other international |
69,560 |
2,360 |
20 |
|
|
Unknown |
40 |
0 |
0 |
|
|
All domiciles |
552,860 |
89,780 |
21,290 |
Source: OfS, ‘Size and shape of provision data dashboard’. Data from all OfS registered providers.68
Note: For each category, student numbers have been rounded to the nearest ten, and totals were calculated using unrounded numbers and then rounded. This means that totals may not match the sum of the categories.
Table 4: Number of postgraduate entrants by domicile from 2017-18 to 2020-21
| Academic year | Domicile | Full-time postgraduate | Part-time postgraduate | Apprenticeship postgraduate |
|---|---|---|---|---|
|
2017-18 |
UK |
102,670 |
76,420 |
540 |
|
|
EU |
19,780 |
2,690 |
0 |
|
|
Other international |
96,550 |
3,400 |
0 |
|
|
Unknown |
0 |
0 |
0 |
|
|
All domiciles |
219,010 |
82,520 |
540 |
|
2018-19 |
UK |
102,710 |
74,530 |
3,660 |
|
|
EU |
19,040 |
2,580 |
20 |
|
|
Other international |
107,240 |
3,670 |
20 |
|
|
Unknown |
0 |
10 |
0 |
|
|
All domiciles |
228,990 |
80,780 |
3,700 |
|
2019-20 |
UK |
104,090 |
72,600 |
5,180 |
|
|
EU |
18,780 |
2,400 |
20 |
|
|
Other international |
134,120 |
3,690 |
50 |
|
|
Unknown |
0 |
0 |
0 |
|
All domiciles |
256,980 |
78,680 |
5,250 |
|
|
2020-21 |
UK |
128,270 |
85,280 |
7,840 |
|
|
EU |
18,730 |
2,710 |
20 |
|
|
Other international |
140,290 |
4,560 |
40 |
|
|
Unknown |
10 |
10 |
0 |
|
|
All domiciles |
287,300 |
92,560 |
7,900 |
Source: OfS, ‘Size and shape of provision data dashboard’. Data from all OfS registered providers.69
Note: For each category, student numbers have been rounded to the nearest ten and totals were calculated using unrounded numbers and then rounded. This means that totals may not match the sum of the categories.
Table 5: Sex of full-time entrants to higher education
| Proportion of full-time undergraduate entrants | Proportion of full-time postgraduate entrants | |||||
|---|---|---|---|---|---|---|
| Academic year | Female | Male | Other sex | Female | Male | Other sex |
|
2017-18 |
55.6% |
44.4% |
0.1% |
58.5% |
41.3% |
0.2% |
|
2018-19 |
55.9% |
43.9% |
0.1% |
58.7% |
41.2% |
0.2% |
|
2019-20 |
55.7% |
44.3% |
0.1% |
57.6% |
42.2% |
0.2% |
|
2020-21 |
56.0% |
43.9% |
0.1% |
56.7% |
43.1% |
0.2% |
Source: OfS, ‘Size and shape of provision data dashboard’. Data from all OfS registered providers.70
Entrants to higher education from underrepresented groups in 2020-21
Data is for full-time undergraduate entrants at OfS registered providers (unless otherwise noted). Where the student characteristic is unknown or not applicable the students are excluded from the calculation of proportions.71
Socioeconomic background and students from the most deprived areas
22.1 per cent of undergraduate entrants came from the most deprived areas (Quintile 1) and 19.7 per cent came from the least deprived areas in England in 2020-21 (Quintile 5).72
49.2 per cent of full-time undergraduate entrants had parents working in higher managerial, administrative and professional occupations, 28.0 per cent had parents working in routine and manual occupations, and 0.6 per cent had parents who had never worked or were long-term unemployed in 2020-21.73
19.5 per cent of full-time undergraduate entrants were eligible for free school meals at Key Stage 4 or during the prior six years.74
Students from areas of low higher education participation
13.4 per cent of England-domiciled undergraduate entrants came from areas of England with the lowest rates of participation in higher education (Quintile 1).
Black, Asian and minority ethnic students
14.8 per cent of undergraduate entrants in 2020-21 were from an Asian background, 10.3 per cent were black, 5.2 per cent were from a mixed ethnic background, and 2.6 per cent were from other minority ethnic groups. (Data is for UK-domiciled entrants only.)
Mature students
Most of the students entering full-time undergraduate courses are under the age of 21 on entry (70.3 per cent of entrants in 2020-21). In contrast, most of the students entering part-time undergraduate courses are mature students, aged 21 or over (84.7 per cent). (Data is for all domiciles.)
Disabled students
14.9 per cent of full-time undergraduate entrants reported having a disability in 2020-21. The proportions of entrants reporting different types of disability are:
- cognitive or learning difficulties: 5.1 per cent
- mental health conditions: 4.3 per cent
- multiple or other impairments: 2.5 per cent
- sensory, medical or physical impairments: 2.1 per cent
- social or communication impairments: 0.9 per cent.
(Data is for all domiciles.)
National Student Survey findings
The NSS is a survey of final-year undergraduates and provides important information on UK higher education students’ opinions on their courses. The response rate in England in 2022 was 68.2 per cent, with 276,344 students taking part in the survey.
In the year when face-to-face teaching resumed for most courses after pandemic-related restrictions were lifted, the 2022 survey results for England show an increase in students reporting positively about access to learning resources. 81 per cent gave positive responses about this in 2022, compared with 73 per cent in 2021. (This data is used for the OfS’s Key performance measure 4, ‘Students’ views on aspects of quality’.75 However, the proportion of positive responses about the quality of their teaching was unchanged from 2021, and a decrease from 84 per cent in 2020. More findings from the survey are included in the box below.
Some findings from the NSS 2022 (English higher education providers)
- 80 per cent of students gave positive responses about the quality of their teaching (unchanged from 2021).
- 81 per cent (compared with 73 per cent in 2021) agreed that IT resources and facilities supported their learning well.
- 69 per cent gave positive responses on feedback and assessment (the same proportion as in 2021).
- 84 per cent agreed that staff explained things well, representing no change from last year.
- 65 per cent (compared with 64 per cent in 2021) agreed their course was well organised and running smoothly.
- 71 per cent (70 per cent in 2021) agreed that changes in the course were communicated effectively.76
Student outcomes
Continuation
Continuation rates have remained fairly constant for full-time undergraduate students in higher education over the last five years, while rising slightly for their part-time counterparts. Continuation rates are calculated by looking at the proportion of students who continue to study for a higher education qualification (or who have gained one), one year and 15 days after they started their course for full-time students and two years and 15 days for part-time students.
The continuation rate for undergraduate students entering full-time first degrees in 2019-20 is 91.1 per cent. Female full-time undergraduate first degree students have a slightly higher continuation rate than their male equivalents (92.5 per cent and 89.4 per cent respectively).77 For postgraduate students studying a full-time taught masters’, the rate is 93.8 per cent. These rates have remained roughly the same for the past four years.
Students studying part-time have lower continuation rates. For part-time undergraduate students entering first degrees in 2019-20 it is 61.8 per cent, an increase of 3.7 percentage points since 2016-17. Postgraduate students studying a part-time taught masters’ (having started in 2019-20) have a continuation rate of 74.8 per cent – the same as the previous year but a very slight decrease from 2017-18 (see Figure 2).78
The OfS’s Key performance measure 1 looks at the extent of poor student outcomes. The proportion of students at providers where the relevant continuation indicator is below our numerical threshold is 5.2 per cent for the most recent year. This decreased from 7.9 per cent over the previous three years.79
Figure 2: Continuation rates in higher education
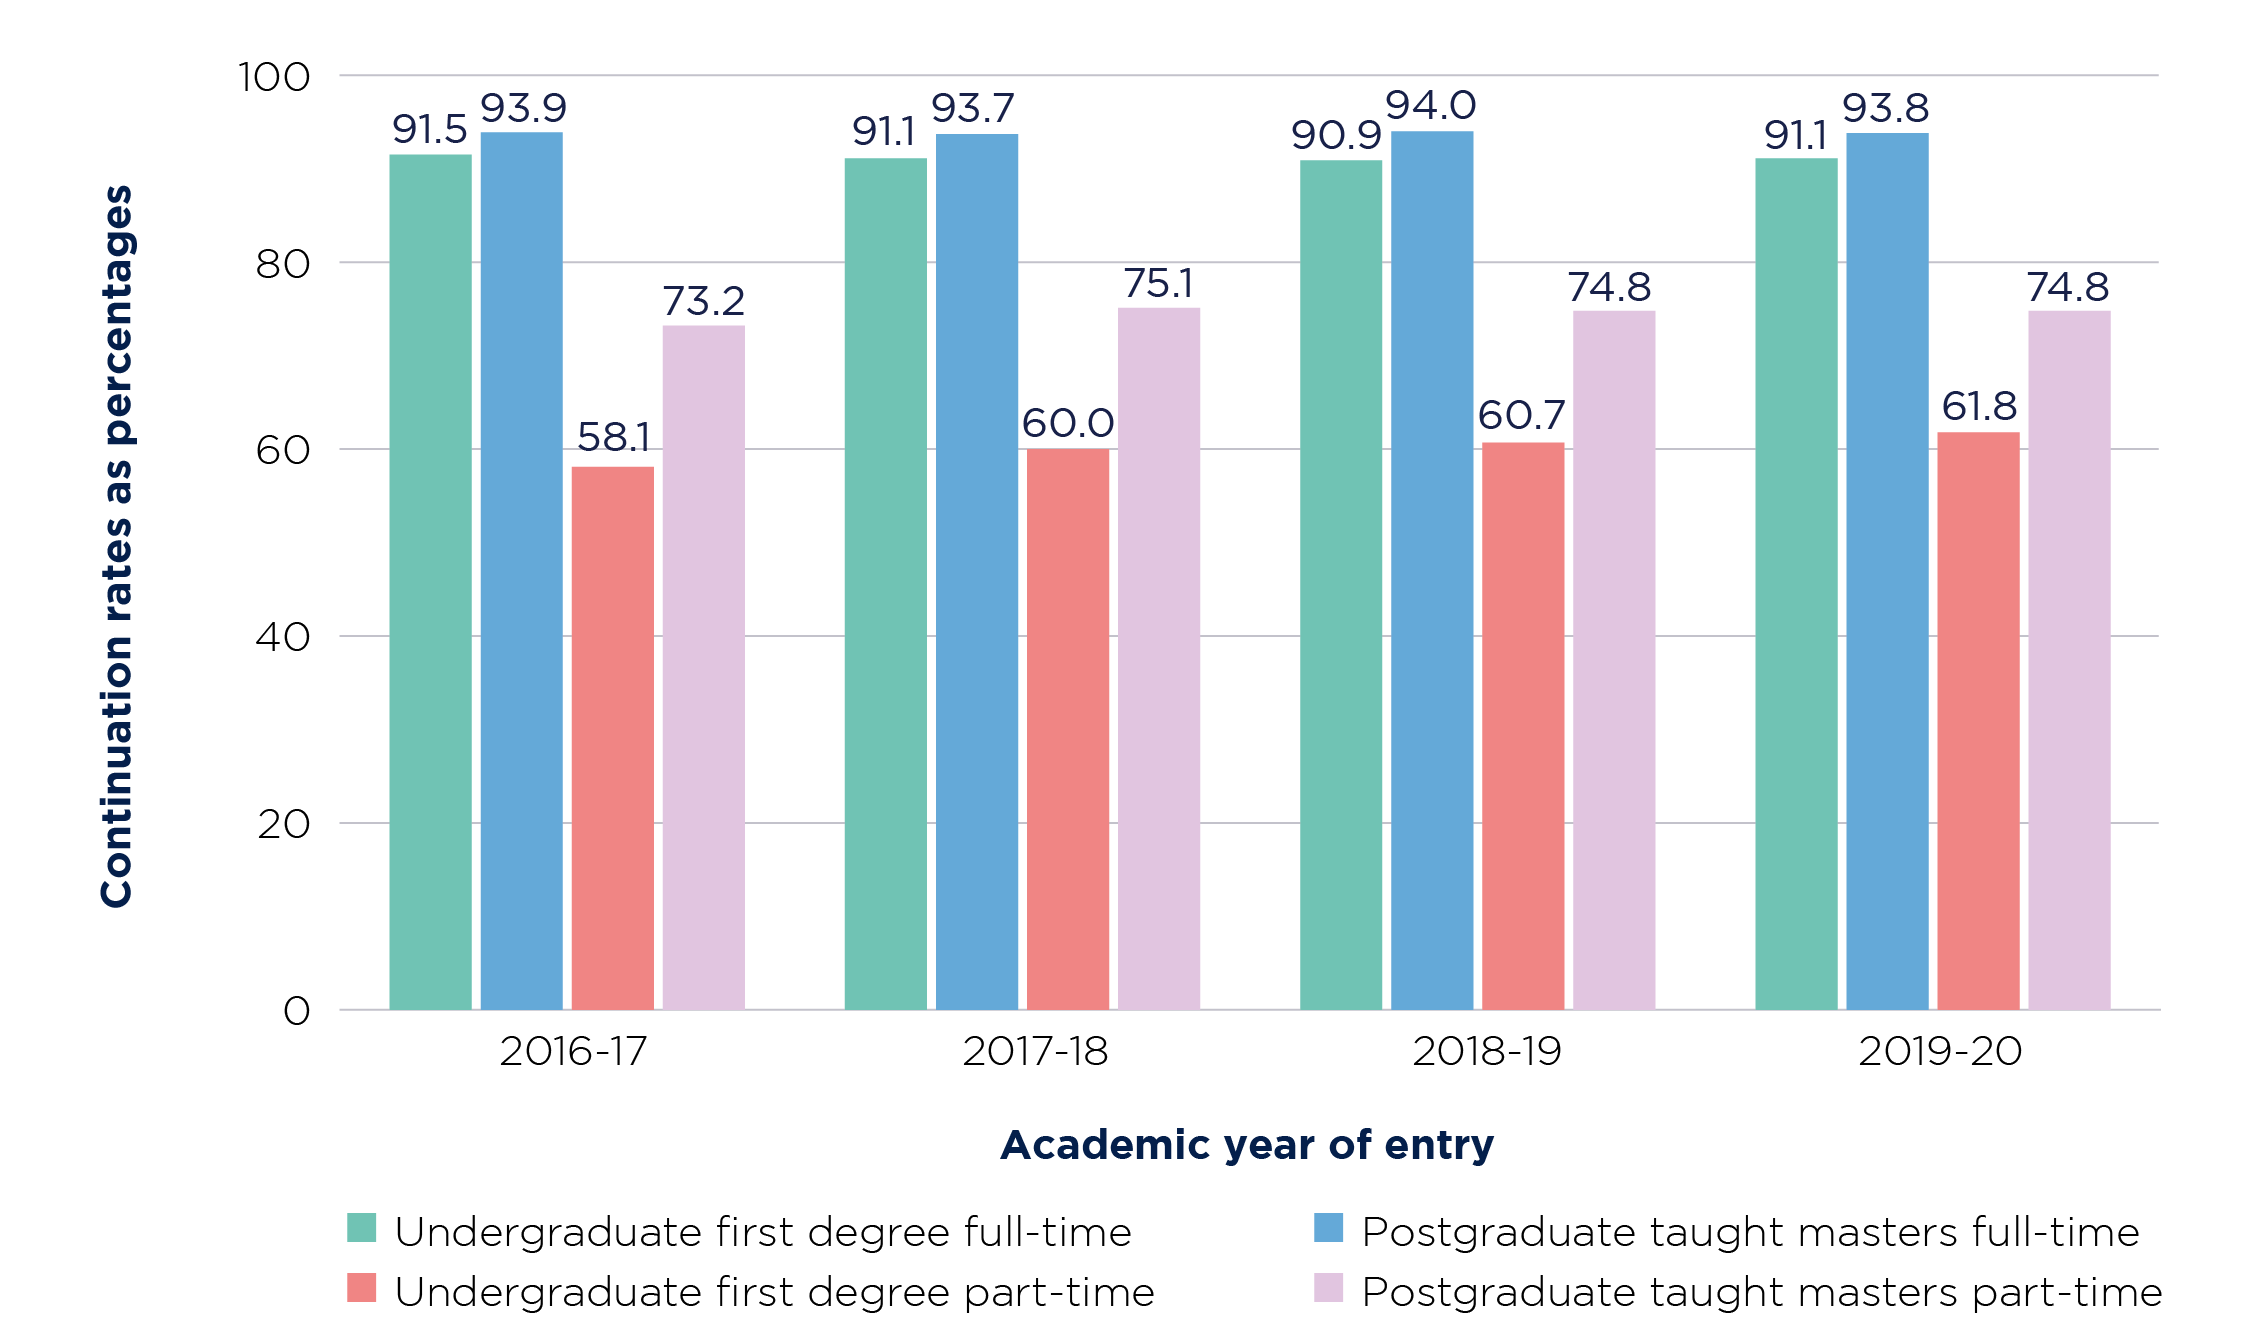
Source: OfS, ‘Student outcomes data dashboard’. Data from all OfS registered providers.80
Figure 2 is a quadruple bar chart showing continuation rates as a percentage in the years 2016-17 to 2019-20 for the following groups of students: undergraduate first degree full-time, postgraduate taught masters full-time, undergraduate first degree part-time, and postgraduate taught masters part-time. For both undergraduates and postgraduates, the rates for full-time students have remained roughly constant over time, while those for part-time students have risen slightly. However, the increase for postgraduate masters full-time students occurs entirely in 2017-18, with the number falling slightly in 2018-19 and remaining steady in 2019-20.
Continuation rates for underrepresented groups
Except where otherwise noted, this data is for full-time undergraduate first degree students (all domiciles) and is for four years in aggregate (entrants from 2016-17 to 2019-20). It describes actual differences between the underrepresented group chosen and a reference group. No other factors (for example, entry qualifications) have been taken into account.81
Socioeconomic background and students from the most deprived areas
Students from the most deprived areas of England (quintiles 1 and 2 measured by the Index of Multiple Deprivation) and least deprived areas (quintiles 3, 4, and 5) have continuation rates of 88.2 per cent and 92.8 per cent respectively.82 Those students who were eligible for free school meals at Key Stage 4 (or any stage before that) have a continuation rate of 88.6 per cent, compared with 93.3 per cent for those not eligible for free school meals.83
Black, Asian and minority ethnic students
Students from black and minority ethnic groups have lower continuation rates than that for students from a white ethnic group (91.8 per cent).
- Asian or Asian British: 91.1 per cent
- black or black British: 86.9 per cent
- mixed ethnic group: 89.9 per cent
- other ethnic groups: 88.3 per cent.84
Mature students
Students whose ages on entry to higher education were 21 to 30 years and 31 years and over have continuation rates of 86.4 per cent and 85.4 per cent respectively. This compares with the continuation rate of 92.6 per cent for students under 21 years.
Disabled students
Students with no reported disability have a continuation rate of 91.3 per cent. Continuation rates are slightly lower for students with one or more reported disabilities (90.2 per cent).
Completion
Completion rates measure the proportion of students who have gained a higher education qualification (or were continuing in the study of a qualification) four years and 15 days after they started their course (six years and 15 days for part-time students).
Similarly to the pattern seen in continuation rates, completion rates are higher for full-time students (compared with the rates for part-time students). The completion rate for undergraduate students entering full-time first degrees in 2016-17 (first degree, full-time) is 89.2 per cent (roughly the same as for the previous four years). For their part-time counterparts it is 47.6 per cent (an increase of two percentage points from the previous year). Female full-time undergraduate first degree students have a higher completion rate than their male equivalents (91.5 per cent and 86.6 per cent respectively).85
For postgraduate students starting a full-time taught masters’ (full-time) in 2016-17, the completion rate is 94.6 per cent. For part-time students in the same mode of study, it is 77.5 per cent. These rates have remained roughly the same for the previous four years (see Figure 3).86
The proportion of students at providers where the relevant completion indicator is below our numerical threshold is 6.7 per cent for the most recent year. This decreased from 9.4 per cent over the previous three years.87
Figure 3: Completion rates in higher education
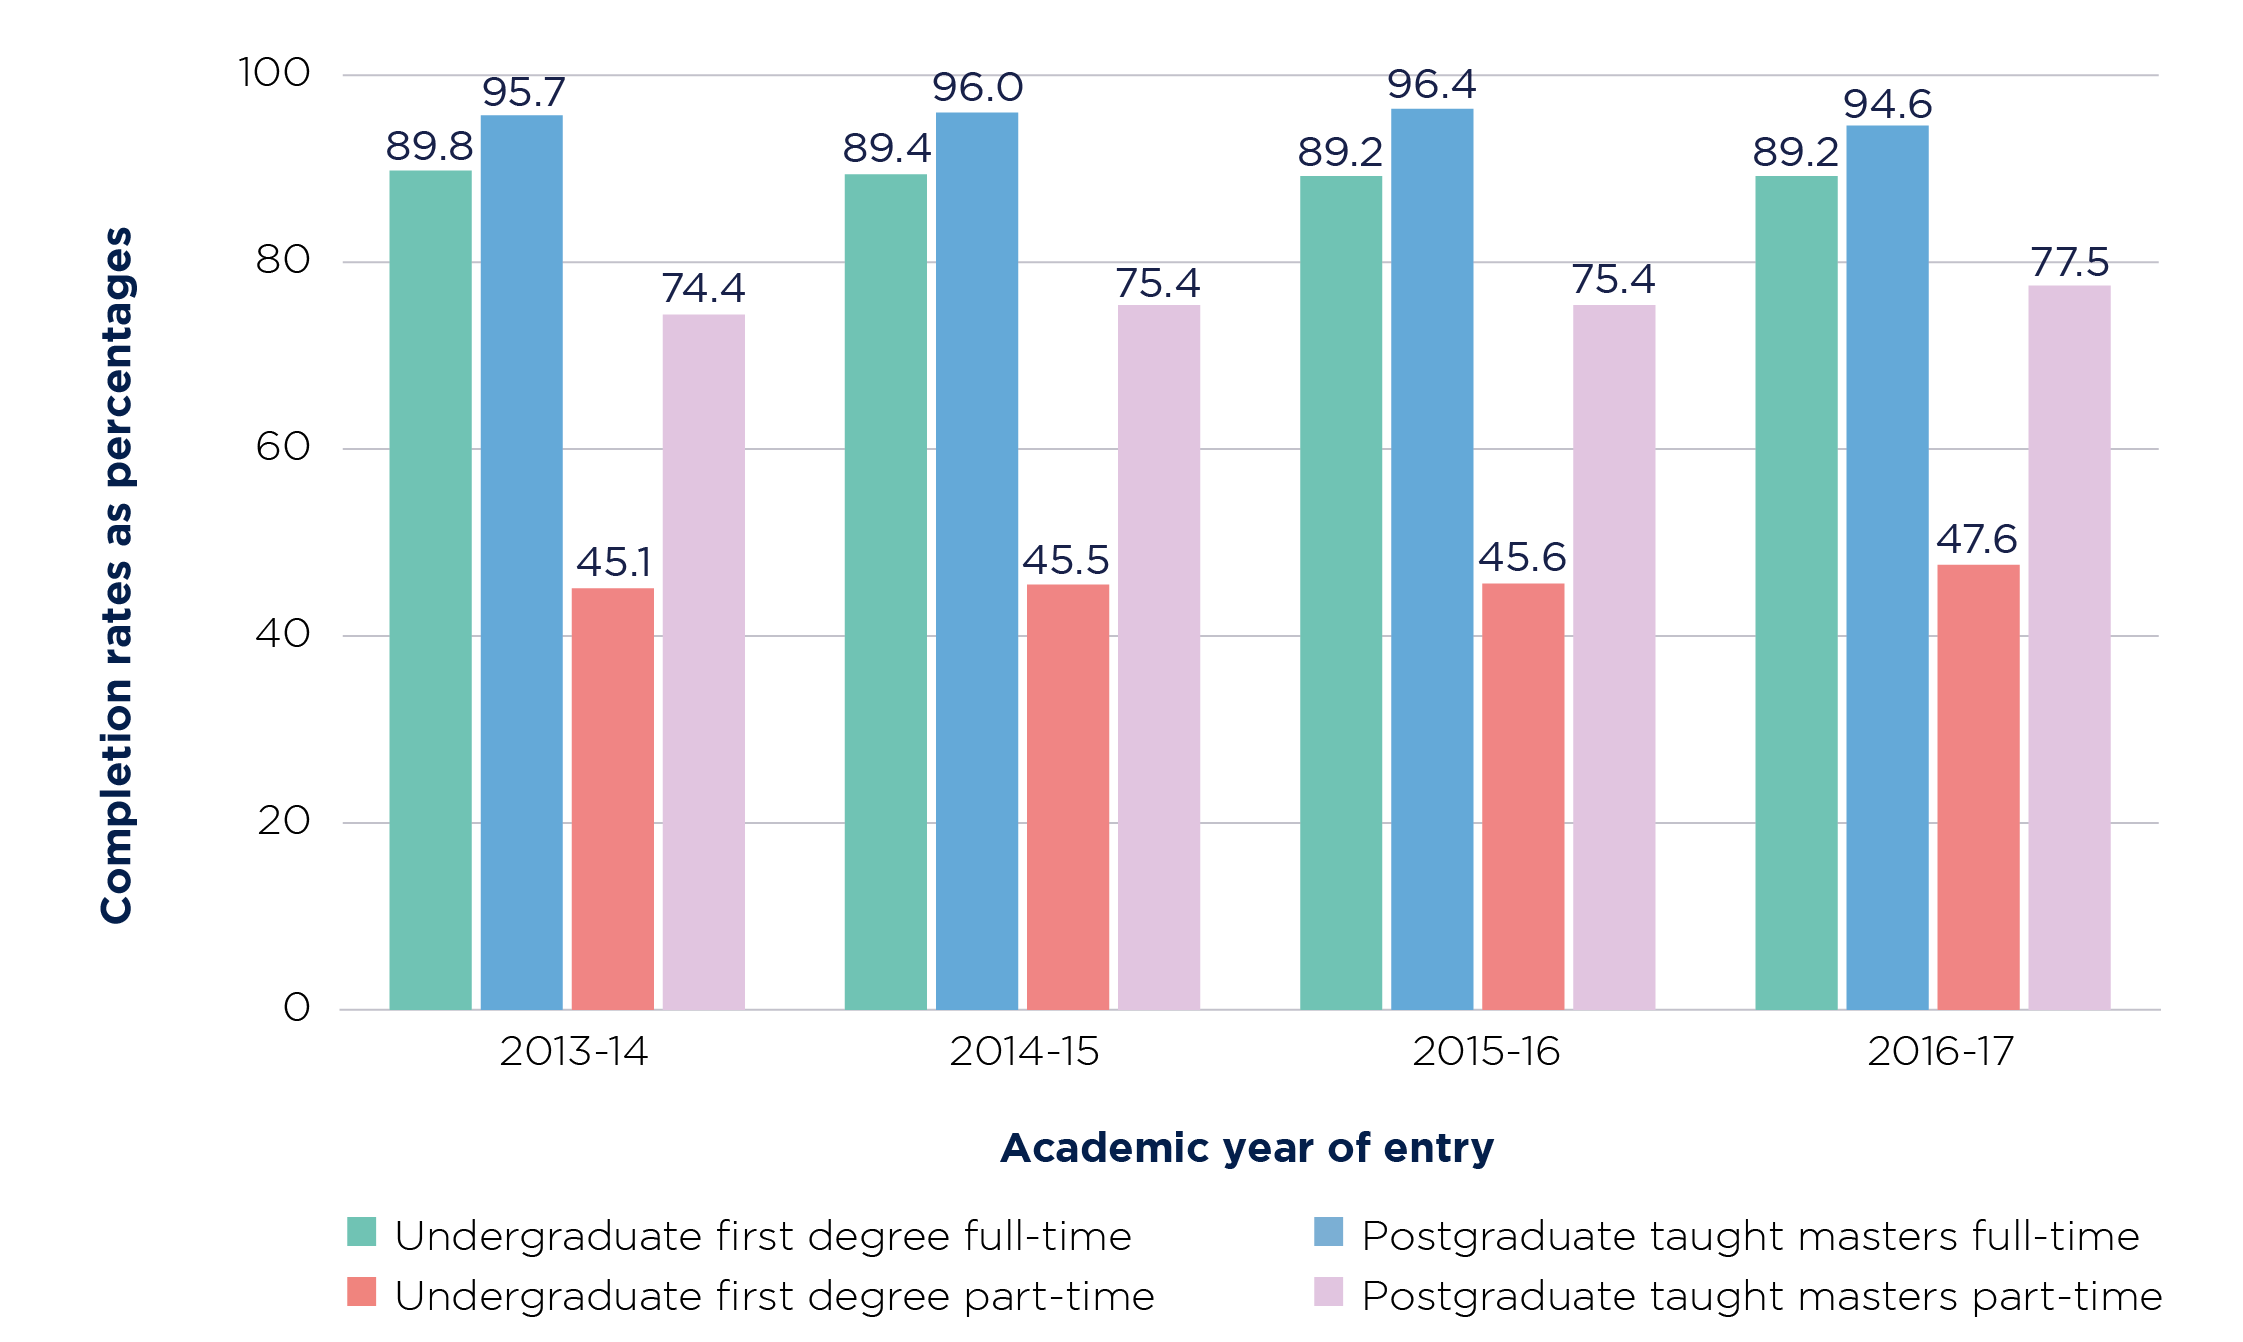
Source: OfS, ‘Student outcomes data dashboard’. Data from all OfS registered providers.88
Figure 3 is a quadruple bar chart showing completion rates as a percentage in the years 2013-14 to 2016-17 for the following groups of students: undergraduate first degree full-time, postgraduate taught masters full-time, undergraduate first degree part-time, and postgraduate taught masters part-time. For all these groups, the rates remained roughly constant over time during this period.
Completion rates for underrepresented groups
Except where otherwise noted, this data is for full-time undergraduate first degree students (all domiciles) and is for four years in aggregate (entrants from 2013-14 to 2016-17). It describes actual differences between the underrepresented group chosen and a reference group. No other factors (for example, entry qualifications) have been taken into account.89
Socioeconomic background and students from the most deprived areas
Students from the most deprived areas of England (quintiles 1 and 2 measured by the Index of Multiple Deprivation) and least deprived areas (quintiles 3, 4, and 5) have completion rates of 85.2 per cent and 91.2 per cent respectively.90 Those students who were eligible for free school meals at Key Stage 4 (or any stage before that) have a completion rate of 84.8 per cent, compared with 91.6 per cent for those not eligible for free school meals.91
Black, Asian and minority ethnic students
Students from black, Asian and minority ethnic groups all have lower completion rates than that for students from a white ethnic group (90.0 per cent):
- Asian or Asian British: 88.7 per cent
- black or black British: 83.7 per cent
- mixed ethnic group: 86.6 per cent
- other ethnic groups: 85.7 per cent92
Mature students
Students whose ages on entry to higher education were 21 to 30 years and 31 years and over have completion rates of 84.1 per cent and 83.6 per cent respectively. This compares with the completion rate of 90.9 per cent for students under 21 years.
Disabled students
Students with no reported disability have a completion rate of 89.7 per cent. Completion rates are lower for students with one or more reported disabilities (86.8 per cent).
Progression
Progression rates after higher education use data from the Graduate Outcomes survey that measures the proportion of graduates who progress to managerial or professional employment, or further study or other positive outcomes, 15 months after they have left higher education.93
The progression rate for full-time undergraduate students gaining a qualification in higher education in 2019-20 (first degree) is 71.9 per cent (a 1.9 percentage point rise from the previous year). For their part-time counterparts it is higher, at 86.3 per cent (a 3.9 percentage point increase from the previous year). Female full-time undergraduate first degree students have a slightly lower progression rate than male students (71.1 per cent and 72.2 per cent respectively). It should be noted that these students gained qualifications at a time of related restrictions during the coronavirus pandemic.94
For postgraduate students studying a full-time taught masters and gaining a qualification in 2019-20, the progression rate is 80.3 per cent (a slight decrease from the previous two years’ figures). Part-time postgraduate students studying a taught masters have a higher rate of 91.4 per cent (also a slight decrease from the previous years’ rates) (see Figure 4).95
The proportion of students at providers where the relevant progression indicator is below our numerical threshold was 1.6 per cent for the most recent year, a rise from 0.7 per cent two years previously.96
Figure 4: Progression rates from higher education
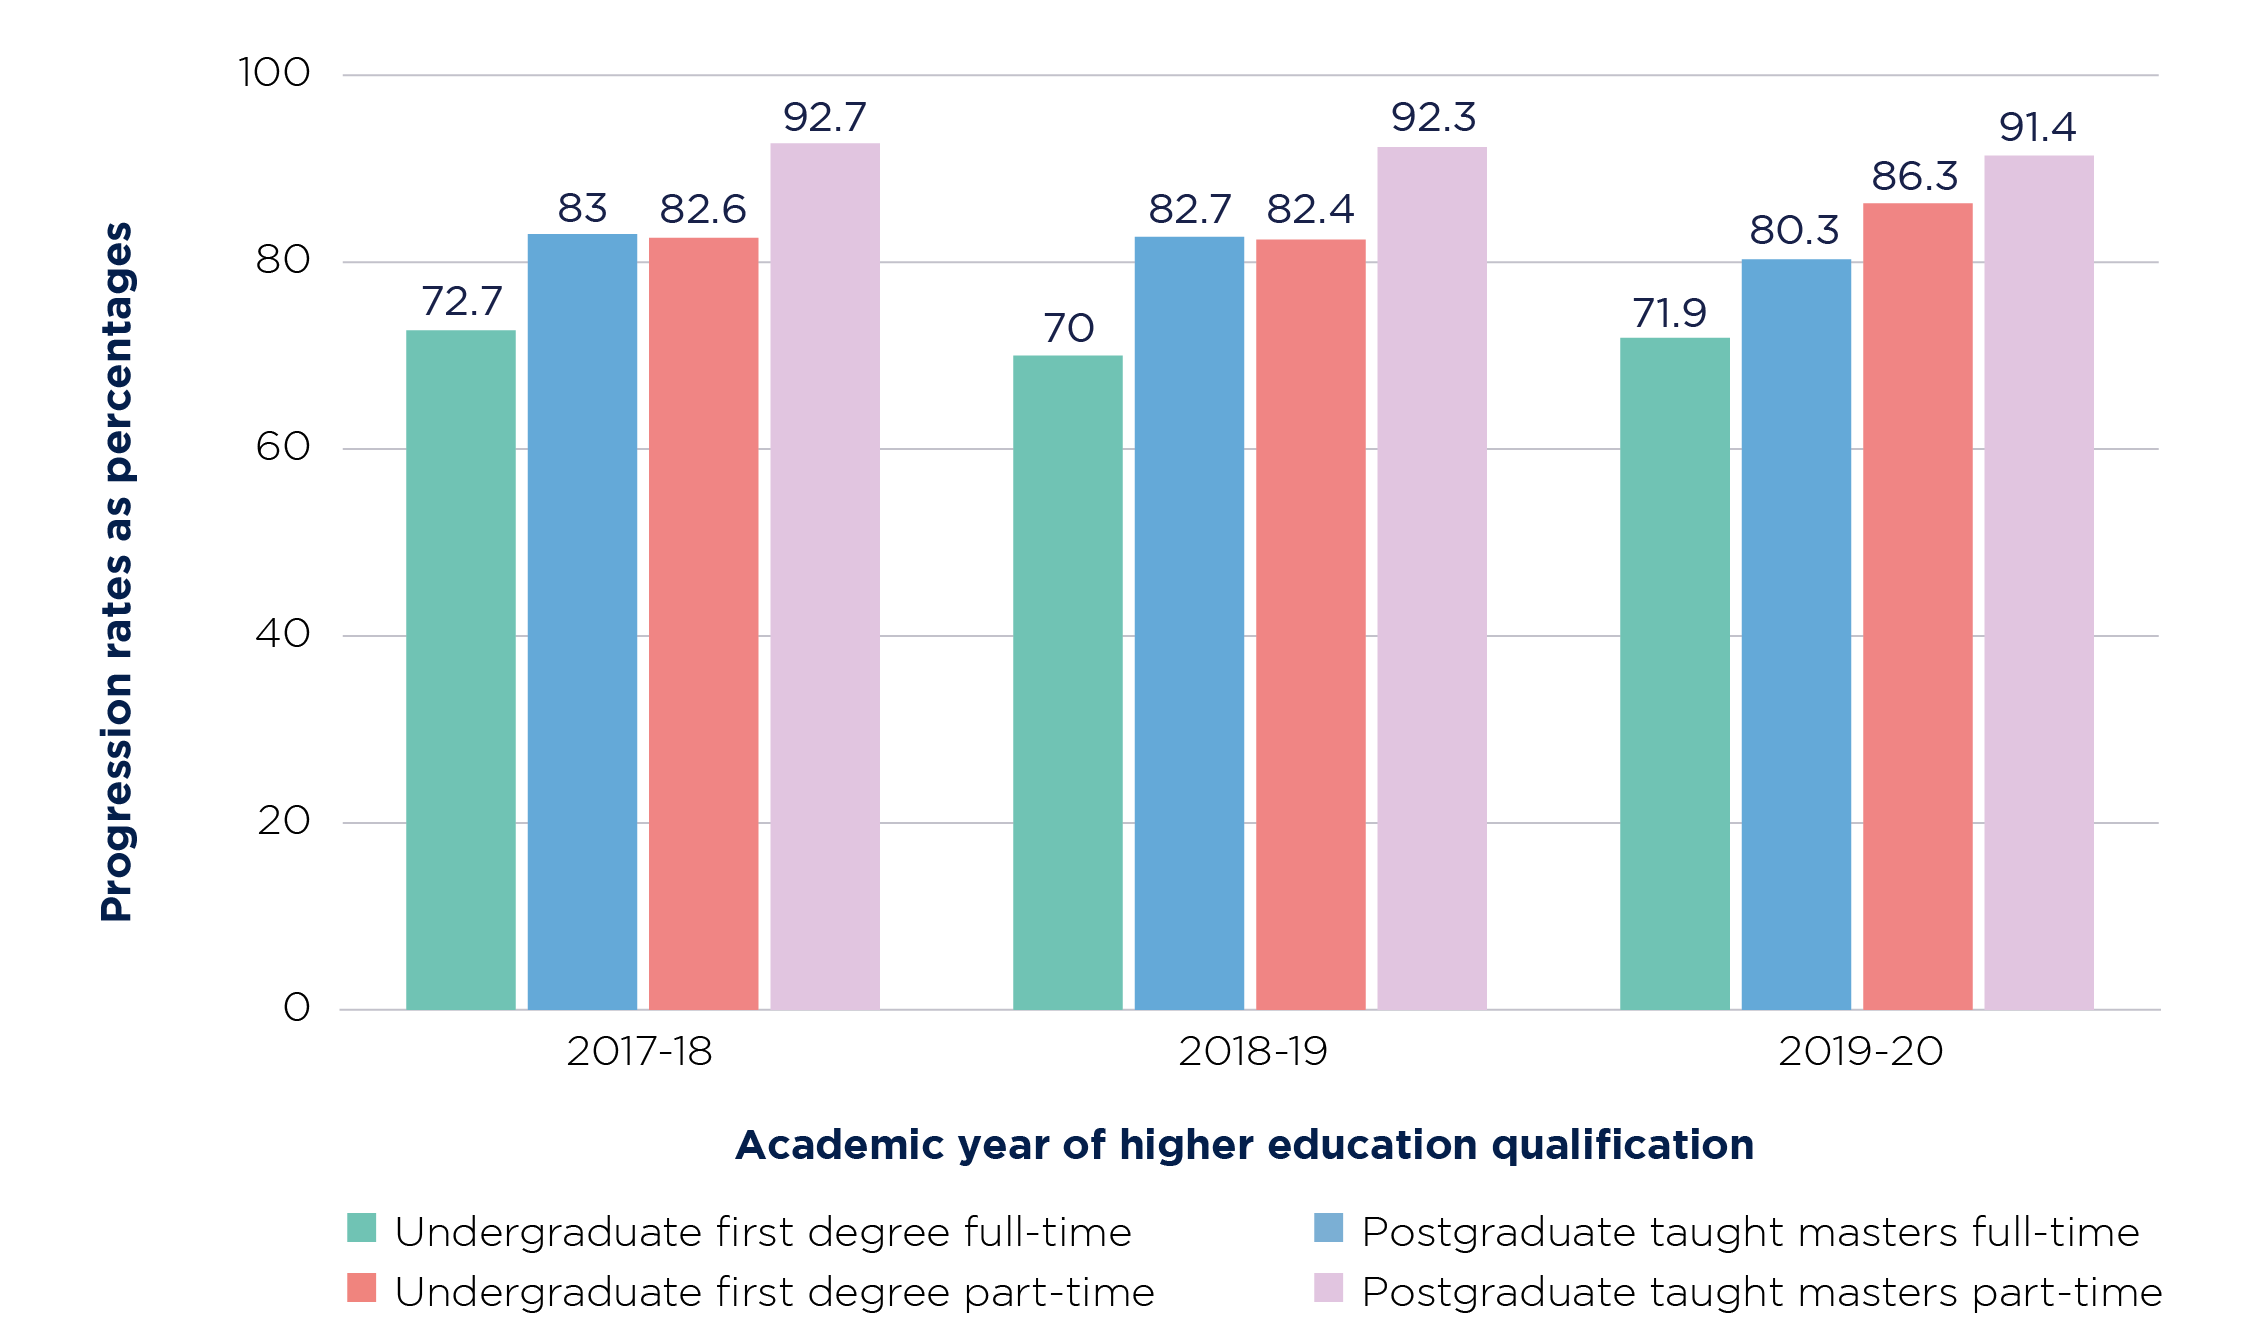
Source: OfS, ‘Student outcomes data dashboard’. Data from all OfS registered providers.97
Figure 4 is a quadruple bar chart showing continuation rates as a percentage in the years 2017-18 to 2019-20 for the following groups of students: undergraduate first degree full-time, postgraduate taught masters full-time, undergraduate first degree part-time, and postgraduate taught masters part-time. Postgraduate rates have shown a slight decrease over the period, while undergraduate part-time students saw an increase in 2019-20.
Progression rates after higher education for underrepresented groups
Except where otherwise noted, this data is for full-time undergraduate first degree students (UK domiciles only) and is for three years in aggregate (entrants from 2017-18 to 2019-20). It describes actual differences between the underrepresented group chosen and a reference group. No other factors (for example, entry qualifications) have been taken into account.98
Socioeconomic background and students from the most deprived areas
Students from the most deprived areas of England (quintiles 1 and 2 measured by the Index of Multiple Deprivation) and least deprived areas (quintiles 3, 4, and 5) have progression rates of 67.9 per cent and 73.5 per cent respectively.99 Those students who were eligible for free school meals at Key Stage 4 (or any stage before that) have a progression rate of 64.5 per cent, compared with 70.6 per cent for those not eligible for free school meals.100
Black, Asian and minority ethnic students
Students from black, Asian and minority ethnic groups all have lower progression rates than that for students from a white ethnic group (72.5 per cent):
- Asian or Asian British: 68.0 per cent
- black or black British: 69.1 per cent
- mixed ethnic group: 71.0 per cent
- other ethnic groups: 68.0 per cent
Mature students
Students whose ages on entry to higher education were 21 to 30 years and 31 years and over have progression rates of 73.9 per cent and 76.9 per cent respectively. This compares with the progression rate of 70.8 per cent for students under 21 years.
Disabled students
Students with no reported disability have a progression rate of 71.9 per cent. Progression rates are slightly lower (70.0 per cent) for students with one or more reported disabilities.
Erratum: In Figures 2 and 3, the continuation and completion rates shown for part-time students (both undergraduate first degree and postgraduate taught masters) have been misdated, and thus displaced on the graph. In Figure 2, the percentages are displaced by a year; thus the part-time continuation rates shown for 2016-17 in fact apply to 2015-16, those shown for 2017-18 are for 2016-17, those shown for 2018-19 are for 2017-18, and those shown for 2019-20 are for 2018-19. In Figure 3, the displacement is by two years; thus the part-time completion rates shown for 2013-14 in fact apply to 2011-13, those shown for 2014-15 are for 2012-13, those shown for 2015-16 are for 2013-14, and those shown for 2016-17 are for 2014-15. In all cases the rates for full-time students (both undergraduate first degree and postgraduate taught masters) are assigned to the correct years. For a more recent and accurate presentation of continuation and completion rates, see the OfS Annual review 2023.
51. OfS, ‘Consultation on a new approach to regulating student outcomes’ (OfS 2022.01), January 2022, (available at www.officeforstudents.org.uk/publications/student-outcomes-and-teaching-excellence-consultations/student-outcomes/).
52. OfS, ‘Size and shape of provision data dashboard’ (https://www.officeforstudents.org.uk/data-and-analysis/size-and-shape-of-provision-data-dashboard/).
53. See www.officeforstudents.org.uk/advice-and-guidance/the-register/the-ofs-register/#/.
54. OfS, ‘Provider typologies 2022: Methodology for grouping OfS-registered providers’ (OfS 2022.46), November 2022 (available at www.officeforstudents.org.uk/publications/provider-typologies-2022/).
55. The OfS Register (www.officeforstudents.org.uk/advice-and-guidance/the-register/the-ofs-register/#/).
56. See OfS, ‘Regulatory advice 5: Exempt charities’ (OfS 2018.23), May 2018 (available at www.officeforstudents.org.uk/publications/regulatory-advice-5-exempt-charities/).
57. OfS, ‘Financial sustainability of higher education providers in England 2022 update’ (OfS 2022.32), June 2022 (available at www.officeforstudents.org.uk/publications/financial-sustainability-of-higher-education-providers-in-england-2022-update/). Audited financial data from 2019-20 and 2020-21 and forecasts to 2024-25.
58. OfS, ‘Financial sustainability of higher education providers in England 2022 update’ (OfS 2022.32), June 2022 (available at www.officeforstudents.org.uk/publications/financial-sustainability-of-higher-education-providers-in-england-2022-update/).
59. OfS, ‘Financial sustainability of higher education providers in England 2022 update’ (OfS 2022.32), June 2022 (available at www.officeforstudents.org.uk/publications/financial-sustainability-of-higher-education-providers-in-england-2022-update/). This excludes further education colleges.
60. OfS, ‘Financial sustainability of higher education providers in England 2022 update’ (OfS 2022.32), June 2022 (available at www.officeforstudents.org.uk/publications/regulatory-advice-16-reportable-events/).
61. OfS, ‘Regulatory advice 16: Reportable events. Guidance for registered providers’ (OfS 2021.44), October 2021 (available at www.officeforstudents.org.uk/publications/regulatory-advice-16-reportable-events/).
62. OfS, ‘Operational measures’ (www.officeforstudents.org.uk/about/operational-measures/om-1-reportable-events/).
63. OfS, ‘Notifications’ (www.officeforstudents.org.uk/for-students/ofs-and-students/notifications/).
64. OfS, ‘Operational measures’ (www.officeforstudents.org.uk/about/operational-measures/om-2-notifications/).
65. Data on the profile of students entering higher education is taken from OfS, ‘Size and shape of provision data dashboard’ (www.officeforstudents.org.uk/data-and-analysis/size-and-shape-of-provision-data-dashboard/data-dashboard/). Data is from all OfS registered providers.
66. OfS, ‘Key performance measure 5: Access to higher education’ (available at www.officeforstudents.org.uk/about/key-performance-measures/kpm-5-access-to-higher-education/). This number only includes those students who could be linked to their school record in their GCSE year.
67. OfS, ‘Student characteristics data: Population data’ (www.officeforstudents.org.uk/data-and-analysis/student-characteristics-data/population-data-dashboard/).
68. OfS, ‘Student outcomes data dashboard’ (www.officeforstudents.org.uk/data-and-analysis/student-outcomes-data-dashboard/data-dashboard).
69. OfS, ‘Student outcomes data dashboard’ (www.officeforstudents.org.uk/data-and-analysis/student-outcomes-data-dashboard/data-dashboard).
70. OfS, ‘Student outcomes data dashboard’ (www.officeforstudents.org.uk/data-and-analysis/student-outcomes-data-dashboard/data-dashboard).
71. For more information see OfS, ‘Size and shape of provision data dashboard’ (www.officeforstudents.org.uk/data-and-analysis/size-and-shape-of-provision-data-dashboard/data-dashboard/).
72. Index of Multiple Deprivation data for UK-domiciled students only who have a home postcode in the same country as their provider.
73. Data is for UK-domiciled students only and only from providers that submit data to the Higher Education Statistics Agency student record. The collection of the National Statistics Socio-economic Classification data differs depending on the student’s entry age. For students aged 21 and over at entry, it is based on their occupation prior to starting their course. For students under 21, it is based on the occupation of their parent, stepparent or guardian who earns the most.
74. Data is for students under 21 years at age of entry who attended English schools, using information from the National Pupil Database for England.
75. OfS, ‘Key performance measure 4: Students’ views on aspects of quality’ (www.officeforstudents.org.uk/about/key-performance-measures/kpm-4-students-views-on-aspects-of-quality/).
76. For full findings, see OfS, ‘National Student Survey’ (www.officeforstudents.org.uk/advice-and-guidance/student-information-and-data/national-student-survey-nss/nss-data-overview).
77. The data for male and female students is for full-time undergraduate first degree students (all domiciles) and for four years in aggregate (entrants from 2016-17 to 2019-20).
78. Data on continuation rates is for all domiciles and is taken from OfS, ‘Student outcomes data dashboard’ (www.officeforstudents.org.uk/data-and-analysis/student-outcomes-data-dashboard/data-dashboard).
79. OfS, ‘Key performance measure 1: Extent of poor student outcomes’ (www.officeforstudents.org.uk/about/key-performance-measures/kpm-1-extent-of-poor-student-outcomes/).
80. OfS, ‘Student outcomes data dashboard’ (www.officeforstudents.org.uk/data-and-analysis/student-outcomes-data-dashboard/data-dashboard).
81. OfS, ‘Student outcomes data dashboard’ (www.officeforstudents.org.uk/data-and-analysis/student-outcomes-data-dashboard/data-dashboard).
82. Data is for England-domiciled students only.
83. Data is for students under 21 years at age of entry who attended English schools, using information from the National Pupil Database for England.
84. Data is for UK-domiciled students only.
85. The data for male and female students is for full-time undergraduate first degree students (all domiciles) and for four years in aggregate (entrants from 2013-14 to 2016-17).
86. Data on completion rates is for all domiciles and is taken from OfS, ‘Student outcomes data dashboard’ (www.officeforstudents.org.uk/data-and-analysis/student-outcomes-data-dashboard/data-dashboard).
87. OfS, ‘Key performance measure 1: Extent of poor student outcomes’ (www.officeforstudents.org.uk/about/key-performance-measures/kpm-1-extent-of-poor-student-outcomes/).
88. OfS, ‘Student outcomes data dashboard’ (www.officeforstudents.org.uk/data-and-analysis/student-outcomes-data-dashboard/data-dashboard).
89. OfS, ‘Student outcomes data dashboard’ (www.officeforstudents.org.uk/data-and-analysis/student-outcomes-data-dashboard/data-dashboard).
90. Data is for England-domiciled students only.
91. Data is for students under 21 years at age of entry who attended English schools, using information from the National Pupil Database for England.
92. Data is for UK-domiciled students only.
93. See https://www.graduateoutcomes.ac.uk/.
94. The data for male and female students is for full-time undergraduate first degree students (UK-domiciled only) and for three years in aggregate (qualifiers from 2017-18 to 2019-20).
95. Data on progression rates is for UK students only and is taken from OfS, ‘Student outcomes data dashboard’ (www.officeforstudents.org.uk/data-and-analysis/student-outcomes-data-dashboard/data-dashboard).
96. OfS, ‘Key performance measure 1: Extent of poor student outcomes’ (www.officeforstudents.org.uk/about/key-performance-measures/kpm-1-extent-of-poor-student-outcomes/).
97. OfS, ‘Student outcomes data dashboard’ (www.officeforstudents.org.uk/data-and-analysis/student-outcomes-data-dashboard/data-dashboard).
98. OfS, ‘Student outcomes data dashboard’ (www.officeforstudents.org.uk/data-and-analysis/student-outcomes-data-dashboard/data-dashboard).
99. Data is for students domiciled in England only.
100. Data is for students under 21 years at age of entry who attended English schools, using information from the National Pupil Database for England.
Describe your experience of using this website