Place matters: Inequality, employment and the role of higher education
Considerable geographical disparities affect students and graduates in England. The rate of gaining entry to higher education varies by location, as does the availability of nearby provision and of graduate-level employment opportunities after university. These divergences are complex and can be very local, but often affect rural and coastal areas, and pockets of deprivation within major cities. This brief examines how the OfS, universities and colleges are working together for change.
- Date:
- 4 November 2021
Read the brief
Download the Insight brief as a PDF
TUNDRA access by region
Download the TUNDRA data
Read the Insight brief online
- Geographical inequalities in England
- Access to higher education
- Graduate employment
- OfS regulation and funding of access and participation
- Universities and colleges in their communities
- Case study: The University of Oxford’s Oxplore – Raising Attainment in Schools project
- Local graduates
- Case Study: Gateway to Growth, University of East Anglia
- Mature students
- Case study: Engaging parents: Greater Manchester Higher
- The case for change
Geographical inequalities in relation to access to and progression beyond higher education are longstanding. They flow from disparities emerging in early education, which continue to influence whether and where people go to university or college, and their prospects for well paid graduate jobs.1
More students than is generally appreciated do not move far from home to study, which then also affects their options for work.2 Where graduate jobs are clustered, and who has the opportunity to move to take them up, are then crucial. How universities, colleges and employers can work together to capitalise on graduate knowledge and skills in all parts of the country is increasingly important for productivity and prosperity. This Insight brief shows how patterns of access and graduate employment vary across England, and how universities and colleges are working with local partners to address these inequalities.
Geographical inequalities in England
Place-based inequalities in England are long established and deep-rooted. London has the highest Gross Domestic Product and productivity of any English region by some margin.3 Graduates in the north east on average earn £29,000, while those in London earn £40,000.4 Whereas people living in wealthier areas have similar life expectancy across the country, people from more deprived areas have lower life expectancy in the north than in the south of England.5 And while coastal towns and ex-industrial towns in the north and midlands are relatively poorer than other areas, this gap has not widened since the 2000s, partly because of an increase in the minimum wage.6
There is also great variation within London, which has the greatest proportion of people living on low incomes after housing costs are taken into account. Of the 20 local authorities with the highest rate of child poverty in 2018-19, 13 were in London.7
Regional educational disparities emerge from early years and grow through the education system. By GCSE level, over 60 per cent of pupils in London achieve five good grades, compared with 55 per cent in the midlands.8 In Westminster, there is virtually no gap in GCSE attainment between the most and least advantaged pupils, but in Blackpool, Knowsley and Plymouth the gap is around 25 per cent.9 All of the top 10 local authorities with the lowest gaps in GCSE attainment are in London. In 2021, 34.5 per cent of GCSEs awarded to London pupils were graded between 7 and 9, compared with 24.4 per cent in Yorkshire and the Humber.10
Moving between places as a child can also affect outcomes. Among groups such as Gypsy, Roma and Travellers, and children in military families, habitual movement between places can lead to disrupted schooling.11
Research suggests that such educational inequality is influenced by industrial loss and economic decline extending well beyond the education system.12 However, the presence of universities and colleges is also geographically uneven in England. Rural and coastal areas have been identified as higher education ‘cold spots’ with little or no higher education provision.13
Many of these disparities in education and employment have been exacerbated during the pandemic. In the words of the Institute for Fiscal Studies’ IFS Deaton Review, the pandemic and resulting lockdowns have ‘cruelly exposed huge variations in how easily we are able to weather threats to livelihoods, to educational progress, to physical and mental health’.14
A recent survey has suggested that inequality between more and less deprived areas is a concern that unites people with quite different backgrounds and perspectives.15 The government has pledged to increase funding to ‘left behind areas’, with the aim of ensuring that there are good opportunities for everyone, wherever they come from, and that they can gain the knowledge and skills they need to open up choices about their lives and work.16, 17 This is also intended to ensure that local businesses, the NHS and other public services have the skilled employees and infrastructure they need to thrive. The promise of this geographical intervention is that it should transform both individual lives and local communities, by creating highly skilled jobs, new businesses and investment.18
A focus on place raises wider issues of who gains access to the most advanced knowledge and skills through university or college, how they ‘fit in’ among people of different class and ethnic backgrounds once they get there, and the opportunities available to them after graduation. This brief tracks how place can affect these opportunities, and how the higher education sector and the OfS are seeking to tackle these challenges.
Access to higher education
Nationally, 42.2 per cent of young people from English state schools have entered higher education by the age of 19.19 This rate varies by region. The highest entry rate is 54.2 per cent in London, while the lowest is 37.4 per cent in the South West (see Figure 1).20
Figure 1: Proportion of young people from each region who entered higher education aged 18 or 19
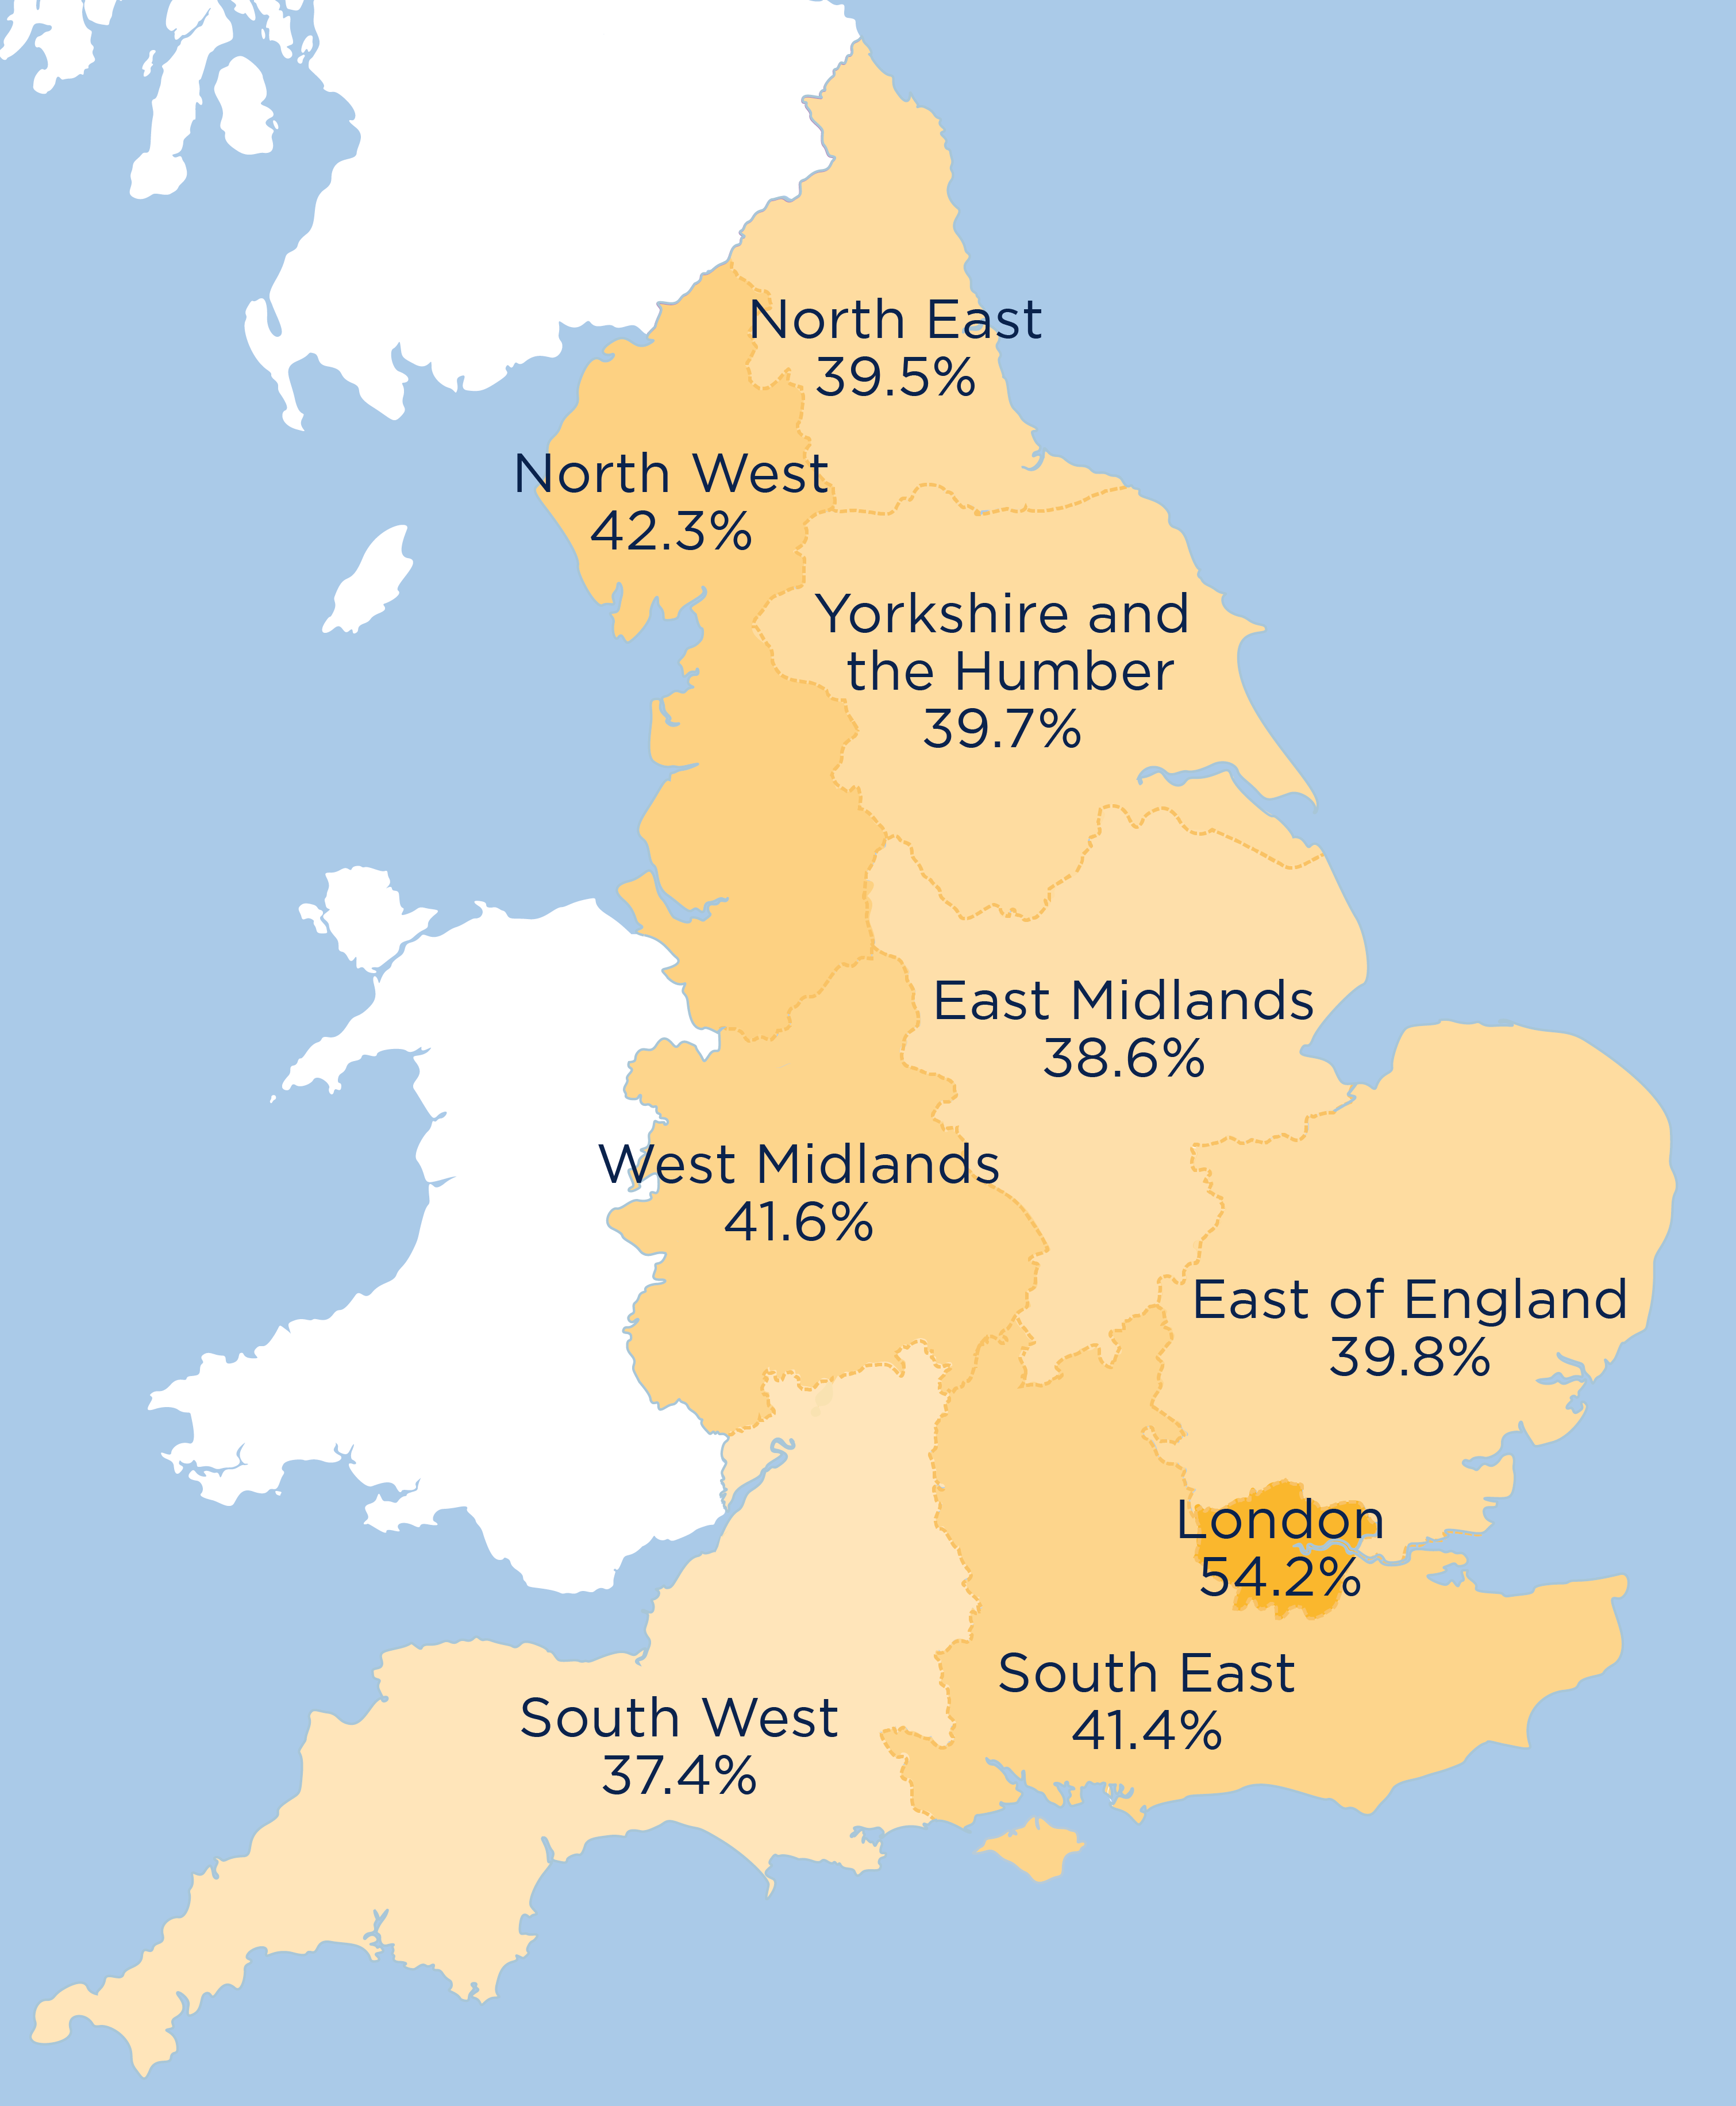
Figure 1 is a map of England showing the proportion of young people who entered higher education by region. It shows that:
- In the North West, 42.3 per cent of young people enter higher education.
- In the North East, 39.5 per cent of young people enter higher education.
- In Yorkshire and the Humber, 39.7 per cent of young people enter higher education.
- In the West Midlands, 41.6 per cent of young people enter higher education.
- In the East Midlands, 38.6 per cent of young people enter higher education.
- In the East of England, 39.8 per cent of young people enter higher education.
- In the South West, 37.4 per cent of young people enter higher education.
- In London, 54.2 per cent of young people enter higher education.
- In the South East, 41.4 per cent of young people enter higher education.
There are many reasons for these regional differences. There are issues of demand, which relate to prior attainment and expectations about higher education in different parts of the country, but also of supply, given the differing numbers and sizes of higher education providers in each region.21 In London, there is both higher attainment in schools and colleges, and a wealth of opportunities for entering higher education.
Taking such large regions, however, overlooks intra-regional disparities, which are often more substantial than those between regions, and often on a very local scale.22 To take the south west as an example, 77.6 per cent of young people in Westbury Park, Bristol, had experience of higher education while, six miles away and still in Bristol, this was true of only 8.7 per cent of their counterparts in Hartcliffe.23 This is not, therefore, a simple story of north versus south; Jesmond in Newcastle and Trafford in Manchester have access rates above 70 per cent.24, 25
As previous OfS analysis has shown, many of the places with the lowest participation are coastal towns, and ex-industrial neighbourhoods across the north and the midlands. Most of these areas have very high proportions of people with the characteristics that are most underrepresented in higher education, such as white pupils on free school meals.26
To get at these local disparities, the OfS uses measures of educational disadvantage – Participation of Local Areas (POLAR) and Tracking Underrepresentation by Area (TUNDRA) – to identify the places to target for intervention and funding. Both measures classify local areas into five groups (quintiles) based on the proportion of young people who enter higher education aged 18 or 19. The OfS has also developed an Associations Between Characteristics of Students (ABCS) measure, which enables us to combine place-based measures with other factors such as ethnicity and free school meal status.27 This measure will improve targeting, by identifying the students who are particularly underrepresented in higher education. The government has signalled that this will be an important way to improve the support for students in ‘left behind areas’.28
In addition to measuring levels of inequality in relation to higher education access, measures such as these enable us to understand the progress being made to address them. For example, as Figure 2 shows, the overall gap between students from the neighbourhoods that are most and least represented in higher education has reduced steadily in recent years. The more this gap narrows, the more we can say that background does not limit access to higher education. Nevertheless, in 2019-20, students from the most represented areas were still almost twice as likely to access higher education as those from the least represented areas, and the gap was much bigger in the highest tariff universities.29
Figure 2: Gap in participation between most and least represented groups
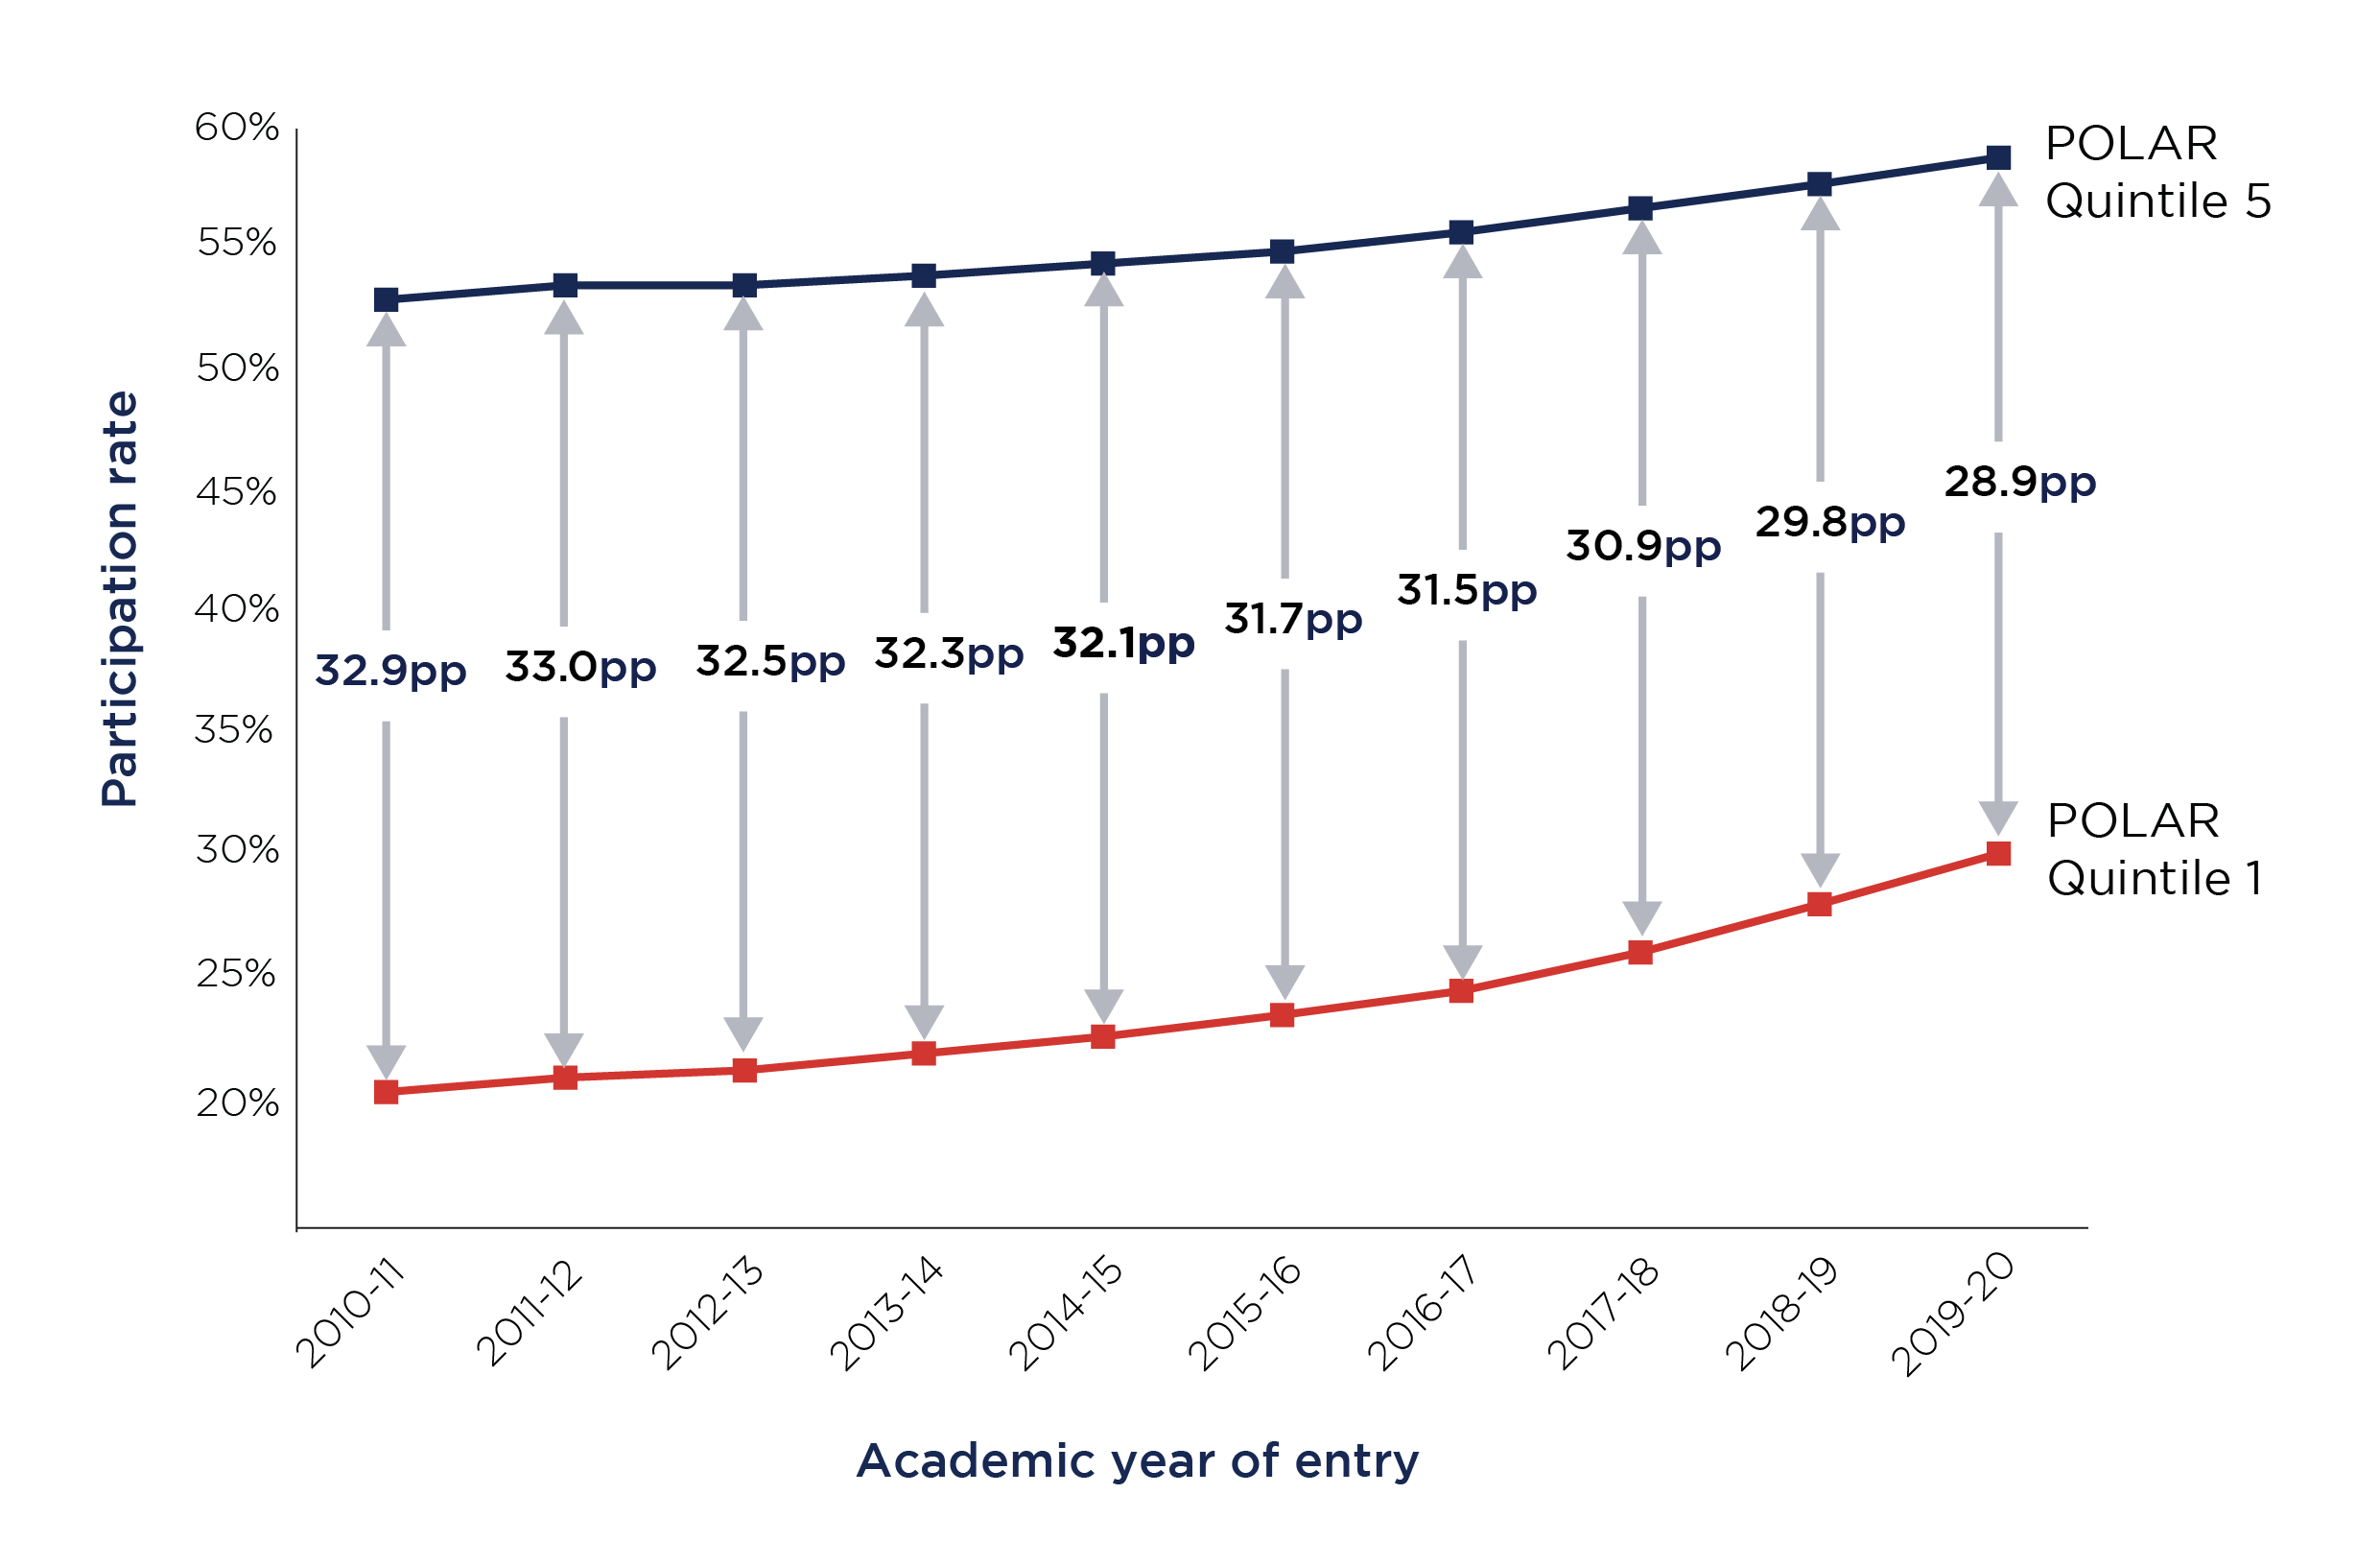
Figure 2 is a double line graph. It shows the gap in participation between most and least represented groups between 2010-11 and 2019-20. The overall gap between the groups of students who are most and least likely to take up higher education has reduced steadily in recent years.
It shows that:
- In 2010-11, 20.0 per cent of students in POLAR quintile 1 participated in higher education, versus 52.9 per cent in quintile 5. This is a gap of 32.9 percentage points.
- In 2011-12, 20.6 per cent of students in POLAR quintile 1 participated in higher education, versus 53.5 per cent in quintile 5. This is a gap of 33.0 percentage points.
- In 2012-13, 20.9 per cent of students in POLAR quintile 1 participated in higher education, versus 53.5 per cent in quintile 5. This is a gap of 32.5 percentage points.
- In 2013-14, 21.6 per cent of students in POLAR quintile 1 participated in higher education, versus 53.9 per cent in quintile 5. This is a gap of 32.3 percentage points.
- In 2014-15, 22.3 per cent of students in POLAR quintile 1 participated in higher education, versus 54.4 per cent in quintile 5. This is a gap of 32.1 percentage points.
- In 2015-16, 23.2 per cent of students in POLAR quintile 1 participated in higher education, versus 54.9 per cent in quintile 5. This is a gap of 31.7 percentage points.
- In 2016-17, 24.2 per cent of students in POLAR quintile 1 participated in higher education, versus 55.7 per cent in quintile 5. This is a gap of 31.5 percentage points.
- In 2017-18, 25.8 per cent of students in POLAR quintile 1 participated in higher education, versus 56.7 per cent in quintile 5. This is a gap of 30.9 percentage points.
- In 2018-19, 27.8 per cent of students in POLAR quintile 1 participated in higher education, versus 57.7 per cent in quintile 5. This is a gap of 29.8 percentage points.
- In 2019-20, 29.9 per cent of students in POLAR quintile 1 participated in higher education, versus 58.8 per cent in quintile 5. This is a gap of 28.9 percentage points.
Because of the disruption the pandemic has caused for schools and families in the most disadvantaged communities across the country, these disparities appear likely to grow. Four weeks after 2021 results day, 1,360 more applicants than last year from the most disadvantaged neighbourhoods had been offered places in English higher education, but 3,770 more from the most advantaged.30
Graduate employment
Employment, growth and productivity rates have long been geographically uneven. The pandemic may exacerbate this, with industries that are more important to specific parts of the country – especially tourism, service industries and retail – most affected.31 Local lockdowns during the pandemic have impacted some areas more than others.32
There are more well paid graduate jobs in London and the south east of England, meaning that those who do not want to move to these areas because of family and caring responsibilities, and connection with their local community, have fewer opportunities.
Figure 3 shows the proportion of graduates in each region in paid employment earning over £24,000 or in further study, divided into quintiles. It shows that most graduates in the north of England live in areas with the lowest proportion of the population in well paid jobs or in further study. There are also many coastal regions with similar patterns.33
Figure 3: Map of Longitudinal Education Outcomes quintiles
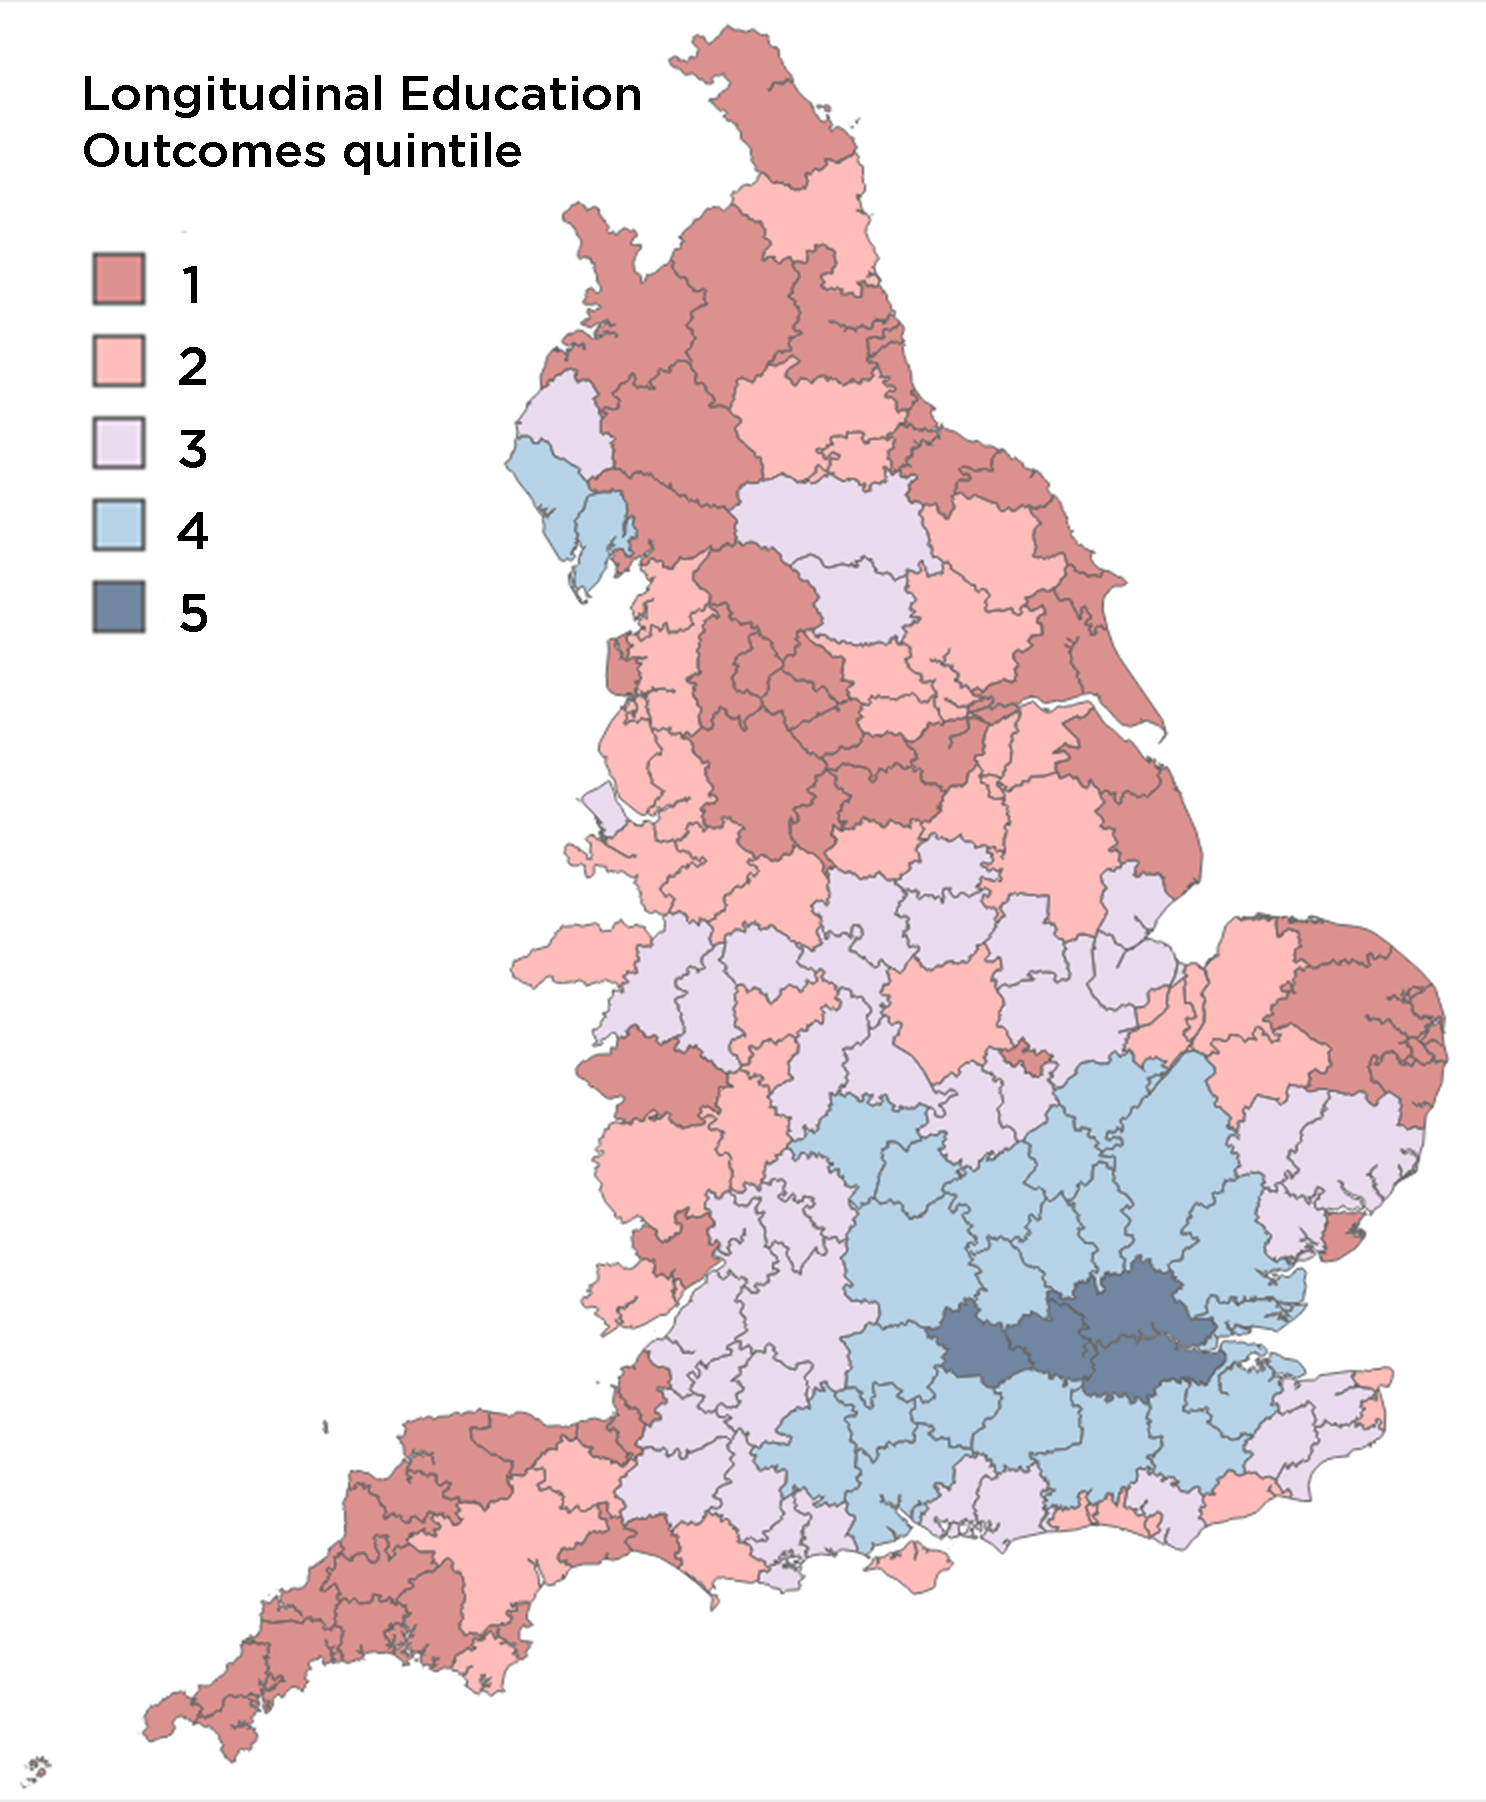
Figure 3 is a map of England that shows that the areas with the highest proportion of graduates earning over the threshold were centred around London. Most areas with the lowest proportion of graduates earning over the threshold were in coastal areas or the North of England.
Figure 4: Map of Graduate Outcomes quintiles
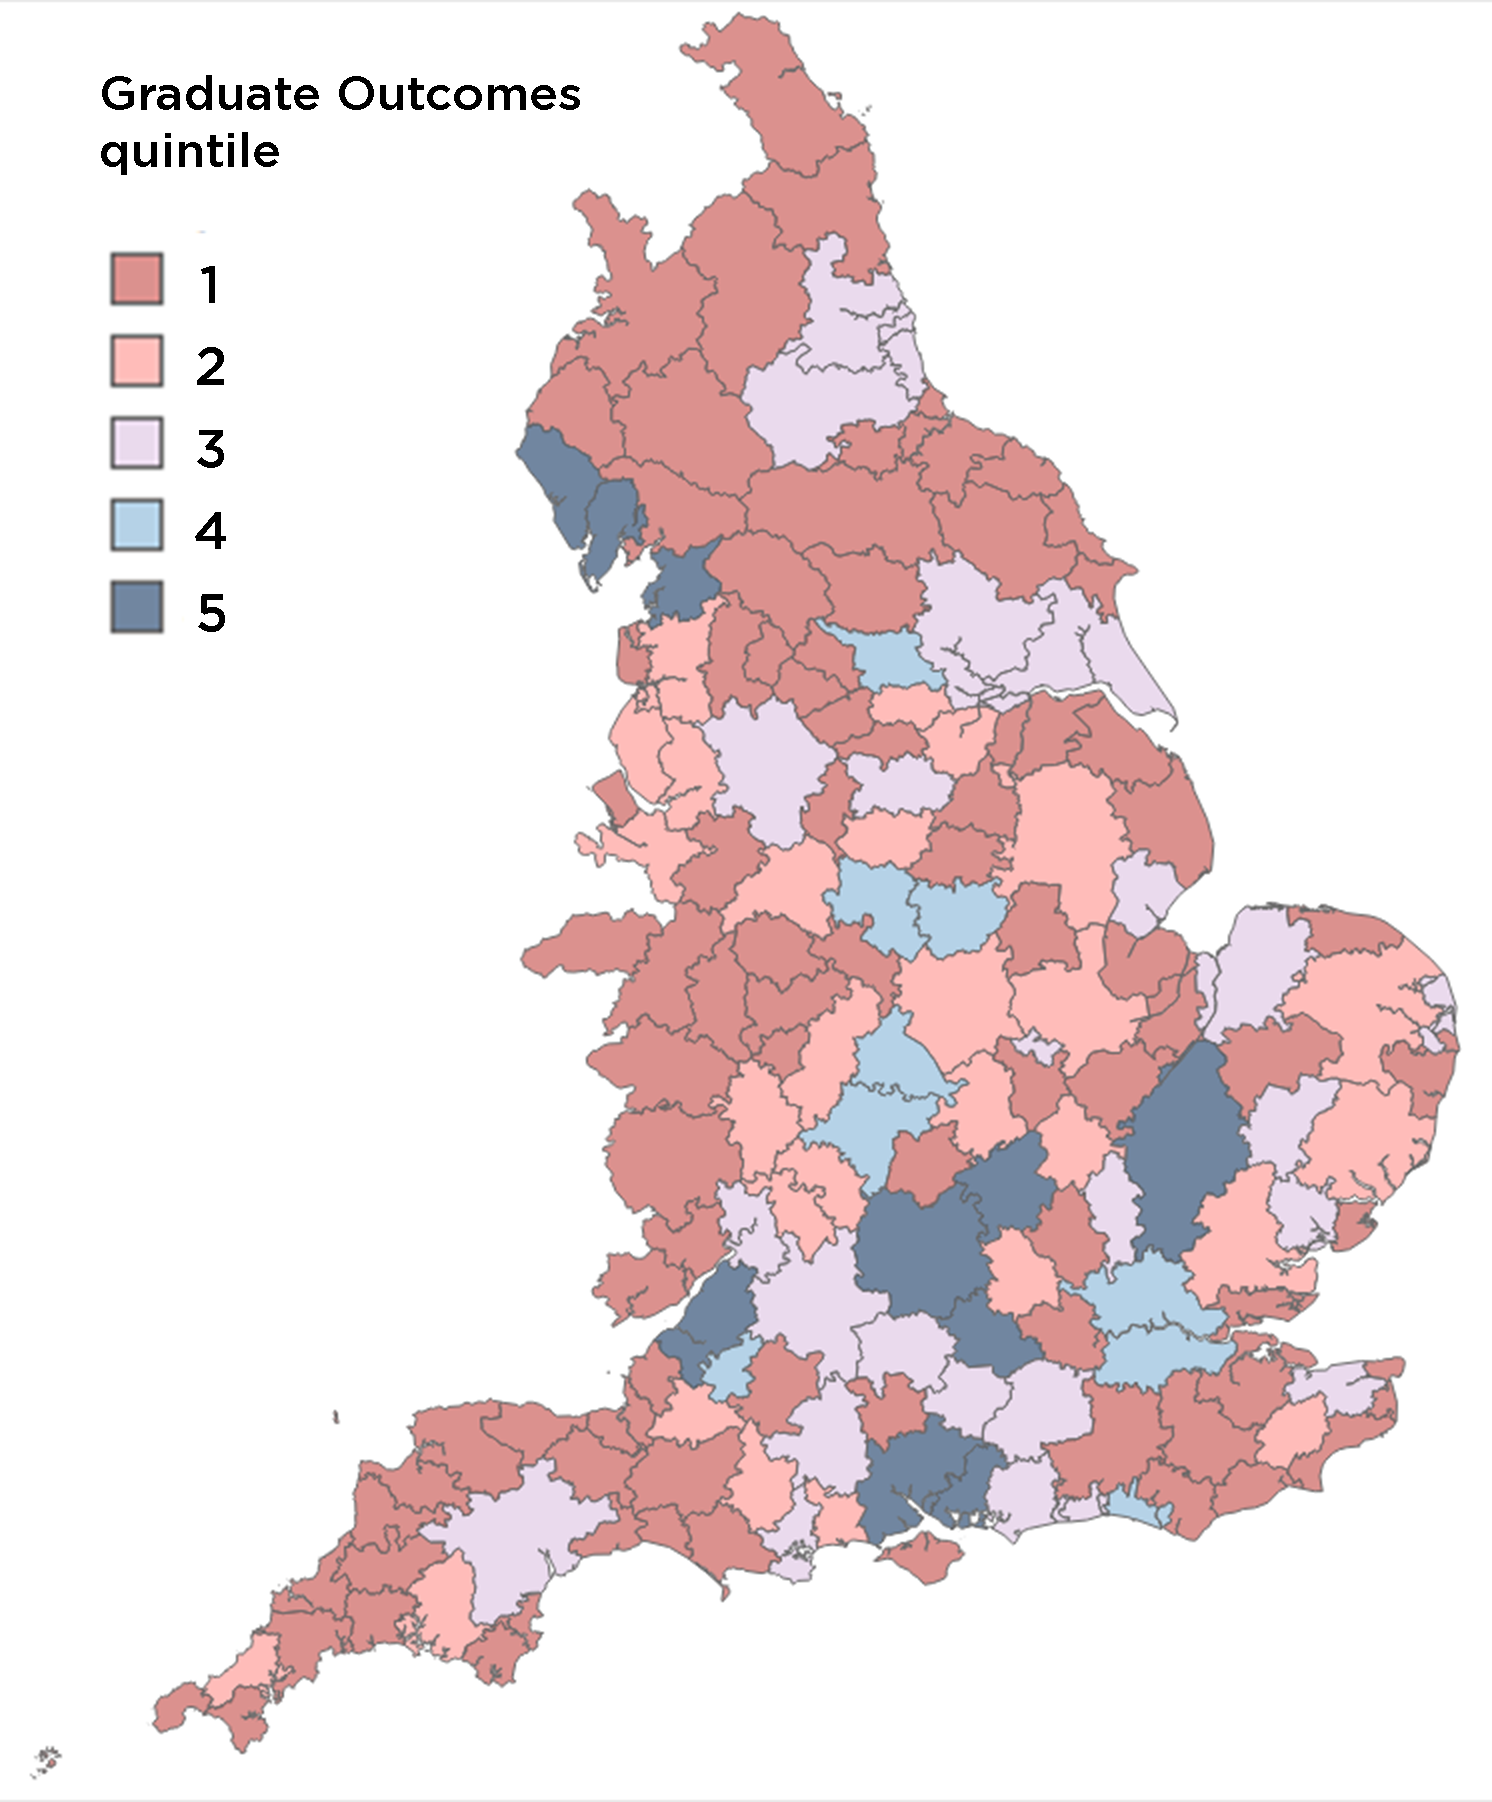
Figure 4 is a map of England that shows that the areas with the highest proportion of graduates in highly skilled jobs were mostly in the south of England, but with a number of quintile 4 and 5 areas across the rest of the country.
Figure 4 uses Graduate Outcomes data, based on a survey of qualifiers from higher education 15 months after they finished their course. It measures the proportion of these graduates who were in highly skilled employment or further study. This shows that the opportunities for highly skilled work are more evenly spread than those for the highest earnings, with some cities across the north, midlands and south west performing better than some of the areas around London. Even so, there are still weaker opportunities in towns, some cities, rural and coastal areas across all parts of England.34
Even in London, there are disparities in graduate employment outcomes. For instance, though a very high proportion of black graduates live in London, they have lower rates of well paid jobs than white students.35 In fact, looking only at graduates in London and other areas with high rates of well paid jobs, large gaps exist between the proportions of white and black graduates in such jobs – 73.5 per cent and 59.9 per cent respectively.36
This demonstrates the importance of understanding how geographical differences can be compounded by other factors, such as household income and ethnicity, and how they combine to influence the mobility and connections that may be needed to gain a foothold in many areas of graduate employment. The students who travel furthest across England to attend university, often to the highest tariff universities, are more likely to be white, middle-class and privately educated.37
In universities and colleges where the majority of students come from the local area, graduates are more likely to remain in their home region for work.38 As Figure 5 shows, students who do not move for study and after graduation are far more likely to have been eligible for free school meals (FSM).39 There is also evidence that British Pakistani and British Bangladeshi students are over six times more likely than white students to live at their parental home and study at local universities and colleges.40
Figure 5: Movement of young UK domiciled first degree graduates by FSM eligibility five years after graduation, 2018-19 tax year
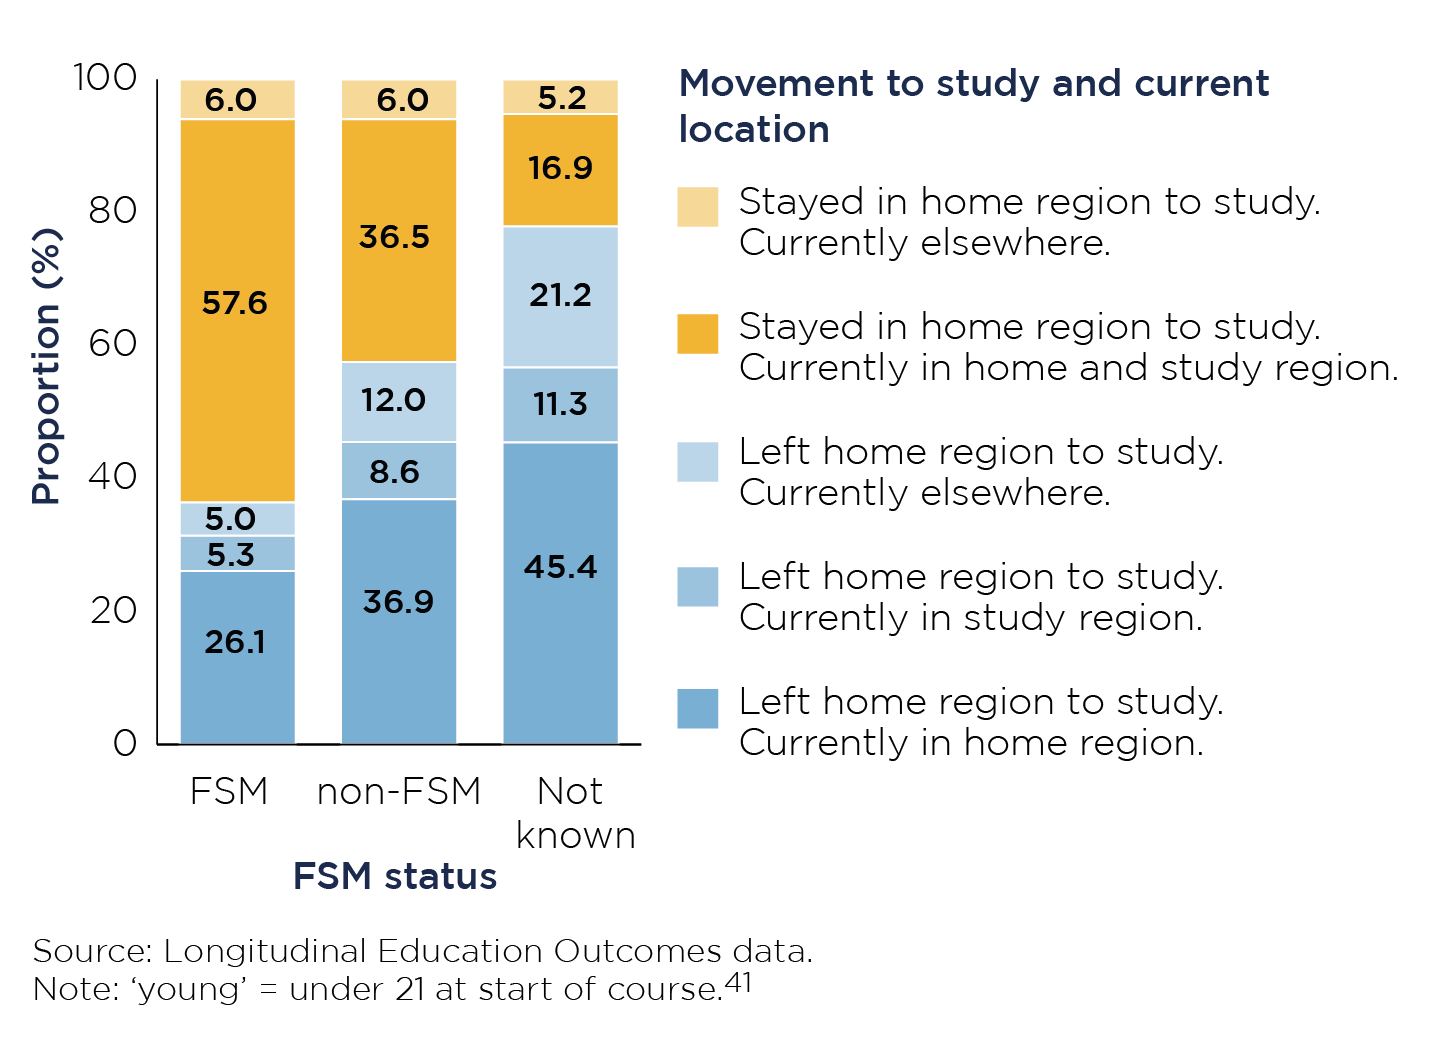
Source: Longitudinal Education Outcomes data.
Note: ‘young’ = under 21 at start of course.41
Figure 5 is a triple bar chart. It shows that young UK graduates on free school meals were less likely to move away from their home region for higher education and jobs than their non-free school meal.
For graduates who were eligible for free school meals:
- 6.0 per cent stayed in their home region to study and are currently elsewhere.
- 57.6 per cent stayed in their home region to study and are currently in that region.
- 5.0 per cent left home region to study and are currently elsewhere.
- 5.3 per cent left home region to study and are currently in their region of study.
- 26.1 per cent left home region to study and are currently in home region.
For graduates who were not eligible for free school meals:
- 6.0 per cent stayed in their home region to study and are currently elsewhere.
- 36.5 per cent stayed in their home region to study and are currently in that region.
- 12.0 per cent left home region to study and are currently elsewhere.
- 8.6 per cent left home region to study and are currently in their region of study.
- 36.9 per cent left home region to study and are currently in home region.
For graduates whose free school meal eligibility was not known:
- 5.2 per cent stayed in their home region to study and are currently elsewhere.
- 16.9 per cent stayed in their home region to study and are currently in that region.
- 21.2 per cent left home region to study and are currently elsewhere.
- 11.3 per cent left home region to study and are currently in their region of study.
- 45.4 per cent left home region to study and are currently in home region.
OfS regulation and funding of access and participation
The remainder of this brief examines what universities and colleges are doing and could potentially do to address these patterns. It also provides some examples of interventions for specific groups – such as commuter students and mature students – who are particularly affected by the opportunities in the place they live.
A regulatory objective for the OfS is that all students, from all backgrounds, have an equal opportunity to access, succeed in and progress from higher education. This is primarily delivered through our regulation of access and participation plans, through which universities and colleges have committed to reduce the gaps between the most and least represented groups in relation to access, student success and progression into employment or further study by 2024-25.42
We also fund activities that cannot be achieved by universities and colleges working on their own. This includes the outreach they conduct with schools and colleges, which needs to be joined up, well targeted towards the places and schools across the country that need most support, and tailored to the situation in different local areas. Delivered by Uni Connect – a national network of 29 local partnerships between universities, colleges, schools and local agencies – it creates pathways into further and higher education.
The OfS invests at sector level to improve the ways in which universities and colleges evaluate their access and participation work through a national ‘what works’ centre, the Centre for Transforming Access and Student Outcomes (TASO).43 We are also supporting innovative approaches to improving graduate opportunities in areas with lower productivity and growth, and new modes of flexible provision for mature students.
Universities and colleges in their communities
Higher education is well placed to help tackle the geographical inequalities identified in this brief. Many universities are involved in the running of local schools, basing outreach staff in them, and deliver programmes specifically focused on reducing attainment gaps. Universities and colleges train and retrain people to meet the needs of local labour markets and encourage entrepreneurship. They are often among the biggest landowners and employers in an area and their innovations and research can attract people and investment.44
Universities and colleges also contribute to the cultural capital of their area through public exhibitions, creative graduates, and engagement with local communities.45 The students universities attract to an area often stay and work after graduating, and further education colleges make a particularly important contribution to extending the benefits of higher education to towns and rural areas.46 A number of universities have also demonstrated their commitment to their local areas, individually and collectively, through civic agreements.47 The pandemic has shone a spotlight on the way in which higher education staff, students and facilities care for the local population.
Case study: The University of Oxford’s Oxplore – Raising Attainment in Schools project
The Oxplore – Raising Attainment in Schools (Oxplore-RAIS) project aims to support schools to close the attainment gaps between different student groups. The programme seeks to reduce ‘leaks’ in the attainment pipeline from primary through to the end of secondary education, and ultimately diversify the pool of potential applicants at university entry. The programme incorporates strategies to work with teachers and learners at primary and secondary to support raising attainment for bigger, mixed prior-attainment groups, and to address disadvantage that begins earlier in young people’s educational journeys.
Launched in May 2019, the Oxplore-RAIS collaboration aims to embed an evidence-informed approach to support raising achievement through school-wide enrichment. The University of Oxford’s Undergraduate Admissions and Outreach department works with an academy trust in the North West – The Challenge Academy Trust in Warrington, Cheshire. This trust is made up of four primary and five secondary schools, and one sixth form college.
The programme explores strategies for raising achievement in two areas of facilitating subjects – modern foreign languages, and science, technology, engineering and mathematics. It has a focus on learner and teacher outcomes, taking an ‘enrichment for all’ approach.
The collaboration consists of three streams:
- teachers’ continuous professional development and learning
- learner delivery days
- embedding enrichment in the classroom.
The success of the Oxplore-RAIS programme will be demonstrated by annual increases in the percentage of teachers reporting the positive impact of Oxplore-RAIS on student attainment, motivation and aspiration, and by significant increases in learners’ self-assessment ratings. The size of the programme increases year on year making the targets more demanding and its impact greater.
Part of the promise of getting a degree has long been the ability to ‘get out’ – to have the opportunity to move and be socially mobile – but this misrepresents most students’ experience. In 2014-15, 55.8 per cent attended a university less than 55 miles away from their home address. Only 10 per cent attend a university over 150 miles away from home.48
Many providers offer tailored support for commuter students. Recent research suggests that commuter students are less likely to build up a network with other students, access extracurricular and enhancement activities, or identify with their institution.49
Local graduates
To help effect change, the OfS has invested £5.6 million in funding to help create more opportunities for graduates who seek highly skilled employment in their home region, for example through curriculum interventions and internships. We are evaluating and sharing emerging practice from the programme on our local graduate webpages.50
This programme has continued despite the pandemic, including projects such as virtual career fairs in Bradford, reverse mentoring in the West Midlands, making networks between graduates and small and medium enterprises in Norfolk and Lincoln, virtual internships in the Tees Valley, and leadership courses in Leicester.51 One of the themes emerging from the programme is the way in which graduates have been able to work for employers based in other places, due to the shift to online working during the pandemic and hybrid modes as we emerge from it. If employers continue to change their expectations for time spent in the office, there is the potential for job opportunities and salaries in the most prosperous parts of England to be made available to graduates based throughout the country.
Case Study: Gateway to Growth, University of East Anglia
‘Gateway to Growth’ is an innovative project designed to unlock the talents of graduates and Norfolk’s small and medium enterprises. It provides additional support for graduates of the University of East Anglia who have decided to stay in the region but who are struggling to find the right opportunity for them.
The project aims to boost engagement between graduates and these enterprises, through enhanced skills training and internships linked to Norfolk’s Enterprise Hubs. The project addresses some of the problems faced by the economy of Norwich and Norfolk and the university’s graduates, many of whom want to remain in Norfolk after completing their studies but struggle to secure graduate-level employment.
The support provided includes tailored career advice and an internship programme linking graduates with local businesses. Through interlinked and interdependent schemes the project has developed an dedicated recruitment service for small and medium-sized enterprises (SMEs), which in recent months has seen increased numbers of Norfolk SME graduate opportunities advertised, a pilot innovation hub internship scheme, and enhanced professional support for finalists and graduates.52 Shifting some of the delivery online has enabled more graduates to participate in these activities, which include various skills development modules.
Since its inception the project has become the university’s Kickstart Gateway agency, which has proved to be successful. The Gateway to Growth project has now supported Norfolk SMEs to apply for 152 Kickstart placements, and several participants have been successful in securing a permanent full-time opportunity with the employer.
Mature students
During the last two decades, there have been diminishing opportunities to enter higher education at different times of life and through the more flexible routes needed by adult learners.53 In the next phase of the Uni Connect programme, we are expecting partnerships to strengthen the role of further education colleges to support pathways between further and higher education, including through apprenticeships, and to give greater focus to mature students.
The OfS is also conducting a trial of short courses. This will test demand from students and employers for the more flexible modes of learning that will be supported through the government’s proposed lifelong loan entitlement, with the aim of improving career prospects for individuals and the productivity of their employers.54
Case study: Engaging parents – Greater Manchester Higher
Greater Manchester Higher runs a project called Parent Power, in collaboration with Opportunity Area Oldham, the Women’s Chai Project (Oldham), and Trinity College, Cambridge. The project engages and empowers parents of high-achieving children from Oldham schools to make a positive change for their family’s future, building on a model developed by Kings College London and CitizensUK.
During the pandemic, lockdowns and school closures have meant that many of the families the project works with have had to balance home schooling with working from home. This highlighted that many did not have adequate access to technology. By partnering with Trinity College, Parent Power was able to secure funding for laptops. This enabled parents to engage in more virtual meetings and support their children with home schooling, as well as developing a Parent Power podcast which is now into its second season.55
Podcast episodes produced by and for parents seek to break down perceived barriers to studying at leading universities and provide information and guidance about applying. One positive outcome of the project is that some of the parents involved have gone on to higher and further education themselves. This suggests that intergenerational outreach can support promoting higher education opportunities to parents as potential adult learners.
The case for change
If the patterns of place-based inequalities that affect university access and graduate employment described in this briefing are to be challenged, universities and colleges need to improve the pathways into higher education for young people in the places where participation is lowest. This means building on and strengthening their partnerships with schools, tackling the academic, financial and cultural barriers to progression in their local areas, and delivering on the commitments in their access and participation plans.
Given the scale of the challenge, however, the focus must not be on improving access for young people alone. The examples in this brief show that, by working with employers, community groups and local agencies, and bridging the gap between further and higher education, universities and colleges can improve job prospects for graduates in their local area, enable people to study while caring and working, and truly unlock their potential. ‘Levelling up’ higher education will require an opening up of the opportunities to study throughout life.
Note: This page and PDF download were updated on 10 May 2022 to correct references to the Lifelong Loan Entitlement.
1 In this brief, for the sake of readability, we have used ‘universities and colleges’, or sometimes simply ‘universities’, to refer to what our regulatory framework and other more formal documents call ‘higher education providers’.
2 Donnelly, Michael, and Sol Gamsu, ‘Home and away: Social, ethnic and spatial inequalities in student mobility’, The Sutton Trust, 2018 (available at https://dro.dur.ac.uk/27367/), p4.
3 Office for National Statistics, ‘Regional gross domestic product: All ITL regions’, May 2021 (https://www.ons.gov.uk/economy/grossdomesticproductgdp/datasets/regionalgrossdomesticproductallnutslevelregions); Agrawal, Sarthak and David Phillips, ‘Catching up or falling behind? Geographical inequalities in the UK and how they have changed in recent years’, August 2020 (available at https://ifs.org.uk/inequality/geographical-inequalities-in-the-uk/), pp8-9.
4 Graduate labour market statistics, https://explore-education-statistics.service.gov.uk/data-tables/permalink/93af906b-02f3-4a39-8afa-459cf3631255.
5 Marmot, Michael, Jessica Allen, Tammy Boyce, Peter Goldblatt and Joana Morrison. ‘Marmot Review 10 years on’, February 2020 (available at https://www.instituteofhealthequity.org/resources-reports/marmot-review-10-years-on), p18.
6 Agrawal, Sarthak, and David Phillips, ‘Catching up or falling behind? Geographical inequalities in the UK and how they have changed in recent years’, August 2020 (available at https://ifs.org.uk/inequality/geographical-inequalities-in-the-uk/), pp20-21.
7 Hirsch, Donald and Stone, Juliet, ‘Local indicators of child poverty after housing costs, 2018-19’, October 2020 (available at https://repository.lboro.ac.uk/articles/report/Local_indicators_of_child_poverty_after_housing_costs_2018_19_Summary_of_estimates_of_child_poverty_after_housing_costs_in_local_authorities_and_parliamentary_constituencies_2014_15_2018_19/13169510), p5.
8 Social Market Foundation, ‘Commission on Inequality in Education’, July 2017 (available at https://www.smf.co.uk/publications/commission-inequality-education/), p6.
9 Education Policy Institute, ‘Education in England: Annual report 2020’, August 2020 (available at https://epi.org.uk/publications-and-research/education-in-england-annual-report-2020/), pp 27, 30.
10 Ofqual, ‘Summer 2021 results analysis and quality assurance’, 20 August 2021, https://www.gov.uk/government/publications/analysis-of-results-a-levels-and-gcses-summer-2021/summer-2021-results-analysis-and-quality-assurance-a-level-and-gcse.
11 Foster, Brian, and Peter Norton, ‘Educational equality for Gypsy, Roma and Traveller children and young people in the UK’, 2012 (available at https://lx.iriss.org.uk/content/educational-equality-gypsy-roma-and-traveller-children-and-young-people-uk), pp98-99; OfS, ‘Children from military families (www.officeforstudents.org.uk/advice-and-guidance/promoting-equal-opportunities/effective-practice/children-from-military-families/).
12 Sanderson, Michael, ‘Education and economic decline in Britain, 1870 to the 1990s’, 1999, pp74-91; Henderson, Holly, ‘Place and student subjectivities in higher education “cold spots”’, British Journal of Sociology of Education, 2019.
13 OfS, ‘English higher education 2019: The Office for Students annual review’, December 2019 (available at www.officeforstudents.org.uk/annual-review-2019/), p30.
14 Institute for Fiscal Studies, ‘The IFS Deaton review of inequalities: a New Year’s message’, January 2021, https://ifs.org.uk/inequality/the-ifs-deaton-review-of-inequalities-a-new-years-message/.
15 Duffy, Bobby, Kirstie Hewlett, Rachel Hesketh, Rebecca Benson and Alan Wager, ‘Unequal Britain Attitudes to inequalities after Covid-19’, February 2021 (available at https://www.kcl.ac.uk/policy-institute/research-analysis/unequal-britain), pp14-15.
16 House of Commons Library, ‘The levelling up agenda’, June 2021 (available at https://commonslibrary.parliament.uk/research-briefings/cdp-2021-0086/); Committees, ‘Left behind white pupils from disadvantaged backgrounds’, October 2021 (https://committees.parliament.uk/work/237/left-behind-white-pupils-from-disadvantaged-backgrounds/publications/reports-responses/).
17 Department for Education (DfE), ‘Skills for jobs: Lifelong learning for opportunity and growth’, January 2021 (available at https://www.gov.uk/government/publications/skills-for-jobs-lifelong-learning-for-opportunity-and-growth).
18 David Melville, ‘Universities are essential in our aim to reduce regional disparities and level up regional prosperity throughout the UK ‘, June 2021 https://www.hepi.ac.uk/2021/06/25/universities-are-essential-in-our-aim-to-reduce-regional-disparities-and-level-up-regional-prosperity-throughout-the-uk/.
19 OfS, ‘TUNDRA access by region’, November 2021, available to download above.
20 The dataset in Figure 1 includes information on the number and proportion of Key Stage 4 pupils aged 16 in the summer of the academic years 2012-13 to 2015-16 in state-funded mainstream schools in England who participate in higher education two to three years later, for each region. This is the same underlying population and methodology as TUNDRA.
21 DfE, ‘Key stage 4 performance’, February 2021 (https://explore-education-statistics.service.gov.uk/find-statistics/key-stage-4-performance-revised/2019-20), Map 1.
22 Boswell, John, John Denham, Jamie Furlong, Anna Killick, Patricia Ndugga, Beata Rek, Matthew Ryan and Jesse Shipp, ‘Place-based politics and nested deprivation in the UK: Beyond cities-towns, “Two Englands” and the “Left Behind”’, 2020 (available at https://www.tandfonline.com/doi/full/10.1080/00344893.2020.1751258).
23 TUNDRA, MSOA quintile (www.officeforstudents.org.uk/data-and-analysis/young-participation-by-area/get-the-area-based-measures-data/).
24 Social Market Foundation, ‘The “North” is everywhere: Why we shouldn’t divide the country in two’, February 2020 (https://www.smf.co.uk/commentary_podcasts/the-north-is-everywhere/).
25 TUNDRA, MSOA quintile (www.officeforstudents.org.uk/data-and-analysis/young-participation-by-area/get-the-area-based-measures-data/).
26 OfS, ‘White students who are left behind: The importance of place;’ January 2021, www.officeforstudents.org.uk/news-blog-and-events/blog/white-students-who-are-left-behind-the-importance-of-place/.
27 OfS, ‘Associations between characteristics of students‘ (https://www.officeforstudents.org.uk/data-and-analysis/associations-between-characteristics-of-students/).
28 Committees, ‘Government response to Education Committee report “The forgotten: How white working-class pupils have been let down, and how to change it”’, October 2021 (https://committees.parliament.uk/work/237/left-behind-white-pupils-from-disadvantaged-backgrounds/publications/reports-responses/).
29 OfS, ‘Official statistic: Key performance measure 1’ (www.officeforstudents.org.uk/about/measures-of-our-success/participation-performance-measures/gap-in-participation-between-most-and-least-represented-groups/); OfS, ‘Official statistic: Key performance measure 2’ (www.officeforstudents.org.uk/about/measures-of-our-success/participation-performance-measures/gap-in-participation-at-higher-tariff-providers-between-the-most-and-least-represented-groups/). Universities are grouped into higher, medium and lower tariffs when ranked by average tariff score of UK-domiciled undergraduate entrants, defined using Higher Education Statistics Agency data from academic years 2012-13 to 2014-15.
30 OfS, ‘OfS analysis of UCAS-placed applicants by POLAR4 28 days after the Joint Council for Qualifications results day’, September 2021 (available at www.officeforstudents.org.uk/data-and-analysis/young-participation-by-area/get-the-area-based-measures-data/).
31 Houston, Donald, ‘The unevenness in the local economic impact of COVID-19 presents a serious challenge to the government’s “levelling up” agenda’, November 2020 (https://blogs.lse.ac.uk/politicsandpolicy/local-economic-impact-covid19/).
32 London School of Economics British Politics and Policy, ‘Mapping and addressing COVID-19 regional inequalities using real-time spending data’, January 2021 (https://blogs.lse.ac.uk/politicsandpolicy/covid-regional-inequalities-spending-data/).
33 OfS, ‘A geography of employment and earnings: Autumn 2021’, November 2021 (available at www.officeforstudents.org.uk/publications/a-geography-of-employment-and-earnings/), p9.
34 OfS, ‘A geography of employment and earnings: Autumn 2021’, November 2021 (available at www.officeforstudents.org.uk/publications/a-geography-of-employment-and-earnings/), p18.
35 The proportion of graduates in well paid jobs refers to the proportion earning over the national average for 25- to 29-year-olds (around £23,000) or in higher level study.
36 OfS, ‘A geography of employment and earnings: Report ‘. June 2021 (available at www.officeforstudents.org.uk/publications/a-geography-of-employment-and-earnings/) , p4.
37 Donnelly, Michael and Sol Gamsu, ‘Home and away: Social, ethnic and spatial inequalities in student mobility', The Sutton Trust, 2018 (available at https://dro.dur.ac.uk/27367/), p21.
38 Goddard, Johan, and Paul Vallance, ‘The university and the city’, 2013, p30.
39 DfE, ‘Graduate outcomes (LEO)’. March 2021 (available at https://explore-education-statistics.service.gov.uk/find-statistics/graduate-outcomes-leo/2018-19).
40 Donnelly, Michael, and Sol Gamsu, ‘Home and away: Social, ethnic and spatial inequalities in student mobility', The Sutton Trust, 2018 (available at https://dro.dur.ac.uk/27367/), p14.
41 DfE, ‘Graduate outcomes (LEO)’. March 2021 (available at https://explore-education-statistics.service.gov.uk/find-statistics/graduate-outcomes-leo/2018-19). Research has shown that the majority of students with missing values for free school meals attend fee-paying schools (Gorard, Stephen, ‘Who is eligible for free school meals? Characterising free school meals as a measure of disadvantage in England’, British Educational Research Journal, January 2013, https://bera-journals.onlinelibrary.wiley.com/doi/full/10.1080/01411926.2011.608118).
42 OfS, ‘Transforming opportunity in higher education’, January 2020 (available at www.officeforstudents.org.uk/publications/transforming-opportunity-in-higher-education/).
43 Transforming access and student outcomes in higher education (https://taso.org.uk/).
44 Industrial Strategy Council, ‘Universities and Colleges and the Industrial Strategy: Exploring data on knowledge exchange, research and skills’, September 2020 (available at https://industrialstrategycouncil.org/universities-and-colleges-and-industrial-strategy-exploring-data-knowledge-exchange-research-and), pp5-7.
45 Goddard, John and Paul Vallance, ‘The university and the city’, 2013, pp127-46.
46 Universities UK, ‘The economic impact of international students’, March 2017 (available at https://www.universitiesuk.ac.uk/topics/international/international-staff-and-students/economic-impact-international-students).
47 Civic University Network, ‘Civic agreements’, https://civicuniversitynetwork.co.uk/civic-agreements/.
48 Donnelly, Michael and Sol Gamsu, ‘Home and away: Social, ethnic and spatial inequalities in student mobility.', The Sutton Trust, 2018 (available at https://dro.dur.ac.uk/27367/), p4.
49 London Higher, ‘Commuter students in London: Overview of project findings’, August 2019 [no longer available online].
50 OfS, ‘Improving outcomes for local graduates’, February 2020, www.officeforstudents.org.uk/advice-and-guidance/skills-and-employment/improving-outcomes-for-local-graduates/.
51 OfS, ‘Improving outcomes for local graduates’, March 2021, www.officeforstudents.org.uk/advice-and-guidance/skills-and-employment/improving-outcomes-for-local-graduates/local-graduates-case-studies/
52 Gateway to Growth, ‘Internship Hub’, https://www.uea.ac.uk/about/gateway-to-growth/internship-hub
53 OfS, ‘Improving opportunity and choice for mature students’, May 2021.
54 OfS, ‘Higher education short course trial’, July 2021, www.officeforstudents.org.uk/advice-and-guidance/skills-and-employment/higher-education-short-course-trial/.
55 ‘Parent power podcast’, https://soundcloud.com/user-268471362 .
Describe your experience of using this website