Differences in student outcomes
How do student outcomes vary by sex?
 This data was published more than five years ago.
This analysis has been retained for context, but might not reflect our current regulatory activity. Data and analysis used in our current regulation, which might include more recent data on this topic, is available in our data and analysis index.
Degree outcomes
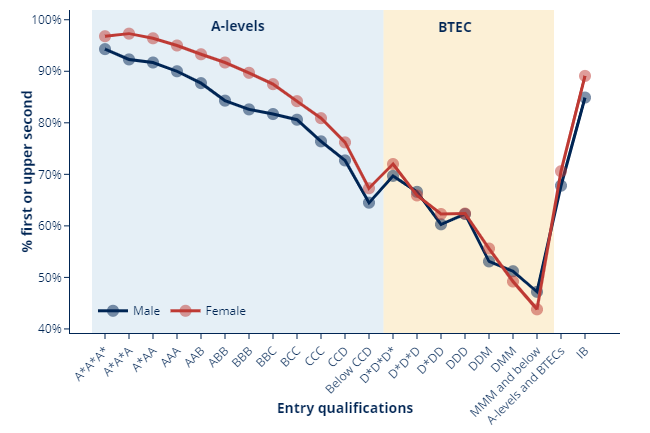
There is a five percentage point difference between the proportion of female graduates getting a first or upper second class degree (81 per cent) and the proportion of male graduates (76 per cent). This has remained the same since 2013-14.
The proportion of male graduates gaining a first or upper second is lower regardless of their A-level entry qualifications, with differences ranging from three percentage points for graduates with A*A*A* to seven percentage points for graduates with AAB.
However, this is not the case for graduates who enter with BTECs. While the rate for female graduates is three percentage points higher when they enter with grades DDM, it is three percentage points lower at grades MMM and below.
Other factors
The proportion of graduates gaining a first or upper second class degree has been modelled to see whether the difference observed between male and female students is explained by factors beyond entry qualifications. The model takes account of institutional differences, course type differences and differences in other student characteristics such as ethnicity, disability and educational disadvantage.
Once observable characteristics have been taken into account, the gap (or unexplained difference) increased from 4.7 percentage points to 5.1 percentage points. The remaining variation is due to unobservable factors. This shows that the gap between male graduates and female graduates is slightly larger once other factors are taken into account.
| First or upper second class degree | Reference (female) | Observed difference | Unexplained difference | |
|---|---|---|---|---|
| Female | 81.0% | 81.0% | - | - |
| Male | 76.3% | 81.0% | -4.7pp | -5.1pp |
Employment outcomes
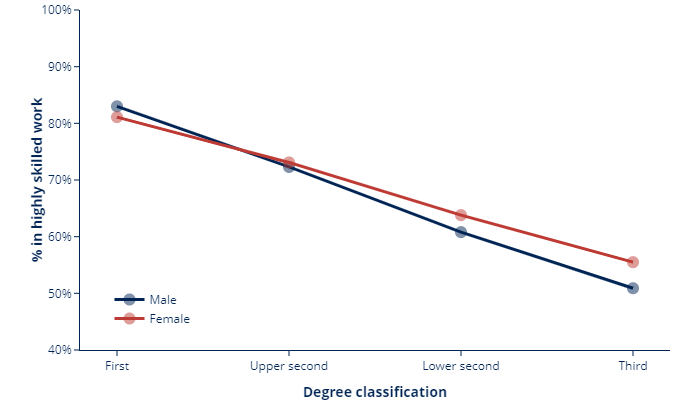
Among female graduates, 73 per cent are in highly skilled employment or study compared with 72 per cent of male graduates. This gap has increased slightly from 0.2 percentage points in 2013-14 to 1.0 percentage points in 2015-16.
This difference is not consistent when degree classification is taken into account. Those male graduates gaining a first class degree are 1.8 percentage points more likely to be in highly skilled employment or further study than female graduates. However, for all other degree classifications, a higher proportion of female graduates are in highly skilled employment or further study.
The proportion in highly skilled employment or further study six months after graduation was modelled in a similar way to the degree outcomes model, using additional information on degree classification and region of institution.
Once these differences were modelled, the gap between male graduates and female graduates decreased. The outcomes for male graduates changed from being from 1.1 percentage points lower than female graduates to 0.2 percentage points higher than expected when other factors are taken into consideration.
Therefore most of the difference between employment outcomes of male and female graduates is explained by the factors considered in this model.
| In highly skilled employment or further study | Reference (female) | Observed difference | Unexplained difference | |
|---|---|---|---|---|
| Female | 73.6% | 73.6% | - | - |
| Male | 72.5% | 73.6% | -1.1pp | +0.2pp |
Get the data
Last updated 22 December 2021 + show all updates
22 December 2021 - Charts replaced by static images
Describe your experience of using this website