Differences in student outcomes
How do student outcomes vary by ethnicity?
 This data was published more than five years ago.
This analysis has been retained for context, but might not reflect our current regulatory activity. Data and analysis used in our current regulation, which might include more recent data on this topic, is available in our data and analysis index.
Degree outcomes
White graduates had the highest proportion gaining a first or upper second class degree, with 82 per cent. The group with the lowest proportion was black graduates, with only 60 per cent. For Asian graduates, the proportion gaining a first or upper second class degree was 72 per cent.
The difference between the proportions of white and black graduates has decreased slightly from 23 percentage points in 2013-14 to 22 percentage points in 2016-17. The difference between proportions of white and Asian graduates has reduced from at 12 percentage points in 2013-14 to 11 percentage points in 2016-17.
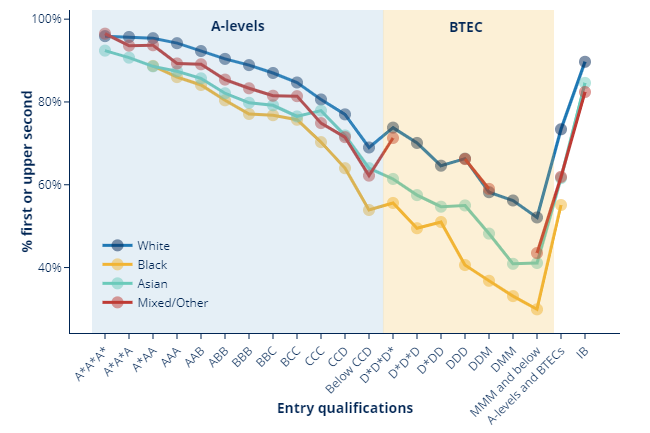
White graduates range from seven percentage points higher than black graduates for graduates with A*AA at A-level, to 26 percentage points higher for BTEC DMM. The gap between white and black graduates increases for lower A-level grades and BTEC grades.
The proportions gaining such degrees among white graduates are also between three and 15 percentage points higher than among Asian graduates. The gaps between these graduates are much wider for BTEC entry than for A-level entry.
The difference is 10 percentage points for Asian graduates compared with 17 percentage points in black graduates, once other factors are accounted for. Therefore, the additional factors explain some, but not all, of the difference between these groups.
| First or upper second class degree | Reference (white) | Observed difference | Unexplained difference |
|
| White | 82.2% | 82.2% | - | - |
| Black | 60.4% | 82.2% | -21.8pp | -17.3pp |
| Asian | 71.7% | 82.2% | -10.5pp | -9.5pp |
| Mixed | 75.4% | 82.2% | -6.8pp | -6.2pp |
Employment outcomes
Black graduates have a 69 per cent highly skilled employment or further study rate. The group with the highest employment rate into highly skilled jobs is white graduates at 74 per cent. This gap has decreased from seven percentage points in 2013-14 to five percentage points in 2015-16.
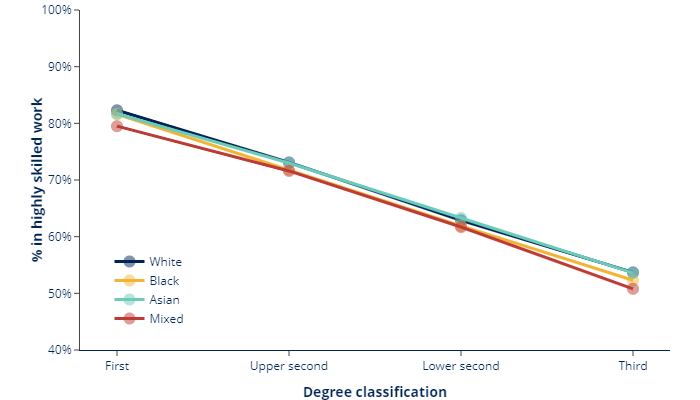
White graduates and Asian graduates display similar proportions over all degree classifications, and therefore degree classification accounts for much of the differences between these groups. Among black graduates, the differences are reduced to around one percentage point for all degree classifications, meaning that degree classification also accounts for a lot of these differences.
Black graduates have the smallest difference between the actual value and their expected proportion, at one percentage point, while Asian graduates have a two percentage point difference. Therefore, most of the difference between black and white graduates is explained by the factors in the model. However, only some of the differences between Asian graduates and white graduates are explained by all of these additional factors in the model.
| Ethnicity | In highly skilled employment or further study | Reference (white) | Observed difference | Unexplained difference |
| White | 73.8% | 73.8% | - | - |
| Black | 68.7% | 73.8% | -5.1pp | -0.9pp |
| Asian | 71.6% | 73.8% | -2.2pp | -1.9pp |
| Mixed | 70.6% | 73.8% | -3.2pp | -1.3pp |
Get the data
Last updated 22 December 2021 + show all updates
22 December 2021 - Charts replaced by static images
Describe your experience of using this website