Differences in student outcomes
How do student outcomes vary by age?
 This data was published more than five years ago.
This analysis has been retained for context, but might not reflect our current regulatory activity. Data and analysis used in our current regulation, which might include more recent data on this topic, is available in our data and analysis index.
Degree outcomes
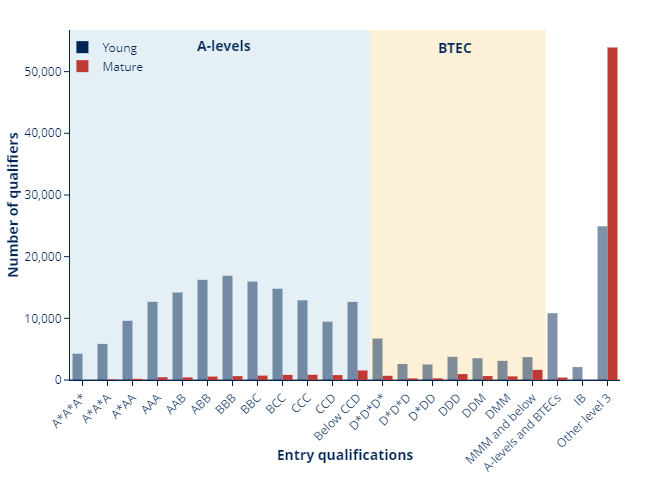
The distribution of entry qualifications differs for young and mature graduates.
A large proportion of young graduates enter with Level 3 qualifications, such as A-levels, BTECs and IBs, whereas mature graduates mostly enter with other types of Level 3 qualifications.
For 2016-17 graduates, the proportion of young graduates who gain a first or upper second class degree is 79 per cent. This compares with 67 per cent of mature graduates. This difference has increased slightly since 2013-14, which had corresponding figures of 75 per cent for young graduates and 64 per cent for mature graduates.
There are differences between the proportion of young and mature graduates gaining a first or upper second class degree that are not just due to the entry qualifications of the graduates.

Employment outcomes
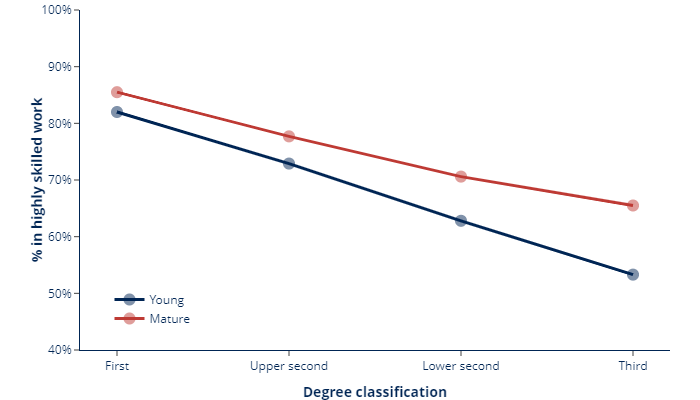
A higher proportion of mature graduates (77 per cent) are in highly skilled employment or further study than young graduates (73 per cent). This difference has remained at around four percentage points between 2013-14 and 2015-16.
The highly skilled employment rate is higher for mature graduates than for young graduates once the differences in degree classification are taken into account. The difference between young and mature graduates increases for lower degree classifications. The proportion of mature graduates in highly skilled employment or further study was three percentage points higher than for young graduates with a first class degree. This increases to 12 percentage points for those who graduate with a third class degree.
Summary
Young graduates have a higher proportion than mature graduates gaining a first or upper second class degree but direct comparison is difficult as the groups have very different entry profiles.
Mature graduates have a higher proportion in highly skilled employment or further study. This could be related to factors beyond those considered in this employment, such as prior employment.
Because of the differences between young and mature graduates - in terms of both entry qualifications and employment outcomes - the other student characteristics will only consider young graduates.
Get the data
Last updated 22 December 2021 + show all updates
22 December 2021 - Charts replaced by static images
Describe your experience of using this website