Differences in student outcomes
How do student outcomes vary by educational disadvantage?
 This data was published more than five years ago.
This analysis has been retained for context, but might not reflect our current regulatory activity. Data and analysis used in our current regulation, which might include more recent data on this topic, is available in our data and analysis index.
Degree outcomes
There is a range of degree outcomes across the educational disadvantage quintiles. Graduates from quintile 1 the (lowest participation quintile) have the lowest proportion gaining a first or upper second class degree, 73 per cent of graduates, compared with 83 per cent of graduates from quintile 5 (the highest participation quintile).
| First or upper second class degree | |
| Quintile 1 | 73% |
| Quintile 2 | 76% |
| Quintile 3 | 78% |
| Quintile 4 | 79% |
| Quintile 5 | 83% |
The gap between quintile 1 and quintile 5 has remained at 10 percentage points since 2013-14. The gaps between all other quintiles have also remained comparatively stable over this time.
Once entry qualifications have been taken into account, the difference between quintile 1 and quintile 5 graduates who enter with A-levels ranges from two percentage points higher, for graduates with ABB, to four percentage points lower for those entering with grades below CCD.
Among graduates with BTECs, the gap is wider ranging, from zero for graduates with MMM and below, to eight percentage points for quintile 5 graduates entering with D*D*D.
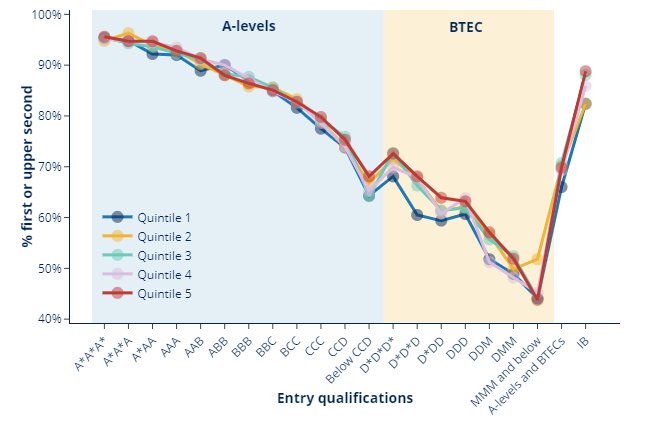
Once the other factors are taken into account, the unexplained difference between quintile 1 and quintile 5 has reduced to two percentage points. It can be seen that a lot of this decrease in difference is explained by entry qualifications.
| Gaining first or upper second class degree | Reference (quintile 1) | Observed difference | Unexplained difference | |
|---|---|---|---|---|
| Quintile 1 | 72.9% | 72.9% | - | - |
| Quintile 2 | 76.2% | 72.9% | +3.3pp | +1.7pp |
| Quintile 3 | 77.7% | 72.9% | +4.8pp | +2.2pp |
| Quintile 4 | 78.8% | 72.9% | +5.9pp | +2.5pp |
| Quintile 5 | 83.0% | 72.9% | +10.1pp | +2.3pp |
Employment outcomes
Quintile 1 graduates have the lowest percentage in highly skilled employment while those in quintile 5 have the highest proportion in highly skilled employment or further study.
| In highly skilled employment or further study | |
| Quintile 1 | 71% |
| Quintile 2 | 72% |
| Quintile 3 | 73% |
| Quintile 4 | 73% |
| Quintile 5 | 75% |
The gap between quintile 1 and quintile 5 graduates for highly skilled employment has decreased from six percentage points in 2013-14 to four percentage points in 2015-16.
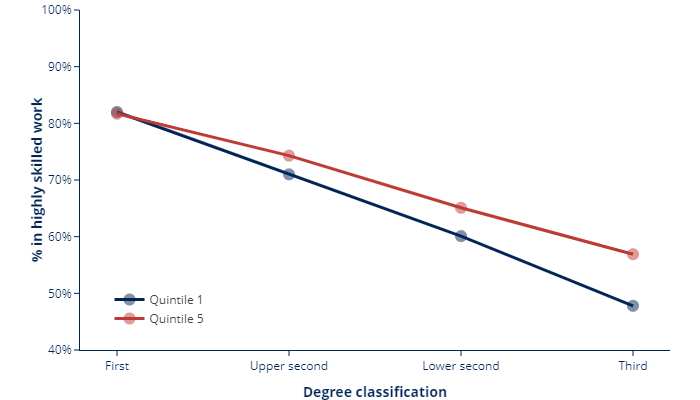
The trends are different across degree classifications. There is little difference for graduates with a first class degree, but the difference is nine percentage points for those with a third class degree. Therefore, class of degree is not the only factor affecting the difference between these rates.
Accounting for the additional factors explains some of the difference between the quintiles. The difference between quintiles 1 and 5 decreases from three percentage points to one percentage point.
| In graduate employment or further study | Reference (quintile 1) | Observed difference | Unexplained difference | |
|---|---|---|---|---|
| Quintile 1 | 70.5% | 70.5% | - | - |
| Quintile 2 | 72.2% | 70.5% | +1.7pp | +0.9pp |
| Quintile 3 | 72.6% | 70.5% | +2.1pp | +0.8pp |
| Quintile 4 | 72.8% | 70.5% | +2.3pp | +0.8pp |
| Quintile 5 | 74.7% | 70.5% | +4.2pp | +0.9pp |
Get the data
Last updated 22 December 2021 + show all updates
22 December 2021 - Charts replaced by static images
Describe your experience of using this website