Meeting the mental health needs of students
For a minority of students, mental health conditions have a negative impact on outcomes at university or college. This Insight brief discusses some of the issues, with reference to the most recent available data. It looks at the likelihood of students reporting mental health conditions in terms of various characteristics (age, sex, ethnicity, eligibility for free school meals when at school and area-based measures of deprivation and participation), and how these conditions affect outcomes in terms of continuation, completion, attainment and progression. It also looks at how the OfS is continuing to work with universities and colleges to address these negative impacts. It does not constitute regulatory or legal advice.
- Date:
- 19 October 2023
Read the brief
Download the Insight brief as a PDF
Get the data
Download the Insight brief data
Read the Insight brief online
Introduction and background
There are many benefits to attending university or college, and many thousands of students have positive experiences of higher education each year.1 The OfS’s key performance measures show that the majority are able to complete their courses and progress to positive outcomes after qualifying, with most giving positive answers to questions in the National Student Survey about the quality of their courses.2
For the small minority of students who report a mental health condition to their university or college, poor mental health can have a negative impact on their ability to participate in and complete higher education courses. Some groups may be more likely to be affected by poor mental health, or may experience particular barriers to accessing appropriate support.3 It is important that all students, whatever their background, are able to access the mental health support and information they need.
In recent years, the coronavirus pandemic and rises in the cost of living have had a negative effect on some students’ wellbeing.4 However, there has also been a lot of positive work to address mental health in universities and colleges. There are many case studies of innovative and creative mental health related projects led by universities and colleges published on the Office for Students (OfS) website.5
The University Mental Health Charter was published in 2019, and was part-funded by the OfS. It was created by the charity Student Minds in partnership with universities, staff and students. Its framework sets out good practice principles and advocates a whole-university approach.6 This builds on and aligns with Universities UK’s ‘Stepchange: Mentally healthy universities’ framework.7 The website ‘Student Space’ (led by Student Minds, part-funded by the OfS) was launched in August 2020 in response to the negative mental health impact of the pandemic.8 It continues to offer a range of expert online support and wellbeing advice for students.
The findings of a 2022 Department for Education survey of universities and colleges suggest that they are taking a more strategic approach to addressing students’ mental health. The survey found that only 3 per cent of the institutions responding had no mental health strategy and no current plans to create one, in contrast with 9 per cent in a previous survey in 2019.9 The 2023 National Student Survey found that 75.9 per cent of students studying in England responded positively to how well information on their university or college’s mental wellbeing services was communicated.10
The OfS has a strategic goal that universities and colleges encourage and support an environment conducive to the good mental health and wellbeing that students need to succeed in their higher education.11 Our Equality of Opportunity Risk Register recognises that a failure to encourage and support such an environment is a risk to equality of opportunity for all students.12 We want all students to be in an educational environment where they have access to strong academic and pastoral support. We have not imposed binding regulatory requirements for universities and colleges relating to mental health among students; rather, we are working to support, promote and fund the positive work that is already taking place in the sector.
OfS Insight brief #5, ‘Mental health: Are all students being properly supported?’ (published in 2019), included data analysis on reported mental health conditions and outcomes for different student groups.13 The findings contributed to the development of a Mental Health Funding Competition for higher education providers, which funded 18 projects providing targeted support for mental health.14 As these projects draw to an end, we are publishing this new Insight brief to re-examine the issue of mental health among students. It is one of the tools we are using to present data on mental health, summarise our work in this area and indicate our next steps. We share our new analysis of the latest student outcomes data for those who have reported a mental health condition to their university or college. We aim to highlight the impact of poor mental health for different student groups and encourage those working on this issue in higher education to use evidence-based interventions, targeted for their student populations.
We work with two definitions of poor mental health in this brief. The new data analysis is based on a narrow definition of poor mental health, namely a health condition or disability reported by the student to their university or college that has a substantial impact on that student’s ability to carry out day-to-day activities and has lasted, or is expected to last, at least 12 months. On the other hand, in describing the mental health related work of the OfS, universities and colleges, and other organisations, we are using a definition that covers a broader range of experiences, including clinically diagnosable mental health conditions and mental distress that has not been linked to a diagnosis.
Mental Health Funding Competition: Using innovation and intersectional approaches to target mental health support for students
With investment from the Department for Education and the Department of Health and Social Care, the OfS awarded more than £3 million in funding in 2021 for 18 mental health projects in universities and colleges. The two priorities of the funding competition were that projects should target:
- particular groups of students with characteristics identified as increasing the risk of poor mental health
- groups of students who might experience barriers to accessing support due to their course, mode of study, or other characteristics.15
An interim evaluation report was published in 2022 and focused on student co-creation in the first stage of the programme. It found that the funded projects had succeeded in reaching high numbers of students from groups who are typically underrepresented in the use of support services or face barriers in accessing support at university or college. Students from the target groups involved in co-creation initiatives valued being able to explore these issues in ‘closed spaces’ (only open to students from the relevant targeted group).
The evaluators also found that involvement in the co-creation of mental health initiatives was beneficial for both participating students from the target groups and the staff working in the universities and colleges involved. For participating students, it improved their mental health awareness, helped them feel more confident about accessing support, and promoted a sense of belonging. The co-creation work also helped improve staff knowledge of the barriers to accessing support.16
Independent evaluators are in the process of developing their final, programme-level evaluation report. We intend to publish this report in 2024.
The data
We have conducted new analysis of sector-wide data for students who have reported a mental health condition to their university or college and are studying in higher education in England. The analysis considers student characteristics in six key areas: age, sex, ethnicity, eligibility for free school meals when at school, Indices of Multiple Deprivation (IMD) and Tracking Underrepresentation by Area (TUNDRA) middle super output area (MSOA) quintiles.17 This research looks into the differences between groups of students within these characteristic areas who reported having a mental health condition as a disability and their peers who did not report a mental health condition. This expands on analyses included in the OfS ‘Student characteristics data’ publication.18 The full analysis report and data files are available on our website alongside this brief.19 A full description of the methodology is provided in this accompanying report.
In this brief, we focus on some of the key findings on continuation, completion and progression rates, with a particular focus on the findings where the data is disaggregated by sex, age, free school meal eligibility, IMD quintile, TUNDRA MSOA quintile, or ethnicity. Some important notes on the data should be borne in mind:
- The data in this brief relates to undergraduate students.
- Comparisons should not be made between the data presented in this brief and in Insight brief #5. This is because of differences in how the data was analysed. However, time series (with consistent analytical methods) are provided in the accompanying analysis report and data files, and some are referenced in this brief.
- Student populations for continuation and completion rates are defined by the year in which students started their course. For attainment and progression rates, they are defined by the year in which a course was completed. Since course lengths differ, this means that we cannot align, for example, a continuation cohort with an attainment cohort. Free school meals data is only available for entrants from 2014-15 onwards.20
- Disability information (including whether a student has a mental health condition) is recorded by universities and colleges when a student enters higher education. They are advised that this information should be updated annually to include new disclosures, but it is unclear whether this is a common practice.
- The suggested question on disability for student entrants asks about health conditions that have a substantial impact on students’ ability to carry out day-to-day activities and have lasted, or are expected to last, at least 12 months. Therefore this data specifically concerns mental health conditions that meet this definition of a disability, rather than poor mental health in broader terms or mental distress in general.
- The data draws on mental health conditions that are self-reported to universities and colleges, based on the students’ own assessments. Under-reporting, where students do not disclose mental health conditions to their university or college, may have affected the dataset. Similarly, an increase in the number of students reporting mental health conditions over time might reflect increased reporting, rather than increased prevalence. However, we do not have the evidence to state definitively the reasons behind any increase in numbers. Some student groups may face more barriers to declaring a mental health condition than others.21
- If students report having more than one disability, this is recorded as ‘multiple disabilities’. It is not possible to see whether these include a mental health condition.
- There are some groups that are not highlighted in this dataset, but other evidence suggests that they may be at increased risk of poor mental health or may face barriers in accessing mental health support. These include international students, students who are lesbian, gay, bisexual, transgender or of other minority sexualities or gender identities (LGBT+), students on placements as part of their course and postgraduate students.22
Increases in reporting
4.5 per cent of full-time students and 5.3 per cent of part-time students reported a mental health condition to their university or college when entering higher education in England in 2021-22.23 This is equivalent to 24,700 full-time students and 4,040 part-time students. There has been a broad trend of increased reporting of mental health conditions by students entering higher education, although they remain a small minority. For full-time undergraduate entrants this has increased from 0.7 per cent in 2010-11 to 4.5 per cent in 2021-22. The proportion of those reporting a mental health condition differs for different student groups, as discussed further in this brief.
The increase in students reporting a mental health condition mirrors evidence of increased prevalence in wider society. For example, the prevalence of moderate or severe depressive symptoms among adults in England, Scotland and Wales (measured by research participants’ depression scores on the Patient Health Questionnaire) rose after the start of the coronavirus pandemic in 2020. Although the proportion of adults with these symptoms had fallen between September and October 2022 (the latest period for which Office for National Statistics data is available), it is still above pre-pandemic levels.24 There is also evidence to suggest that universities and colleges have been seeing an increase in the complexity and severity of mental health cases in recent years.25
Outcomes for students with reported mental health conditions
Definitions of rates used in this brief
Continuation rate: The proportion of entrants who were continuing to study a higher education qualification (or who had gained a qualification) one year and 15 days after they started their course (two years and 15 days for part-time students).
Completion rate: The proportion of entrants who gained a higher education qualification (or were continuing in the study of a qualification) four years and 15 days after they started their course (six years and 15 days for part-time students).
Attainment rate: The proportion of undergraduate qualifiers who achieve a first or upper second class grade for their first degree.
Progression rate: The proportion of qualifiers who identify managerial or professional employment, further study, or other positive outcomes among the activities that they were undertaking at the Graduate Outcomes survey census date, 15 months after they left higher education.
Overall – looking at full-time undergraduate data, throughout the time series, and without disaggregating by student groups – there are differences in outcomes in continuation, completion, and progression rates between those students who reported having a mental health condition and those who did not. These are shown in Figures 1, 2 and 4.
Disaggregating by different student characteristics suggests that having a reported mental health condition affects specific student groups differently. This shows how important it is that universities and colleges collect data on, and respond to, the needs of different student groups.
Students’ experiences of having a mental health condition can negatively affect their ability to continue in, complete and successfully progress from higher education. However, attainment rates are an exception to this pattern (see Figure 3).
The latest year of data shows that full-time students with a reported mental health condition have a higher attainment rate overall than students without. This higher attainment rate is driven by data from students who are not from a white ethnic background. Across the time series, the attainment rate difference between students with a reported mental health condition and those without, whether positive or negative, has been close to zero and, generally, a lot smaller than the differences seen in continuation, completion and progression rates. Attainment rates in the latest year of data were also higher for students who reported having a mental health condition across most of the student characteristics analysed, compared with their peers who did not. The only exceptions to this are students with mixed, white and other ethnicities, although the differences are very small (0.2, 0.3 and 1.4 percentage points respectively).
Figure 1: Continuation rates of full-time students who did and did not report having a mental health condition
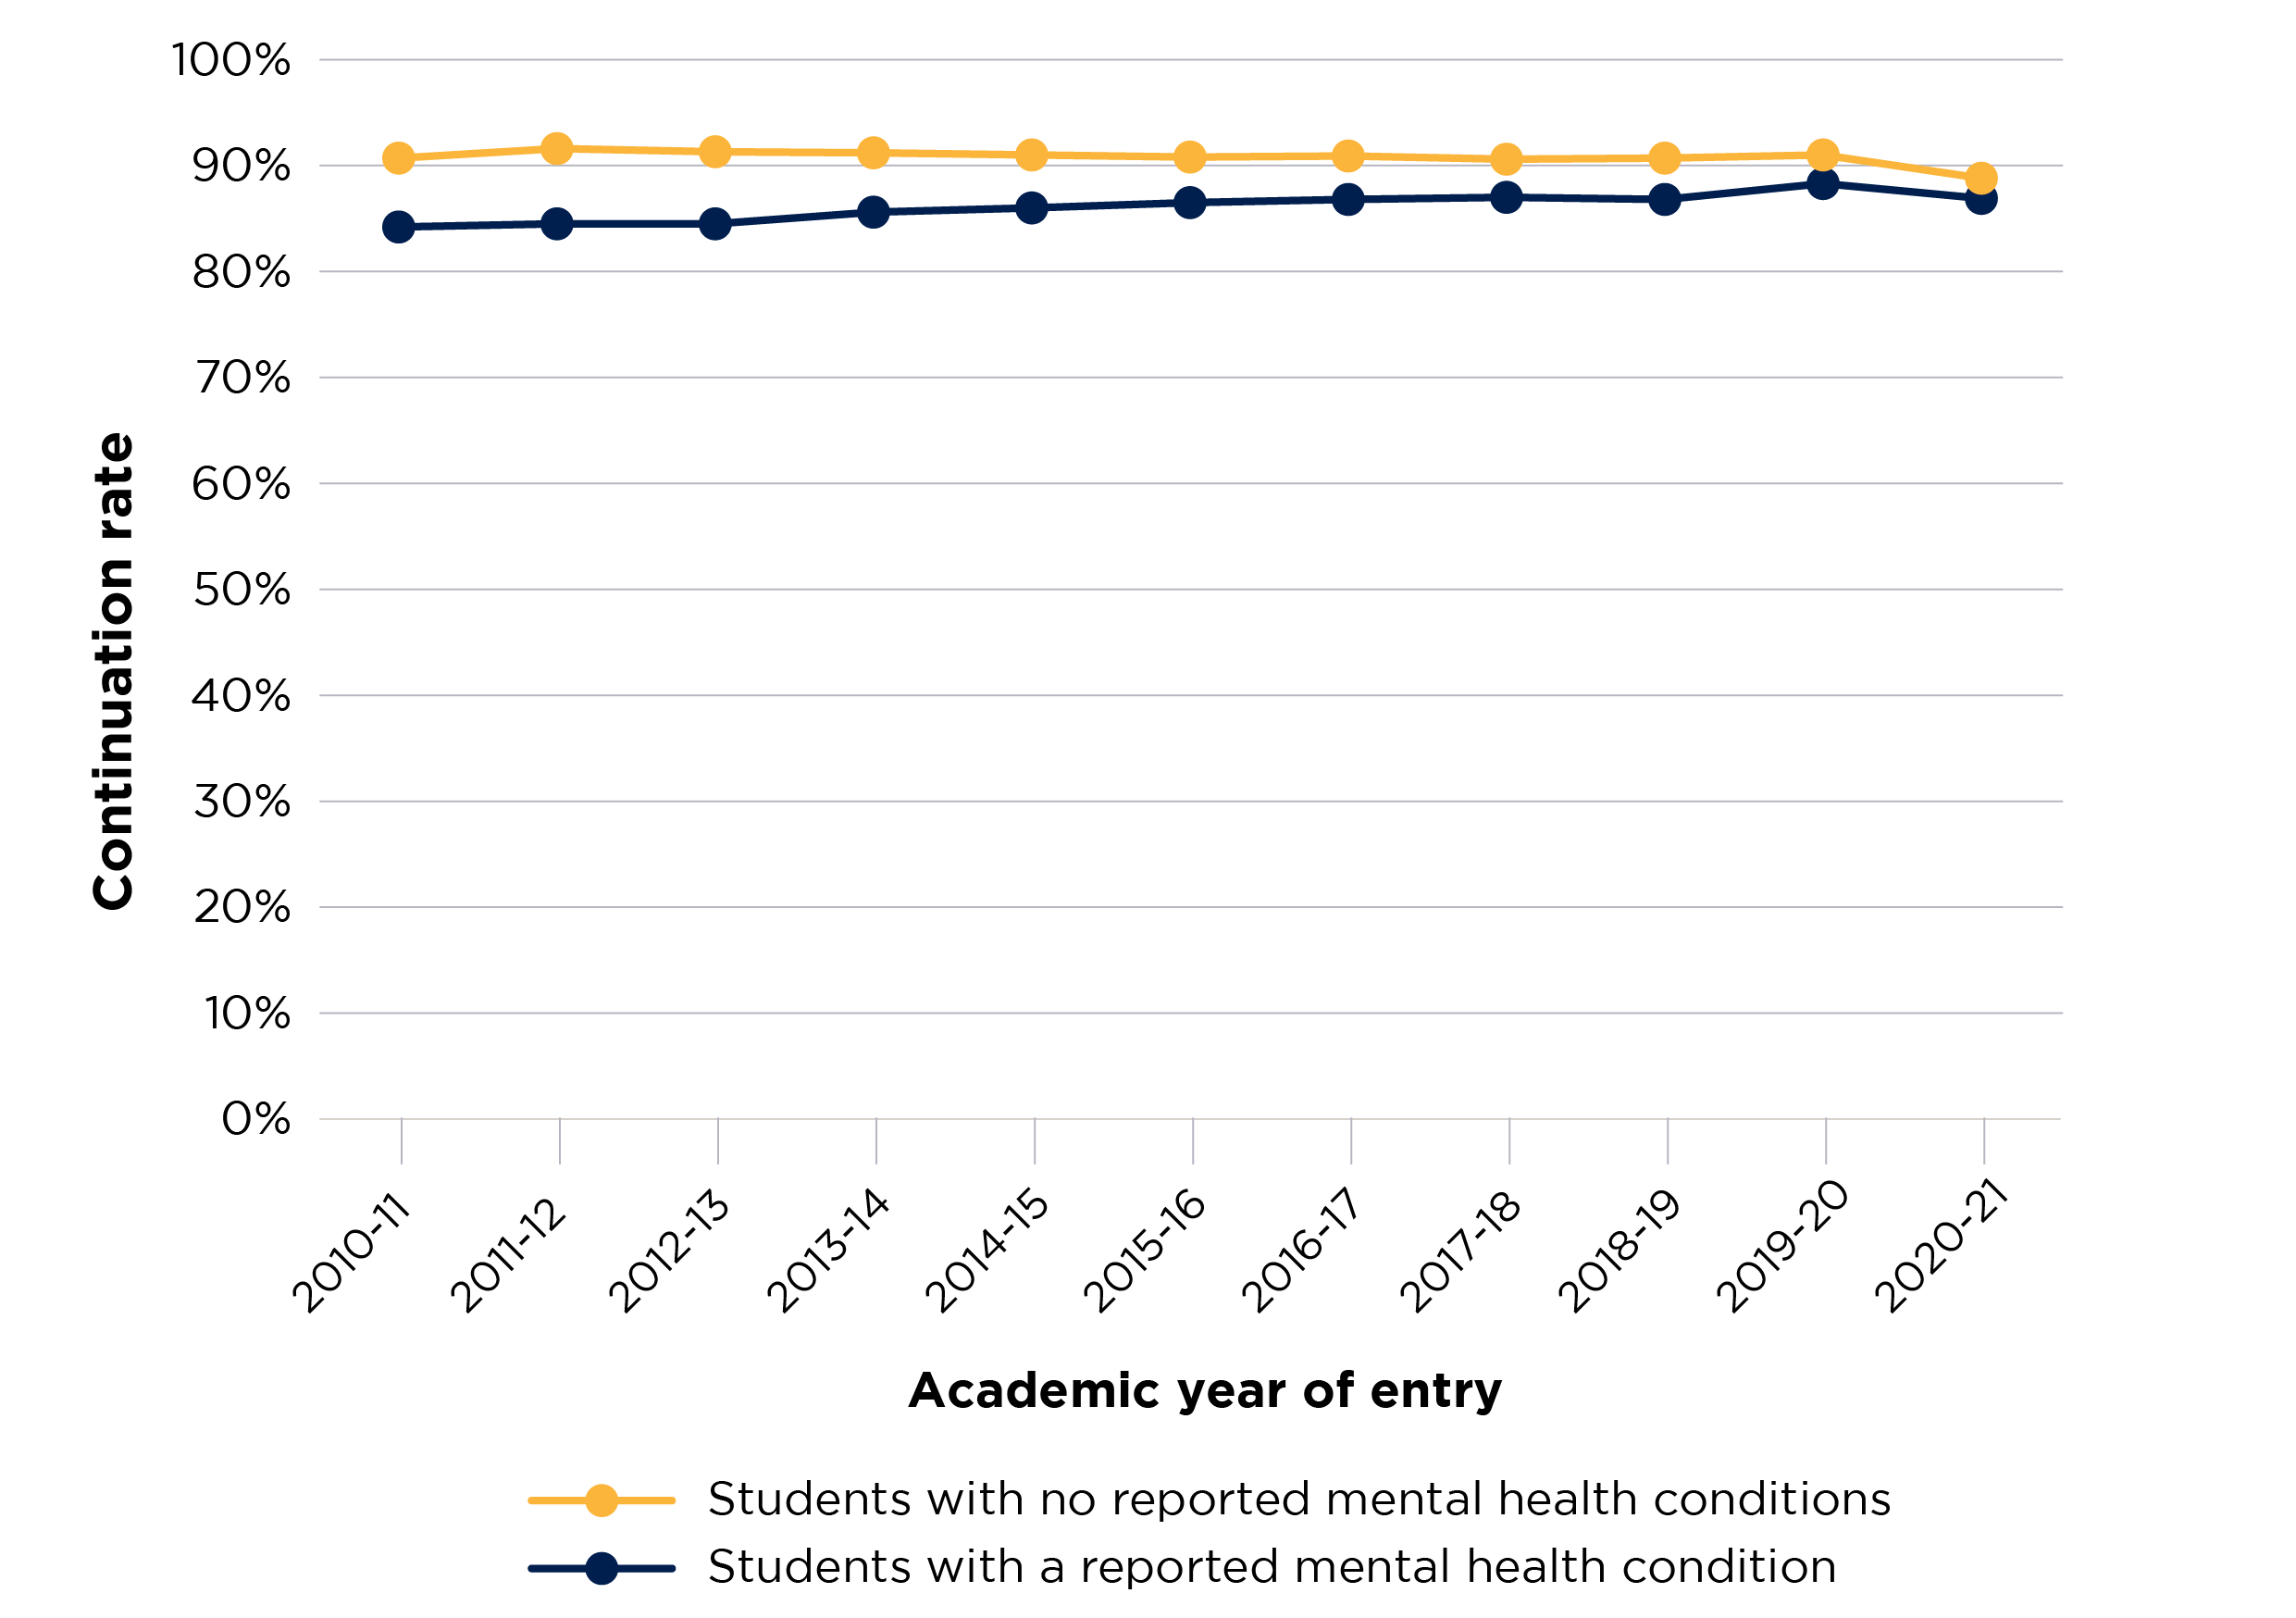
Figure 1 is a line chart that shows the continuation rates for students who reported having a mental health condition and students who did not, across the years of the time series.
There are two solid lines which display the rate for each year in the time series for each of the student groups. Students with a reported mental health condition are shown with a blue line, and students without with a yellow line.
The y axis displays the continuation rate and is scaled between 0 and 100 per cent.
The x axis shows the relevant year of entry for the student population used in the data.
Figure 2: Completion rates of full-time students who did and did not report having a mental health condition
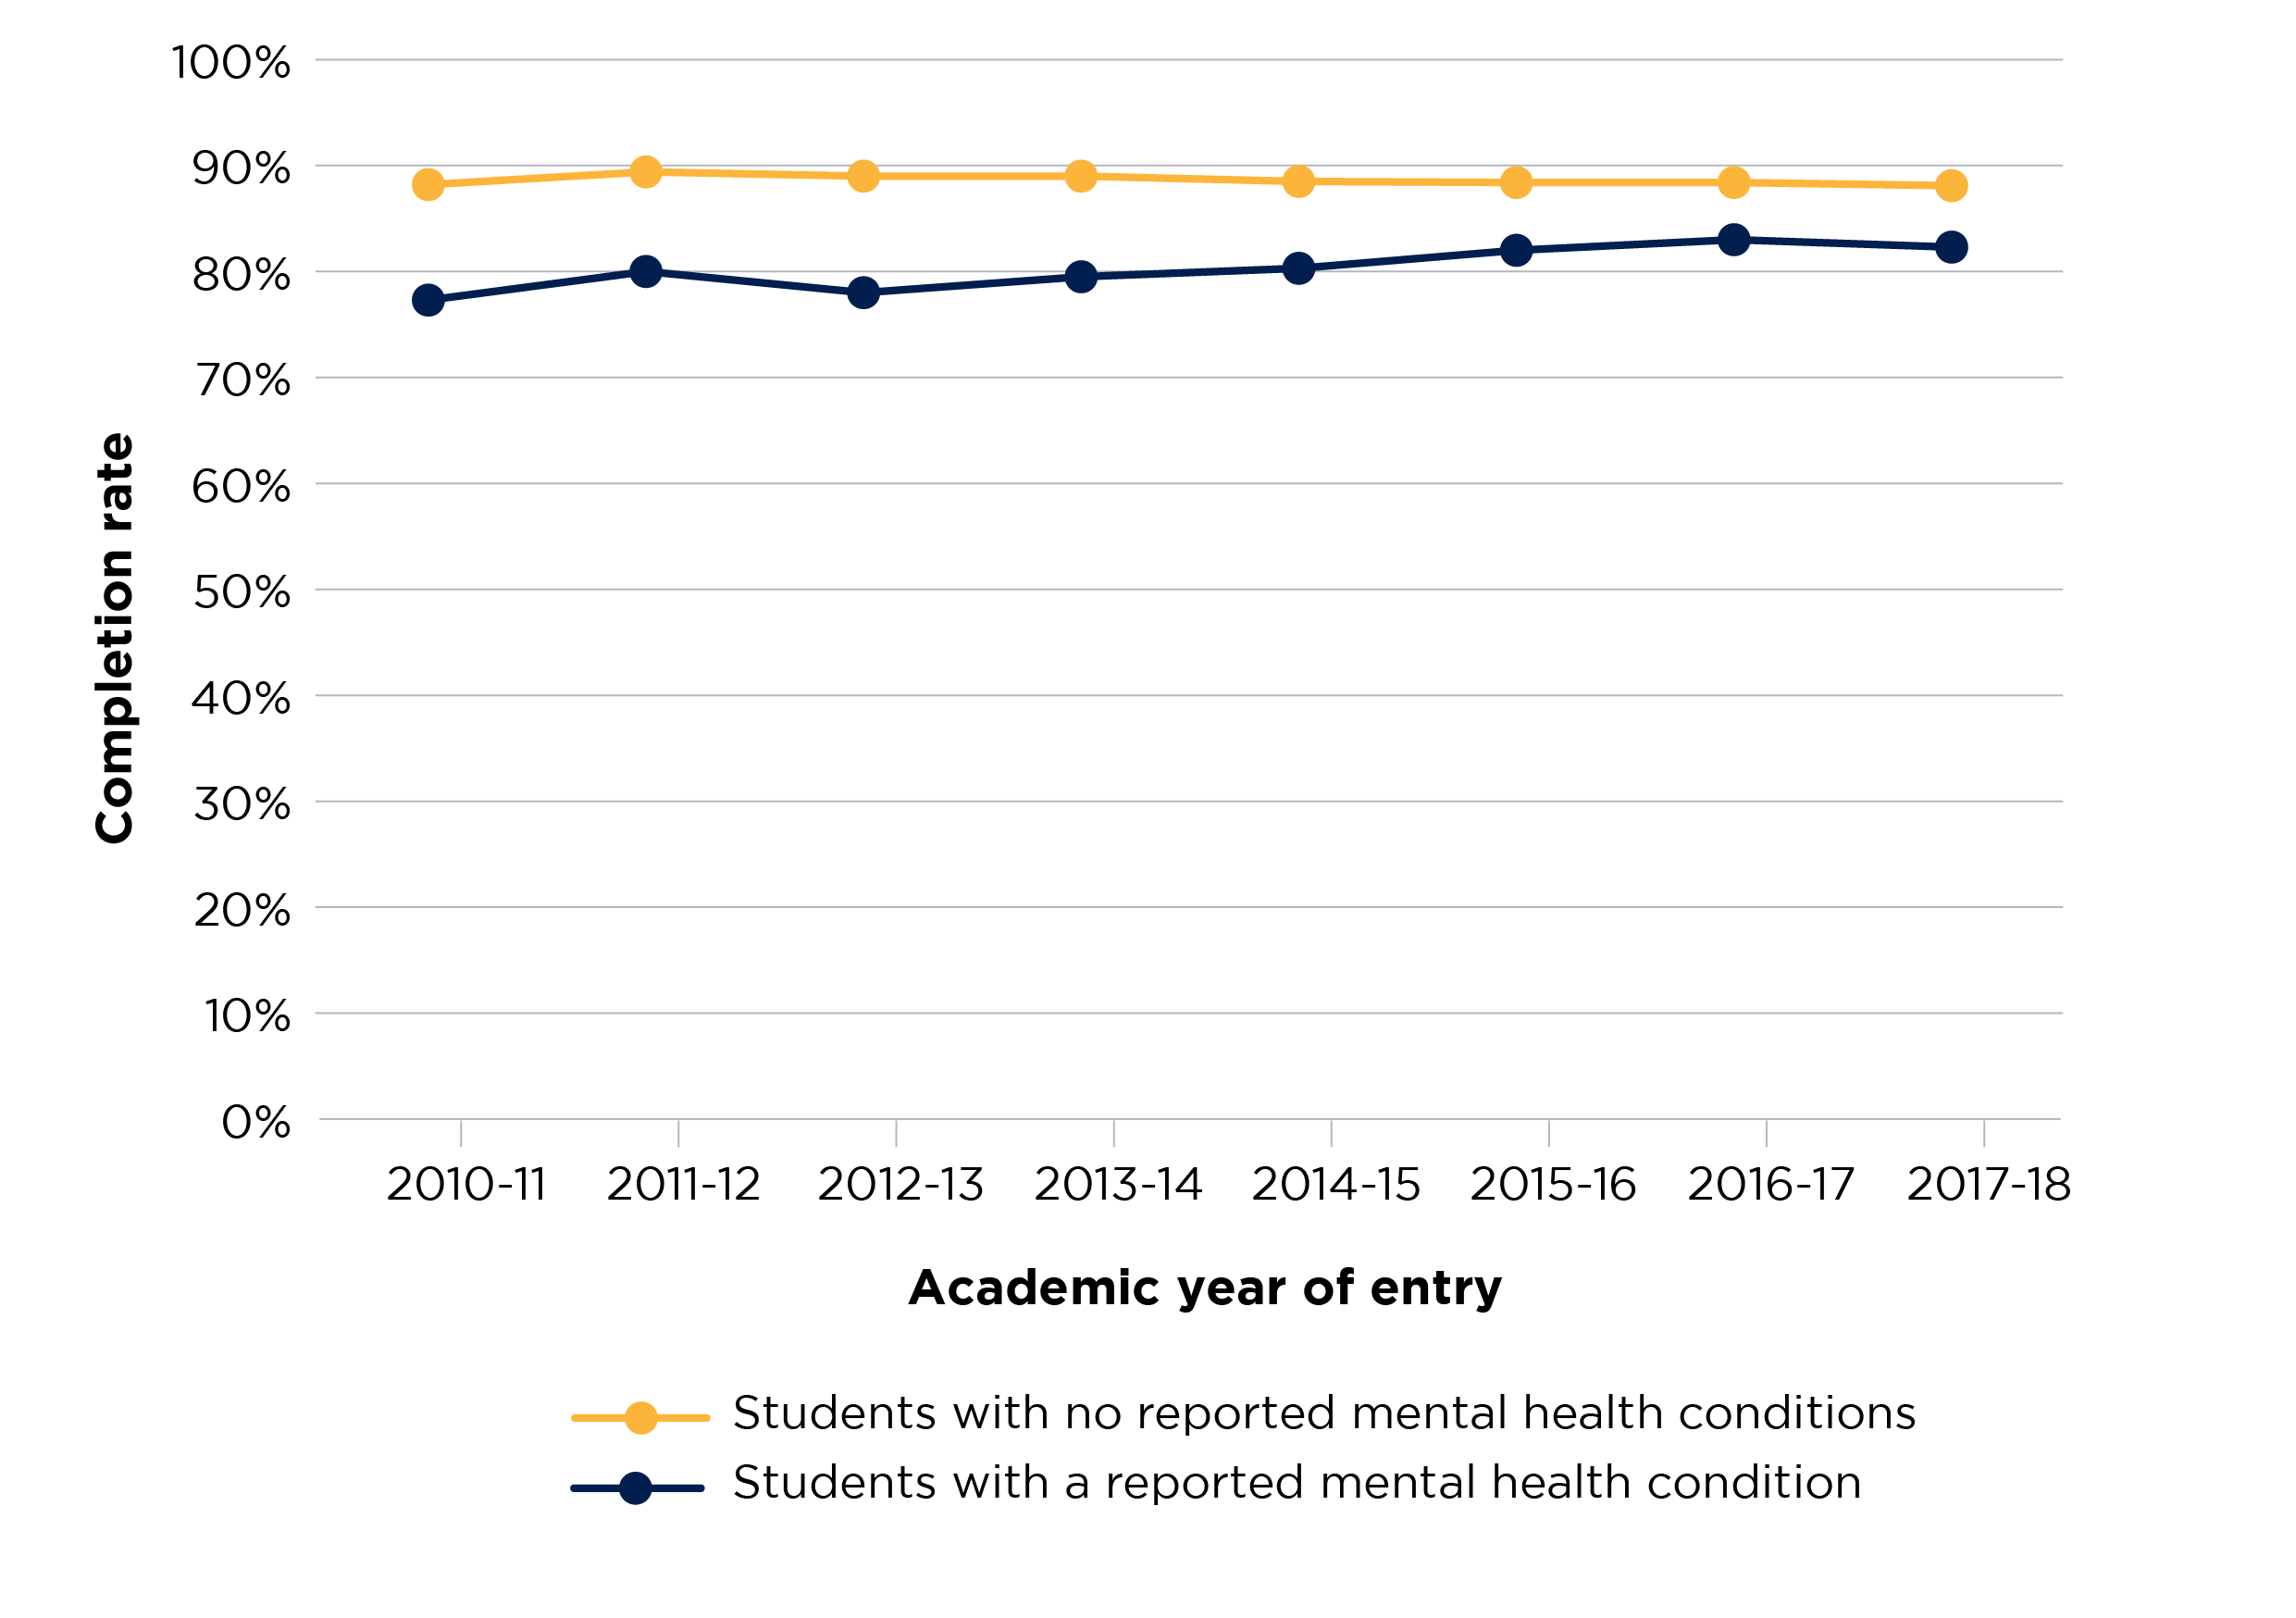
Figure 2 is a line chart that shows the completion rates for students who reported having a mental health condition and students who did not, across the years of the time series.
There are two solid lines, which display the rate for each year in the time series for each of the student groups. Students with a reported mental health condition are shown with a blue line, and students without with a yellow line.
The y axis displays the completion rate and is scaled between 0 and 100 per cent.
The x axis shows the relevant year of entry for the student population used in the data.
Figure 3: Attainment rates of full-time students who did and did not report having a mental health condition
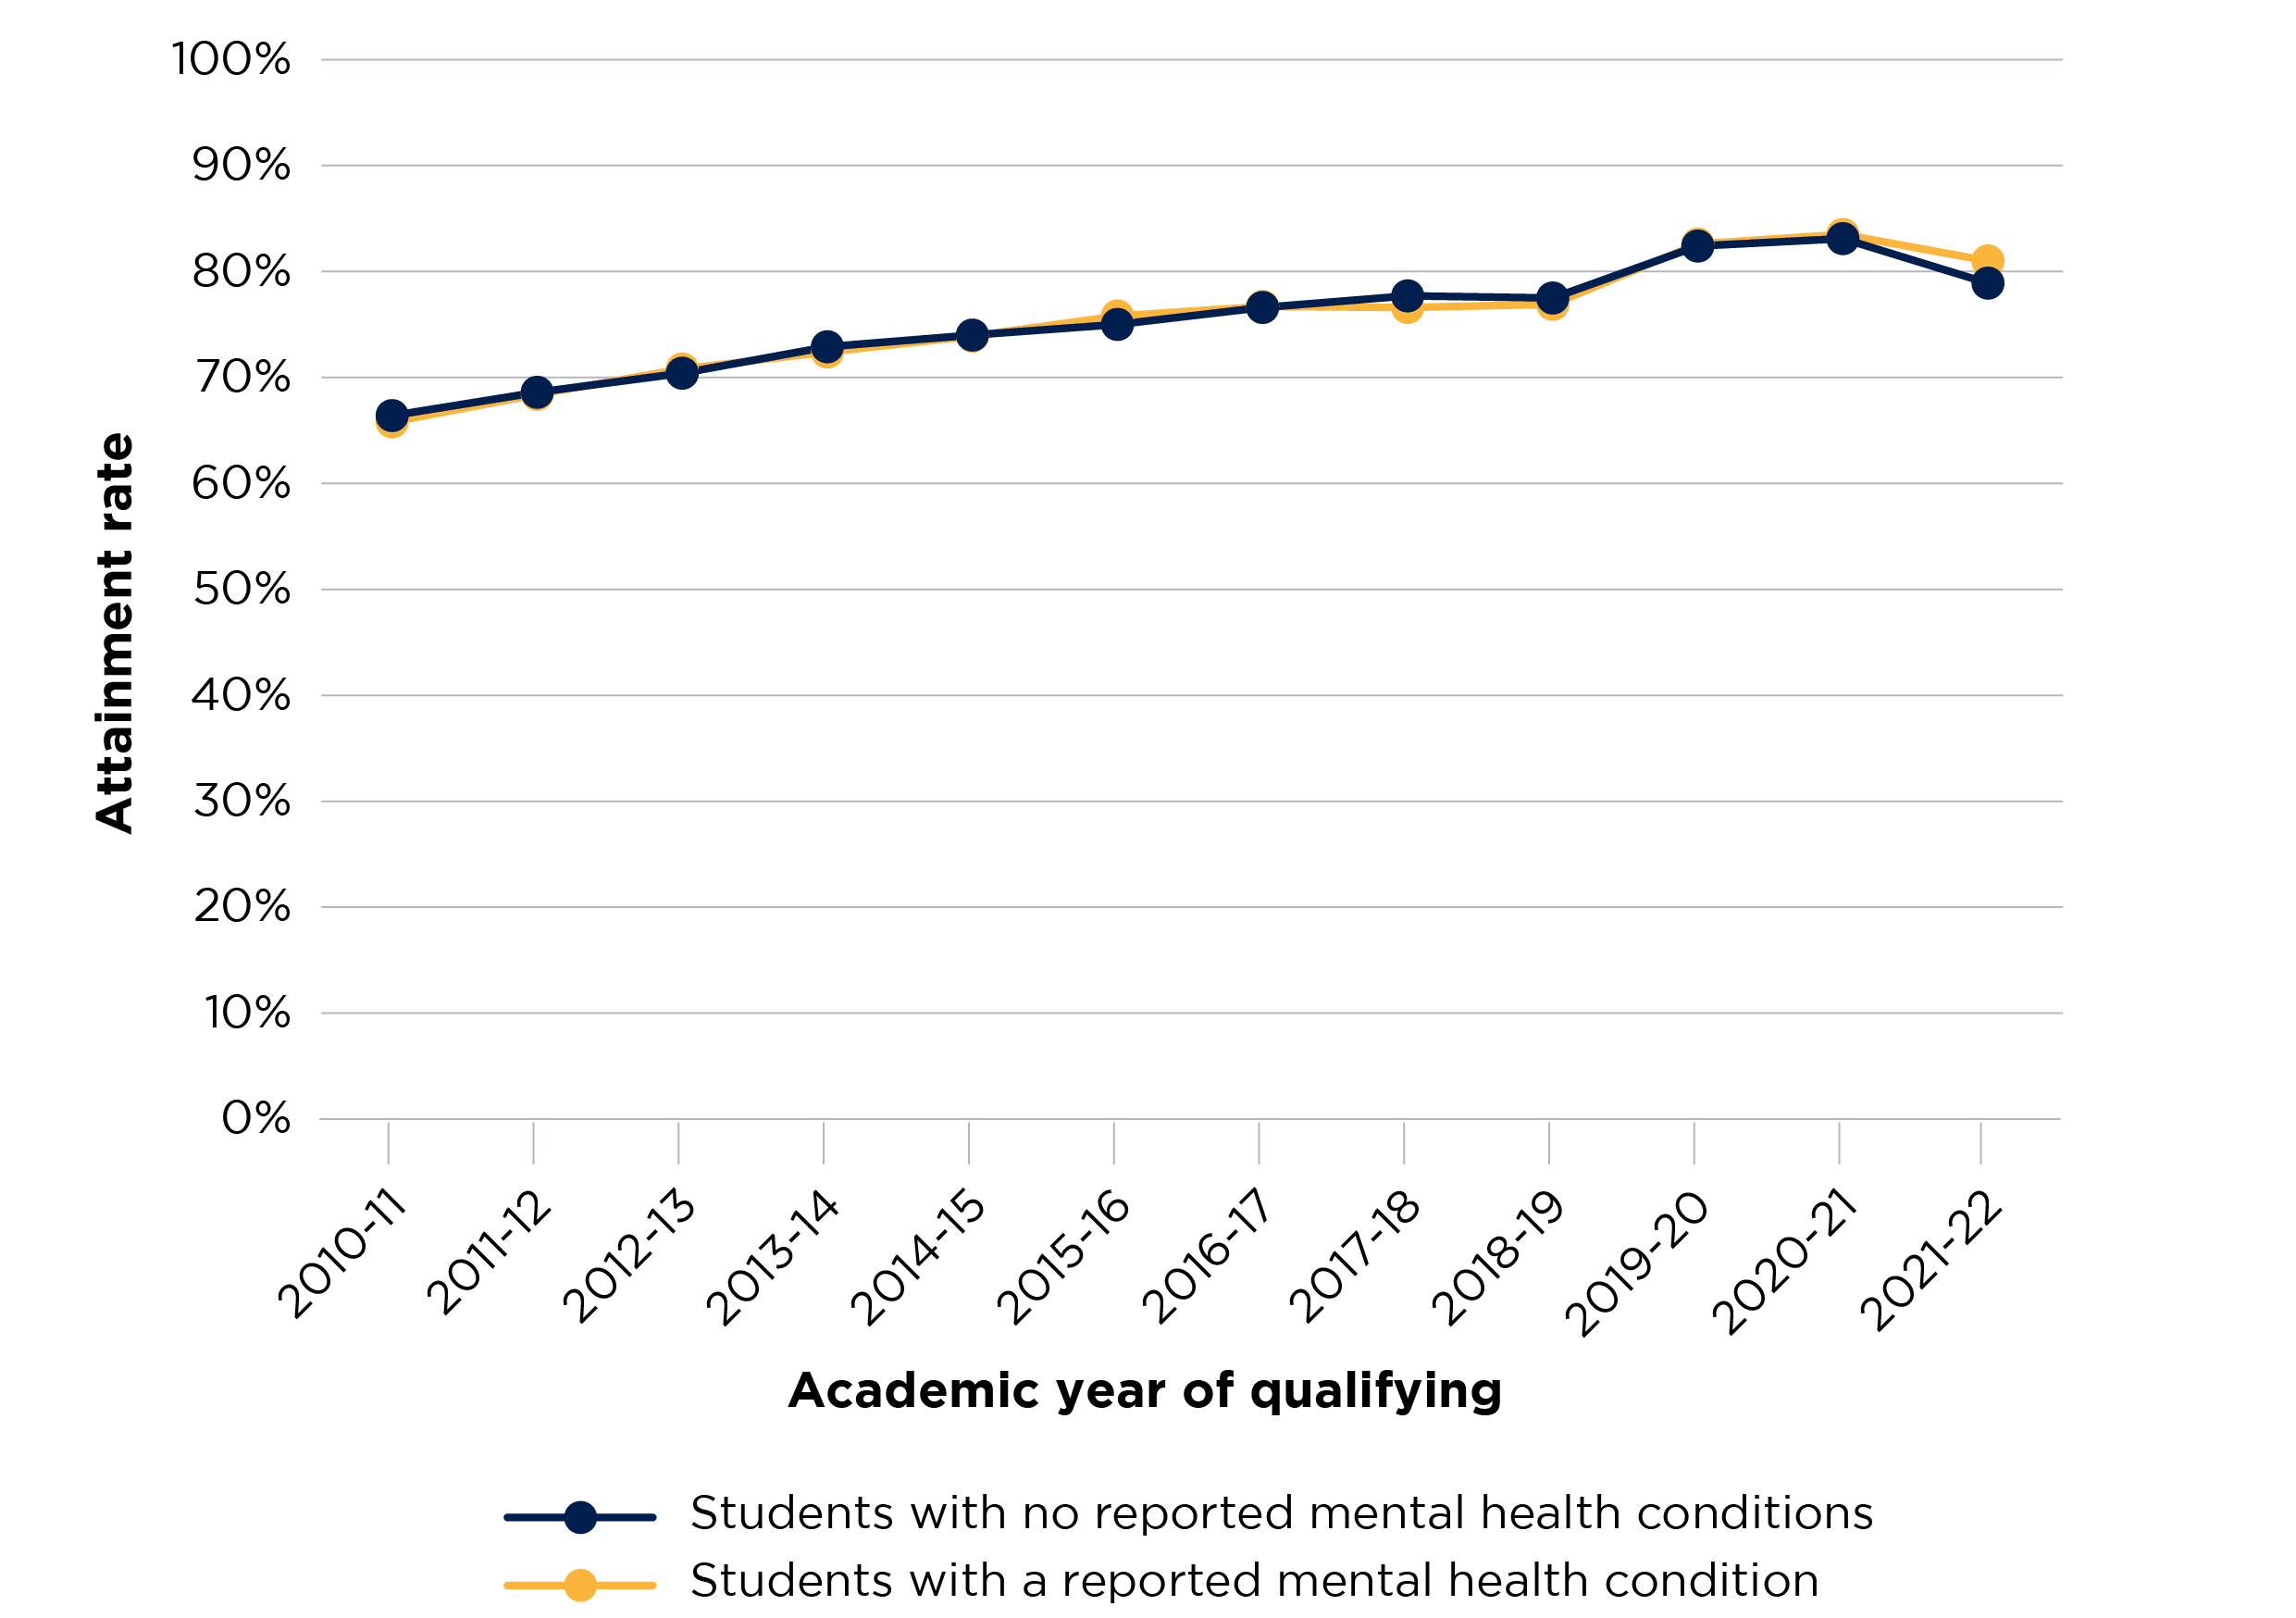
Figure 3 is a line chart that shows the attainment rates for students who reported having a mental health condition and students who did not, across the years of the time series.
There are two solid lines, which display the rate for each year in the time series for each of the student groups. Students with a reported mental health condition are shown with a blue line, and students without with a yellow line.
The y axis displays the attainment rate and is scaled between 0 and 100 per cent.
The x axis shows the relevant year of qualifying for the student population used in the data.
Figure 4: Progression rates of full-time students who did and did not report having a mental health condition
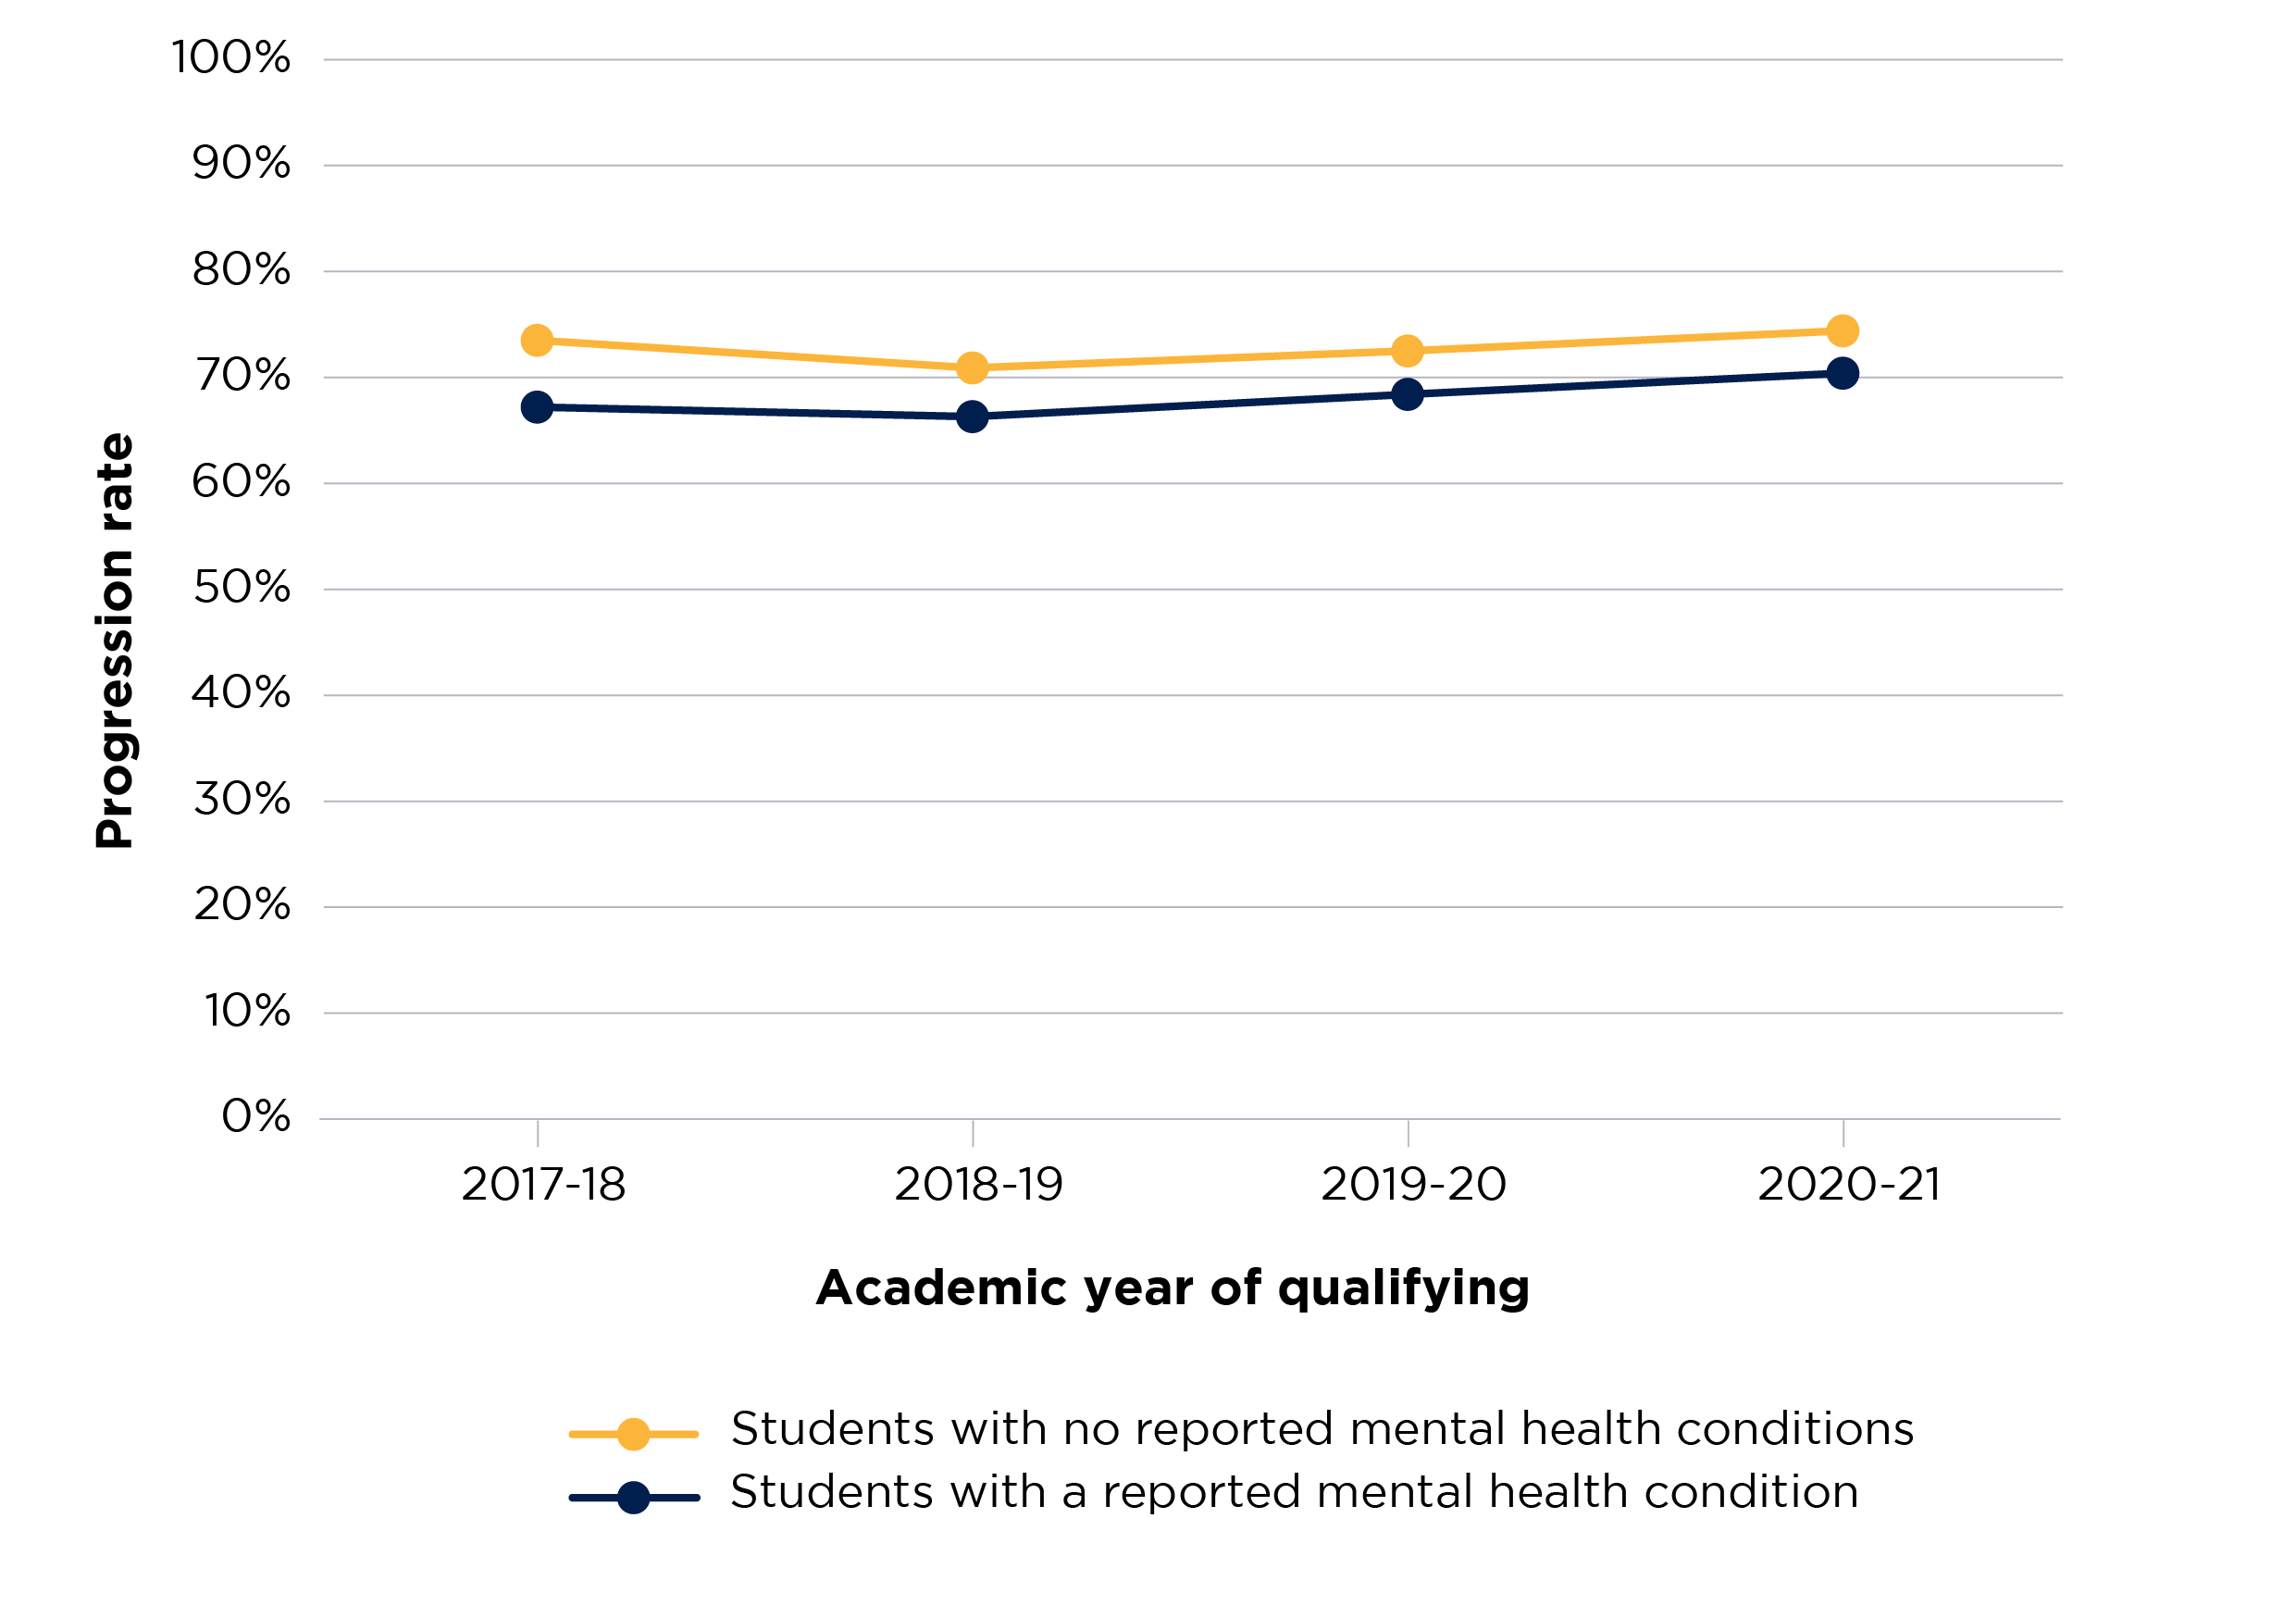
Figure 4 is a line chart that shows the progression rates for students who reported having a mental health condition and students who did not, across the years of the time series.
There are two solid lines, which display the rate for each year in the time series for each of the student groups. Students with a reported mental health condition are shown with a blue line, and students without with a yellow line.
The y axis displays the progression rate and is scaled between 0 and 100 per cent.
The x axis shows the relevant year of qualifying for the student population used in the data.
Outcomes for young and mature students
Mature full-time entrants to higher education (aged 21 years and over) are more likely to report a mental health condition than their younger counterparts (aged under 21 years). This has been a consistent trend between 2010-11 and the latest data in 2021-22. In 2021-22, 4.9 per cent of full-time mature entrants had reported having a mental health condition, compared with 4.3 per cent of full-time young students.
There are differences in continuation, completion, and progression rates between those who reported a mental health condition and those who did not (for mature and young students respectively). The disparities for continuation and progression rates have been narrowing for both groups across the time series, but more quickly for mature students.
Continuation rates for full-time young students who reported a mental health condition have been increasing overall across the time series (except for entrants in 2020-21). For mature students with a reported mental health condition, the rate has remained fairly static (except for entrants in 2019-20, where the rate rose by 2.8 percentage points, but then declined by 2.3 percentage points in 2020-21) (see Figure 5).
Full-time mature students (both those who reported a mental health condition and those who did not) had a higher progression rate at the start of the time series (qualifying in 2010-11). However, at the end of the time series (qualifying in 2020-21) this was reversed, and full-time young students (both those who reported a mental health condition and those who did not) had a higher progression rate. However, progression rates are lower across the time series for both full-time mature and full-time young students who reported a mental health condition (see Figure 6).
Figure 5: Continuation rates of full-time students who did and did not report having a mental health condition, by age
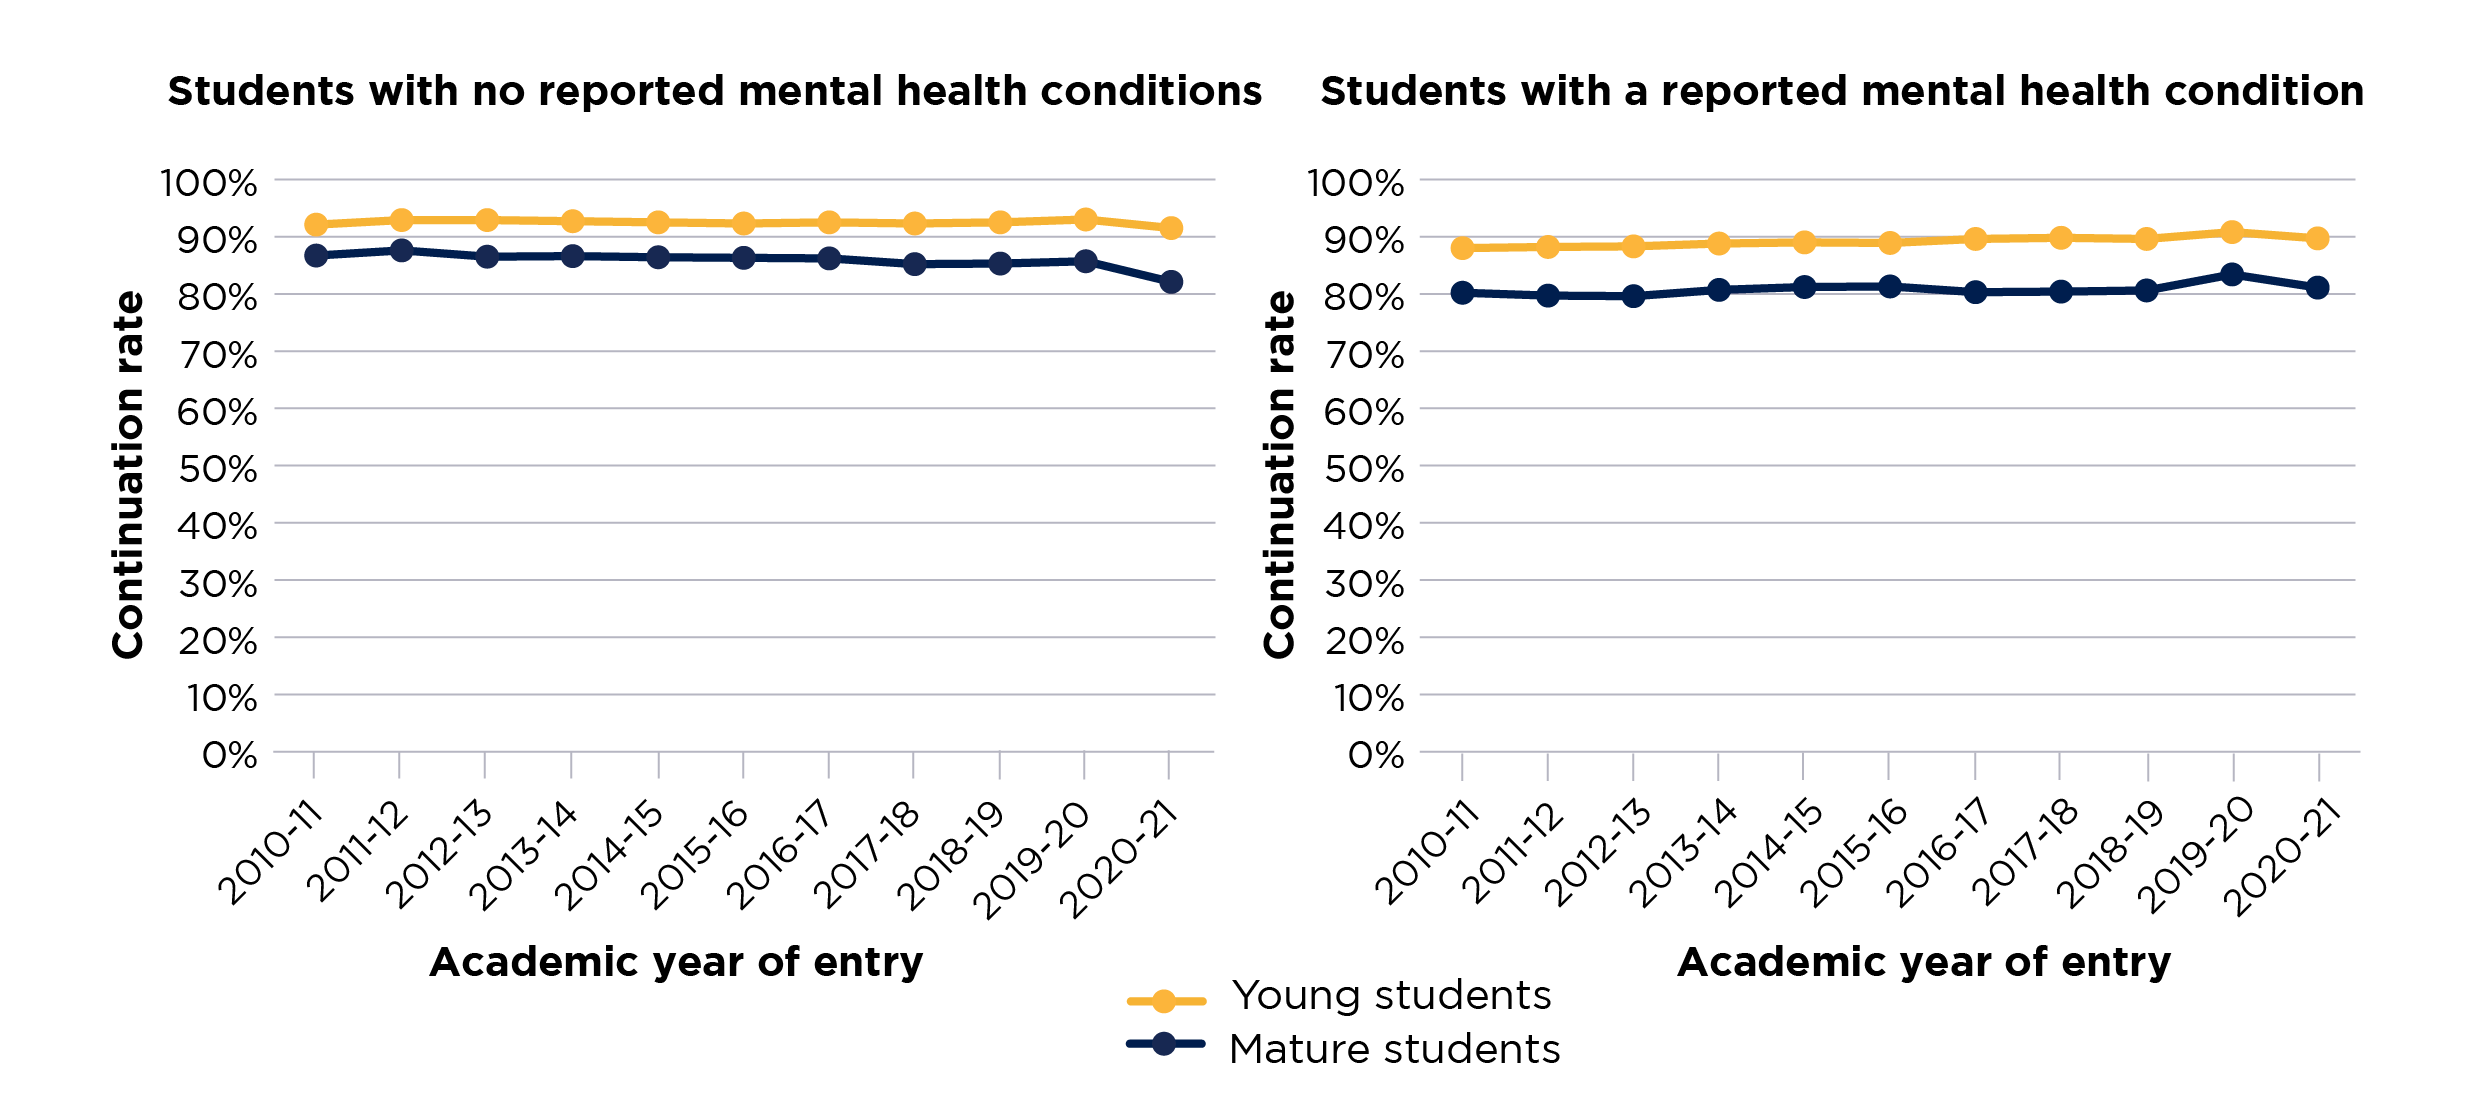
Figure 5 consists of two side-by-side line charts, which show the continuation rates for students who reported having a mental health condition and students who did not, across the years of the time series.
The left chart shows continuation rates for students who reported having a mental health condition, and the chart on the right continuation rates for students who did not report a mental health condition.
There are two solid lines in each chart, which display the rate for each year in the time series for each of the student groups. Young students are shown with a blue line, and mature with a yellow line.
The y axis displays the continuation rate and is scaled between 0 and 100 per cent.
The x axis shows the relevant year of entry for the student population used in the data.
Figure 6: Progression rates of full-time students who did and did not report having a mental health condition, by age
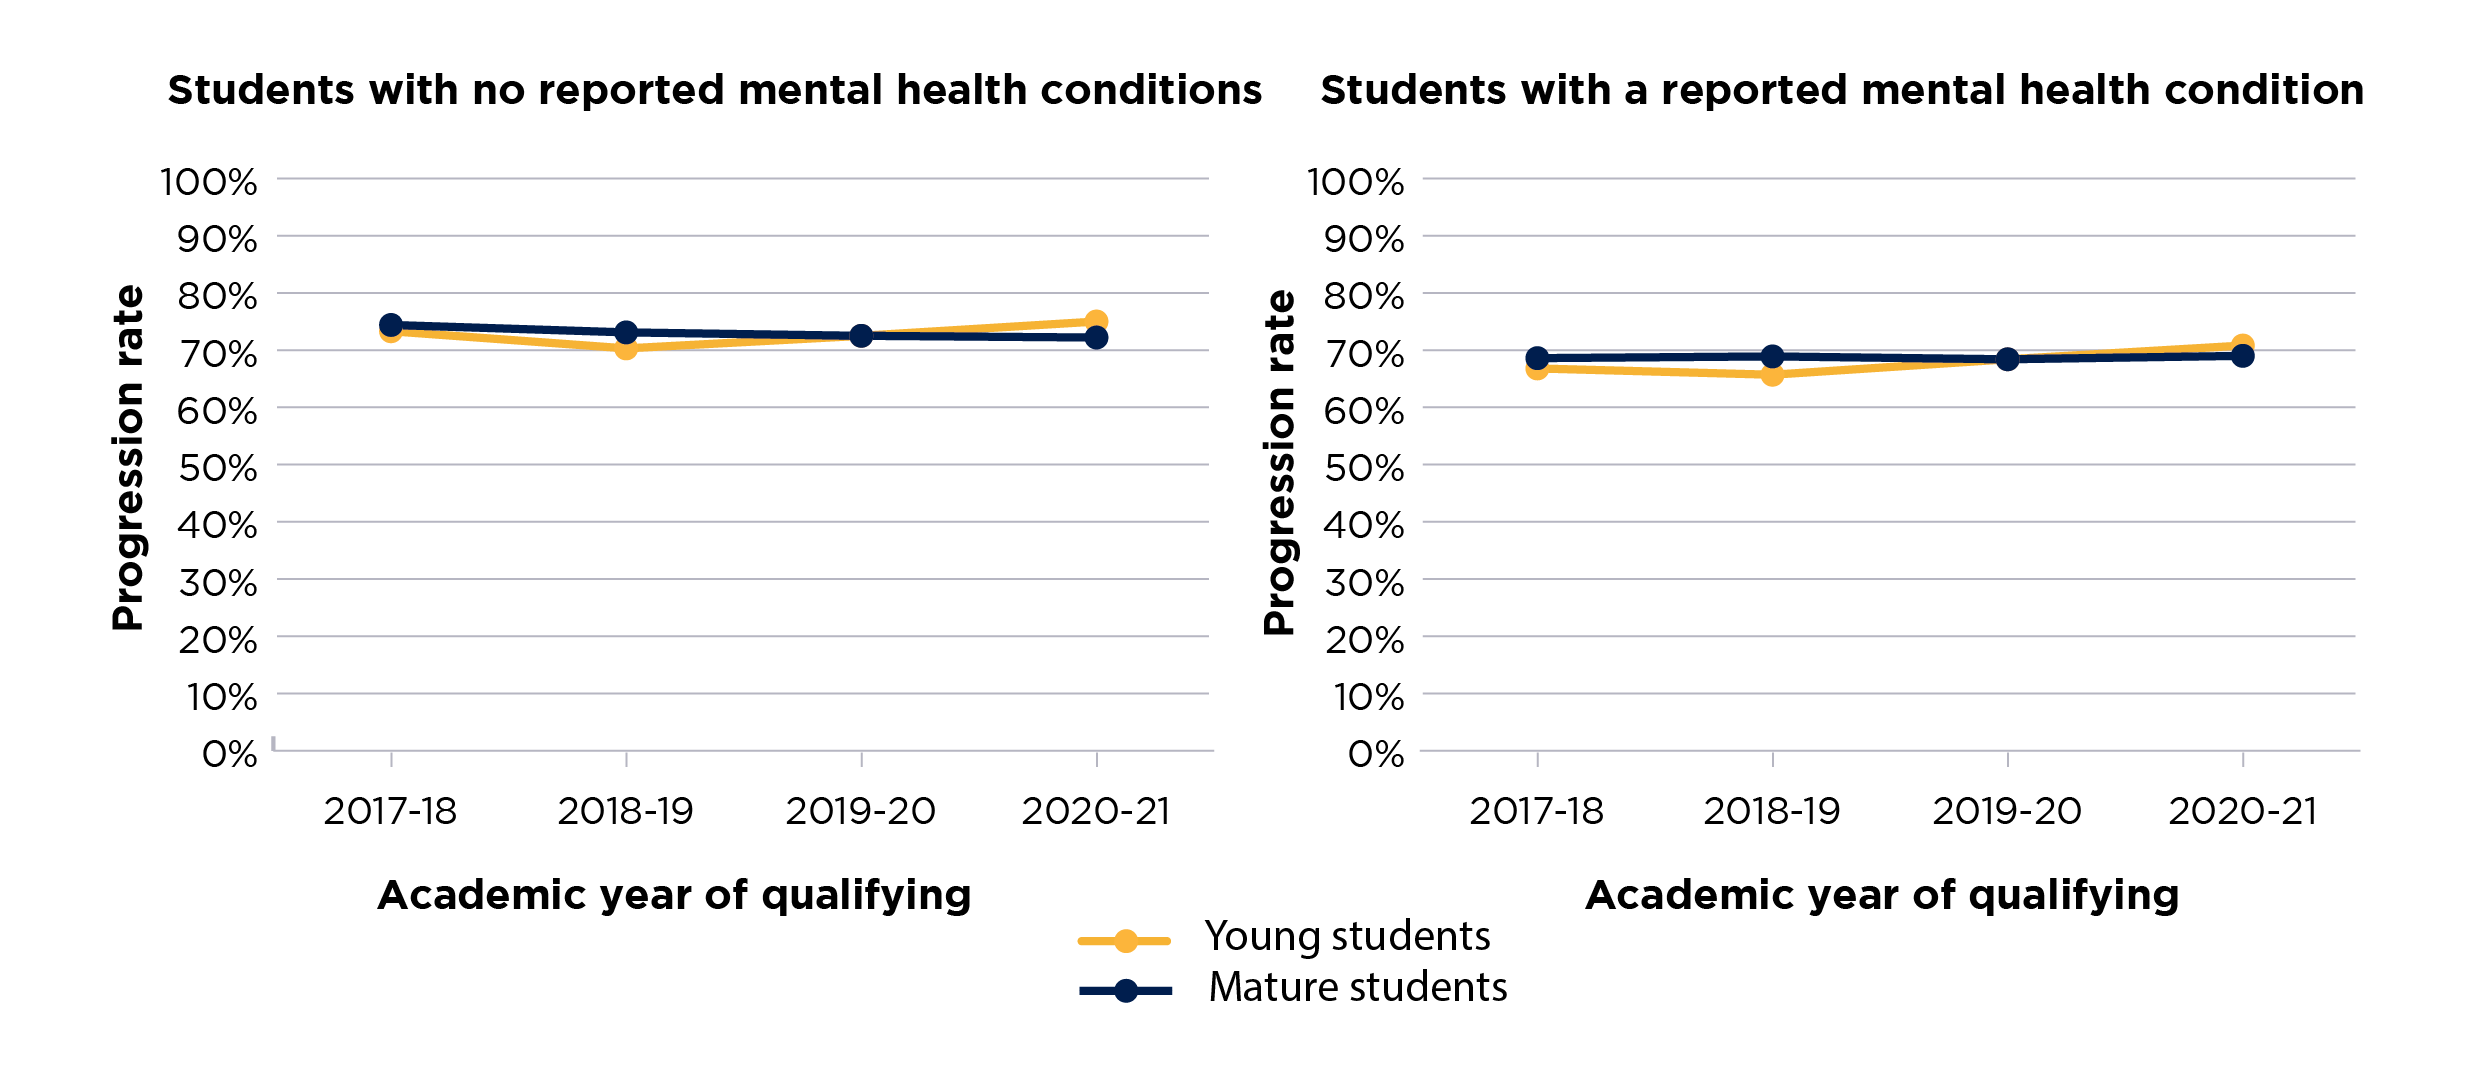
Figure 6 consists of two side-by-side line charts, which show the progression rates for students who reported having a mental health condition and students who did not, across the years of the time series.
The left chart shows progression rates for students who reported having a mental health condition, and the chart on the right progression rates for students who did not report a mental health condition.
There are two solid lines in each chart, which display the rate for each year in the time series for each of the student groups. Young students are shown with a blue line, and mature with a yellow line.
The y axis displays the progression rate and is scaled between 0 and 100 per cent.
The x axis shows the relevant year of qualifying for the student population used in the data.
Outcomes for male and female students
In 2021-22, 6.3 per cent of full-time female entrants reported having a mental health condition, compared with 2.3 per cent of male entrants. Female entrants to higher education are more likely to report having a mental health condition than male entrants throughout the time series. The rate of reporting for female students has increased dramatically since 2010-11. However, the reporting rates have remained stable for male entrants over the last four years, following less sharp increases than for their female counterparts between 2010-11 and 2018-19 (see Figure 7).
Figure 7: Proportion of full-time students who reported having a mental health condition, by sex
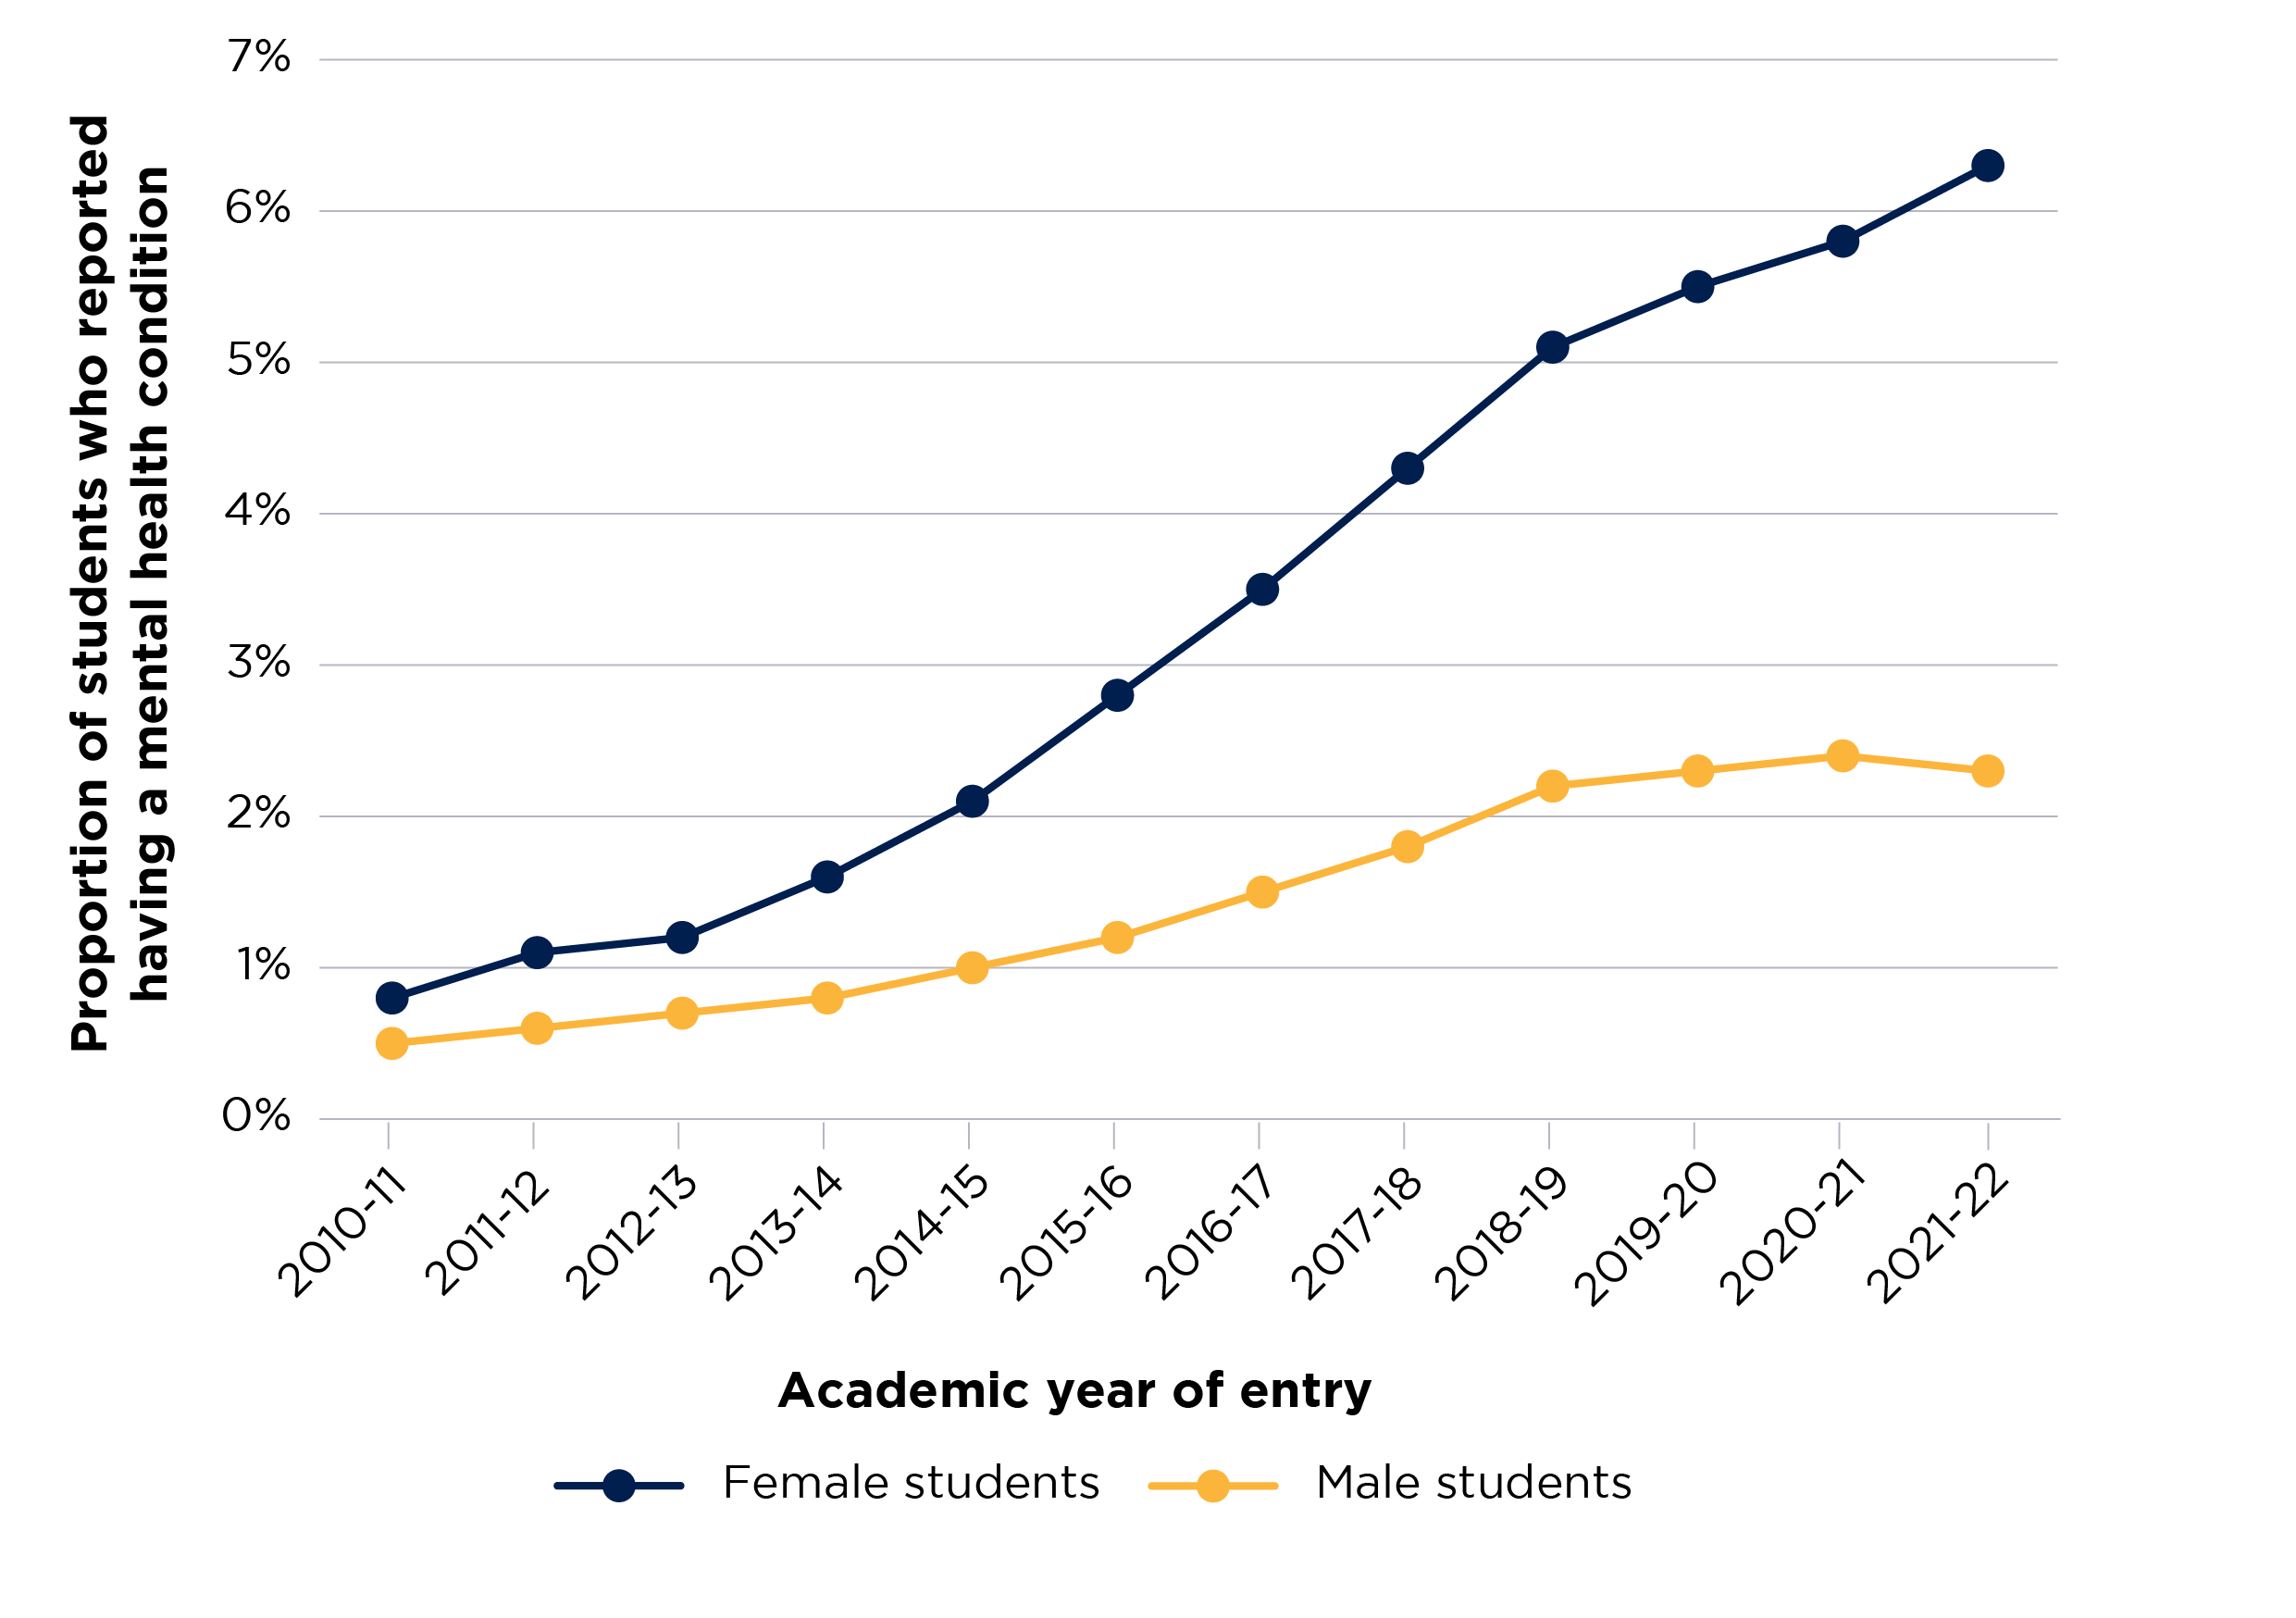
Figure 7 is a line chart that shows the proportion of students who reported having a mental health condition across the years of the time series.
There are two solid lines in each chart, which display the proportion of students for each year in the time series for each of the student groups. Female students are shown with a blue line, and male students with a yellow line.
The y axis displays the proportion of students with certain outcomes and is scaled between 0 and 7 per cent.
The x axis shows the relevant year of entry for the student population used in the data.
For full-time entrants in 2020-21, the difference in continuation rates between students who reported having a mental health condition and those who did not was 2.5 percentage points for female students and 3.7 percentage points for male students. Figure 8 shows the continuation rates of full-time students with and without a reported mental health condition, by sex.
The continuation rate differences between female and male students with a reported mental health condition have fluctuated across the time series. In 2020-21, the difference was 5.4 percentage points, larger than the 5.1 percentage points seen in 2010-11, but smaller than in 2016-17, when the disparity was at its largest (5.8 percentage points). In contrast, the differences between female and male students without a reported mental health condition have been more stable throughout the time series, until the most recent years, when the disparity increased. In 2020-21, this disparity was 4.2 percentage points, an increase from the 2.2 percentage points at the start of the time series.
In the latest year of data available (for full-time entrants in 2017-18), the difference in completion rates between female students with and without a reported mental health condition was 6.4 percentage points. The equivalent difference for male students was 8.4 percentage points. Figure 9 shows the completion rates of full-time students with and without a reported mental health condition, by sex. The completion rate differences between female and male students with a reported mental health condition have fluctuated throughout the time series. The largest difference was 9.8 percentage points in 2013-14, and although the difference was close to this in 2016-17 (9.6 percentage points), it then diminished for entrants in 2017-18 to 7.4 percentage points.
The differences between female and male students without a reported mental health condition have slowly increased across the time series. In the latest year of data, female students with a reported mental health condition have a similar completion rate (84.1 per cent) to that of male students without such a condition (85.1 per cent.)
Figure 8: Continuation rates of full-time students who did and did not report having a mental health condition, by sex
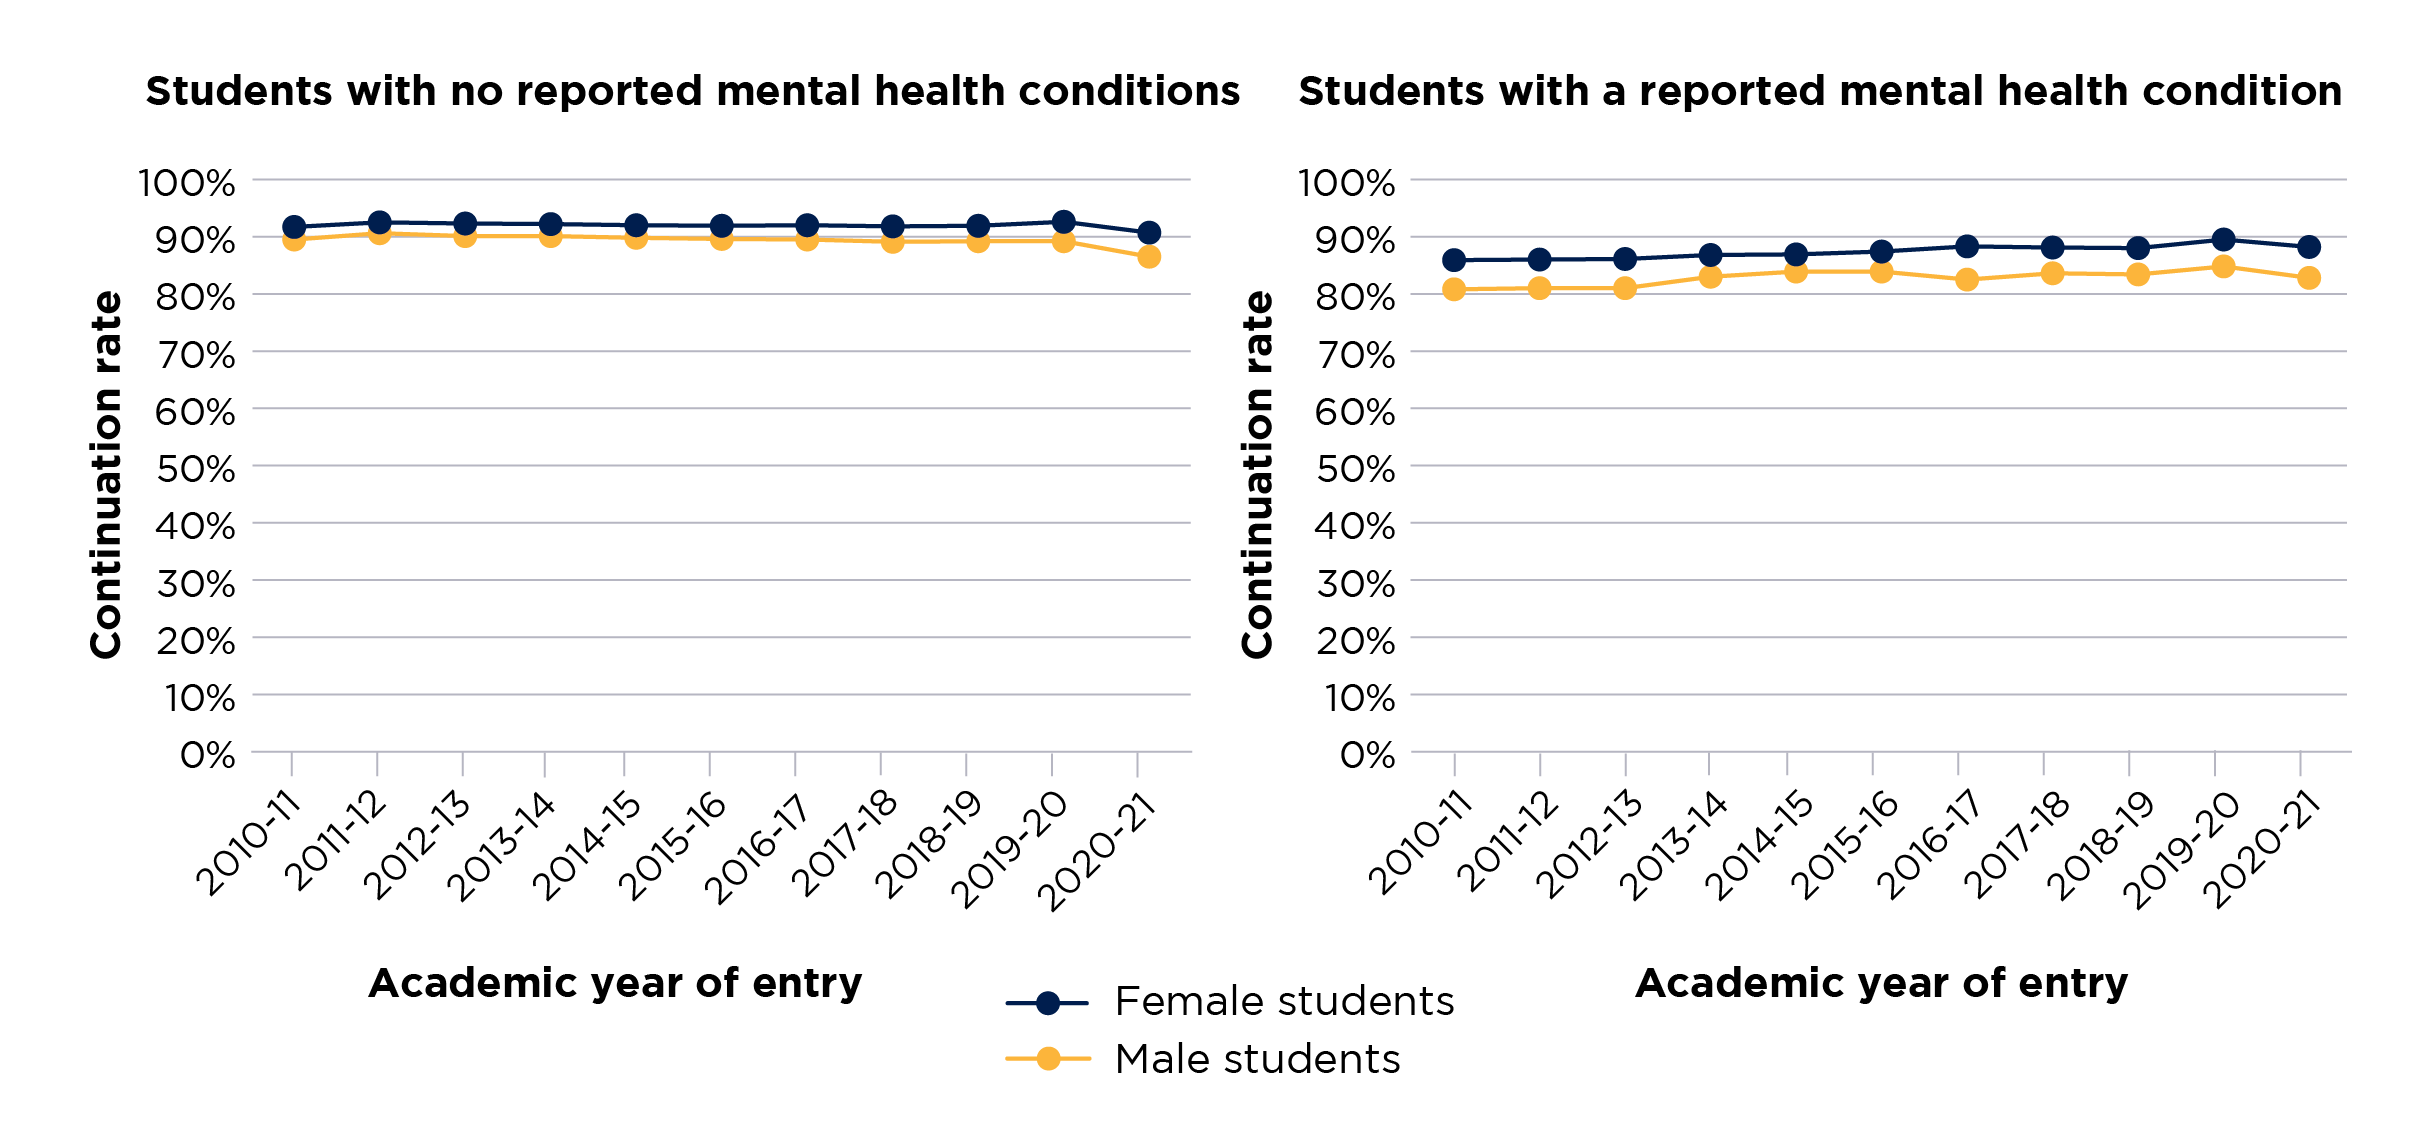
Figure 8 consists of two side-by-side line charts, which show the continuation rates for students who reported having a mental health condition and students who did not, across the years of the time series.
The left chart shows continuation rates for students who reported having a mental health condition, and the chart on the right continuation rates for students who did not report a mental health condition.
There are two solid lines in each chart, which display the rate for each year in the time series for each of the student groups. Female students are shown with a blue line, and male with a yellow line.
The y axis displays the continuation rate and is scaled between 0 and 100 per cent.
The x axis shows the relevant year of entry for the student population used in the data.
Figure 9: Completion rates of full-time students who did and did not report having a mental health condition, by sex
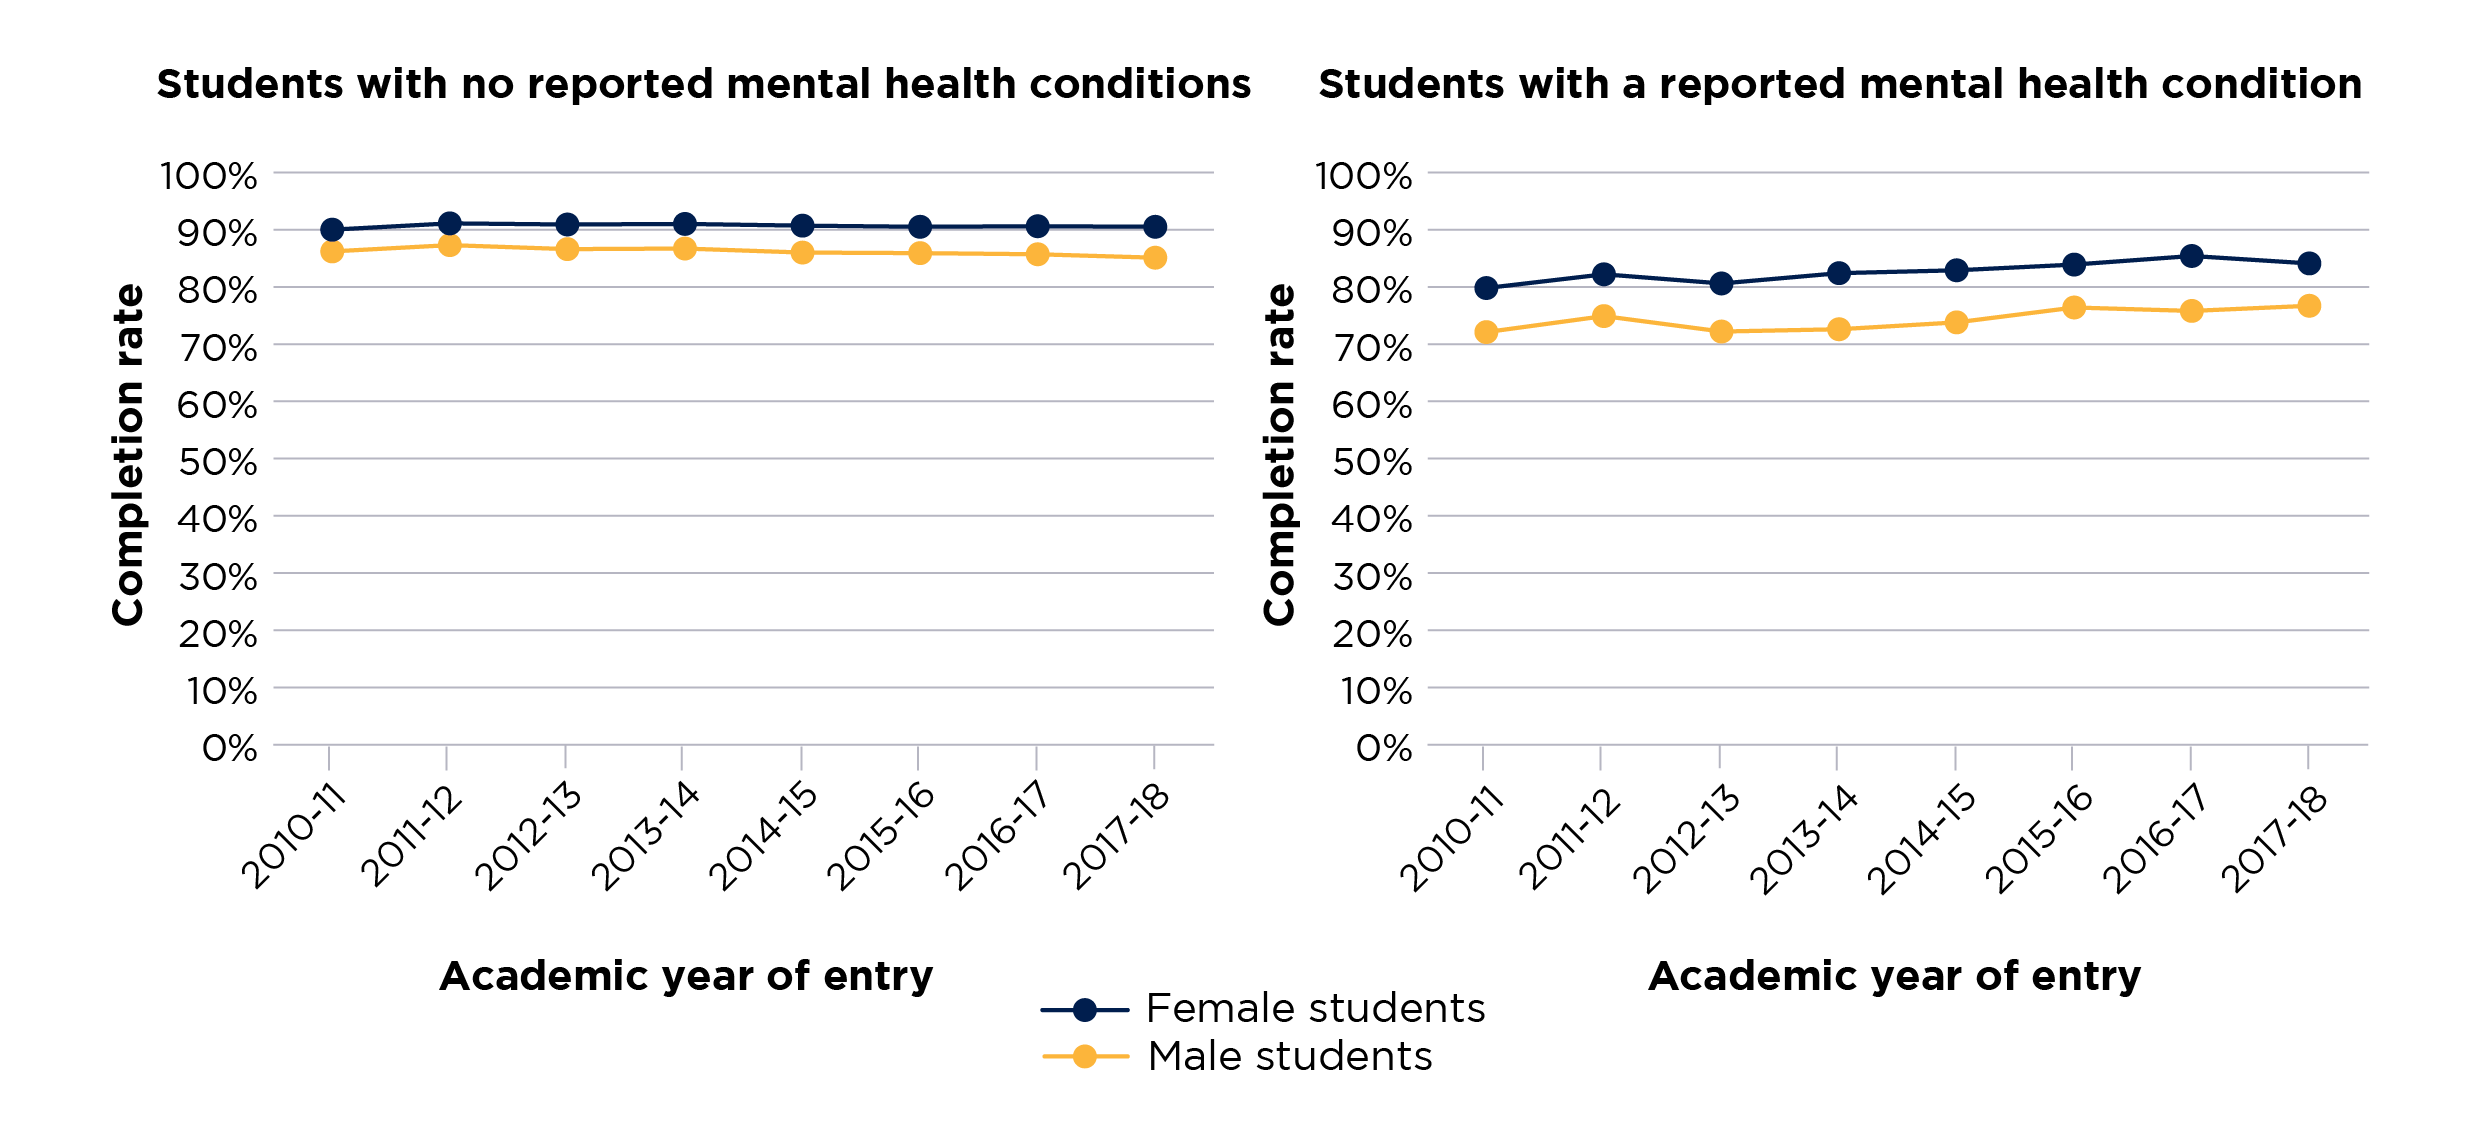
Figure 9 consists of two side-by-side line charts, which show the completion rates for students who reported having a mental health condition and students who did not, across the years of the time series.
The left chart shows completion rates for students who reported having a mental health condition, and the chart on the right completion rates for students who did not report a mental health condition.
There are two solid lines in each chart, which display the rate for each year in the time series for each of the student groups. Female students are shown with a blue line, and male with a yellow line.
The y axis displays the completion rate and is scaled between 0 and 100 per cent.
The x axis shows the relevant year of entry for the student population used in the data.
The disparity in progression rates for female students with and without a reported mental health condition who qualified in 2020-21 is 3.3 percentage points, and for male students it is 4.2 percentage points.
Figure 10 shows that the progression rate difference between male and female students who reported a mental health condition has narrowed more in the last two years than the difference between the two groups of students who had not reported such a condition. Unlike continuation and completion rates, progression rates are higher for male students throughout the time series, both among those who did and those who did not report a mental health condition.
Figure 10: Progression rates of full-time students who did and did not report having a mental health condition, by sex
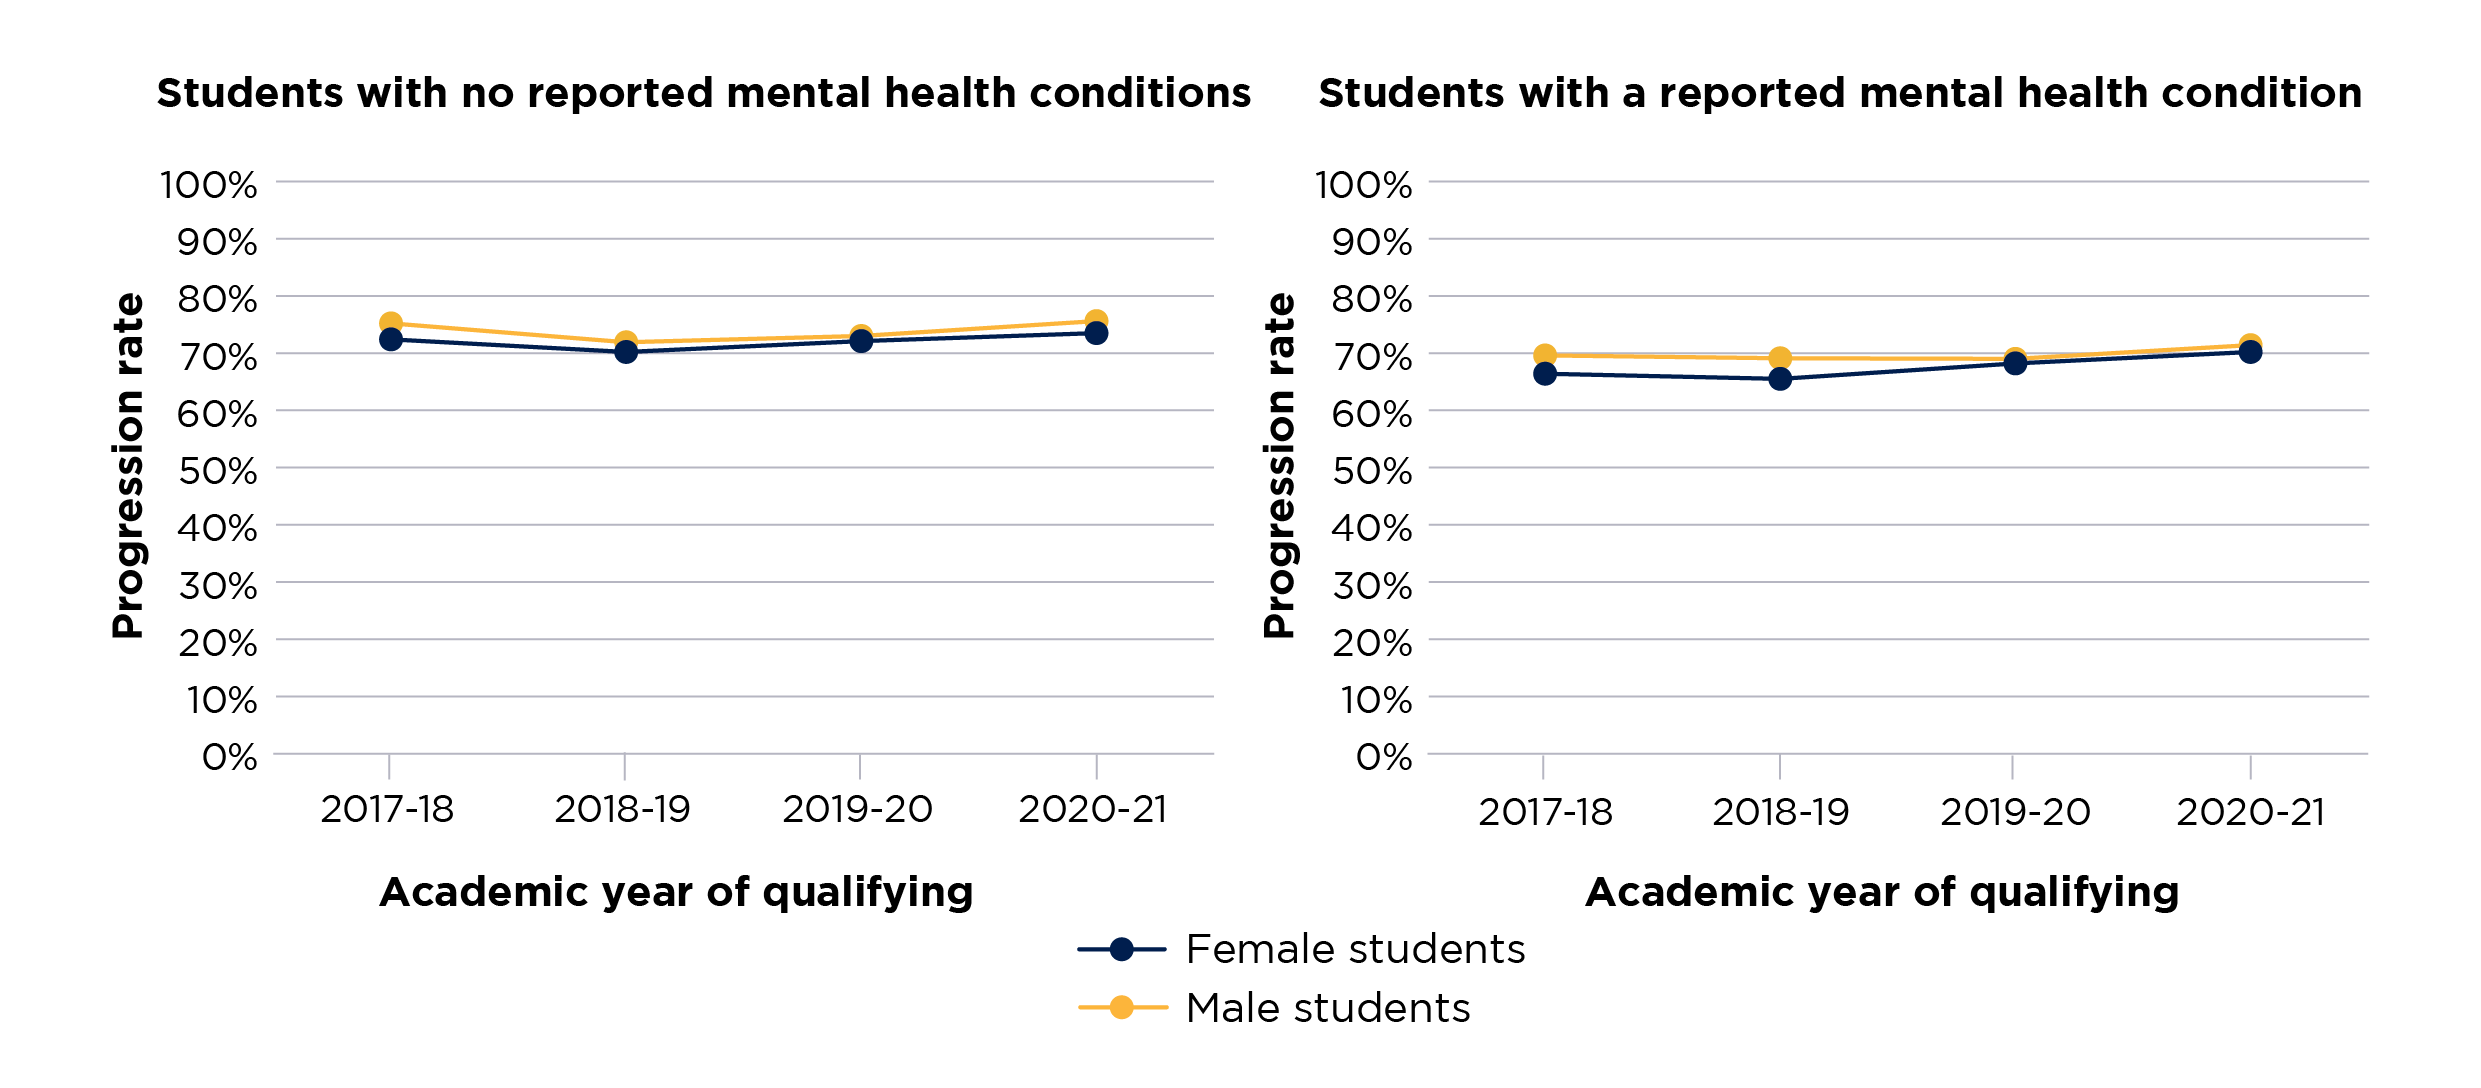
Figure 10 consists of two side-by-side line charts, which show the progression rates for students who reported having a mental health condition and students who did not, across the years of the time series.
The left chart shows progression rates for students who reported having a mental health condition, and the chart on the right progression rates for students who did not report a mental health condition.
There are two solid lines in each chart, which display the rate for each year in the time series for each of the student groups. Female students are shown with a blue line, and male with a yellow line.
The y axis displays the progression rate and is scaled between 0 and 100 per cent.
The x axis shows the relevant year of qualifying for the student population used in the data.
Outcomes for students eligible for free school meals
Overall, students who were eligible for free school meals (FSM) when at school are more likely to report a mental health condition than their counterparts who were not FSM-eligible. In 2021-22, these figures were 5.7 per cent and 4.8 per cent respectively for full-time students.
Continuation, completion and progression rates were lower for students who were eligible for FSM than for those who were not. However, in contrast with most of the other characteristics studied, the differences between students who were and were not eligible are larger among those who did not report a mental health condition than among those who did. Figure 11 illustrates this for continuation rates, although it also applies to completion and progression.
Figure 11: Continuation rates of full-time students who did and did not report having a mental health condition, by free school meal eligibility
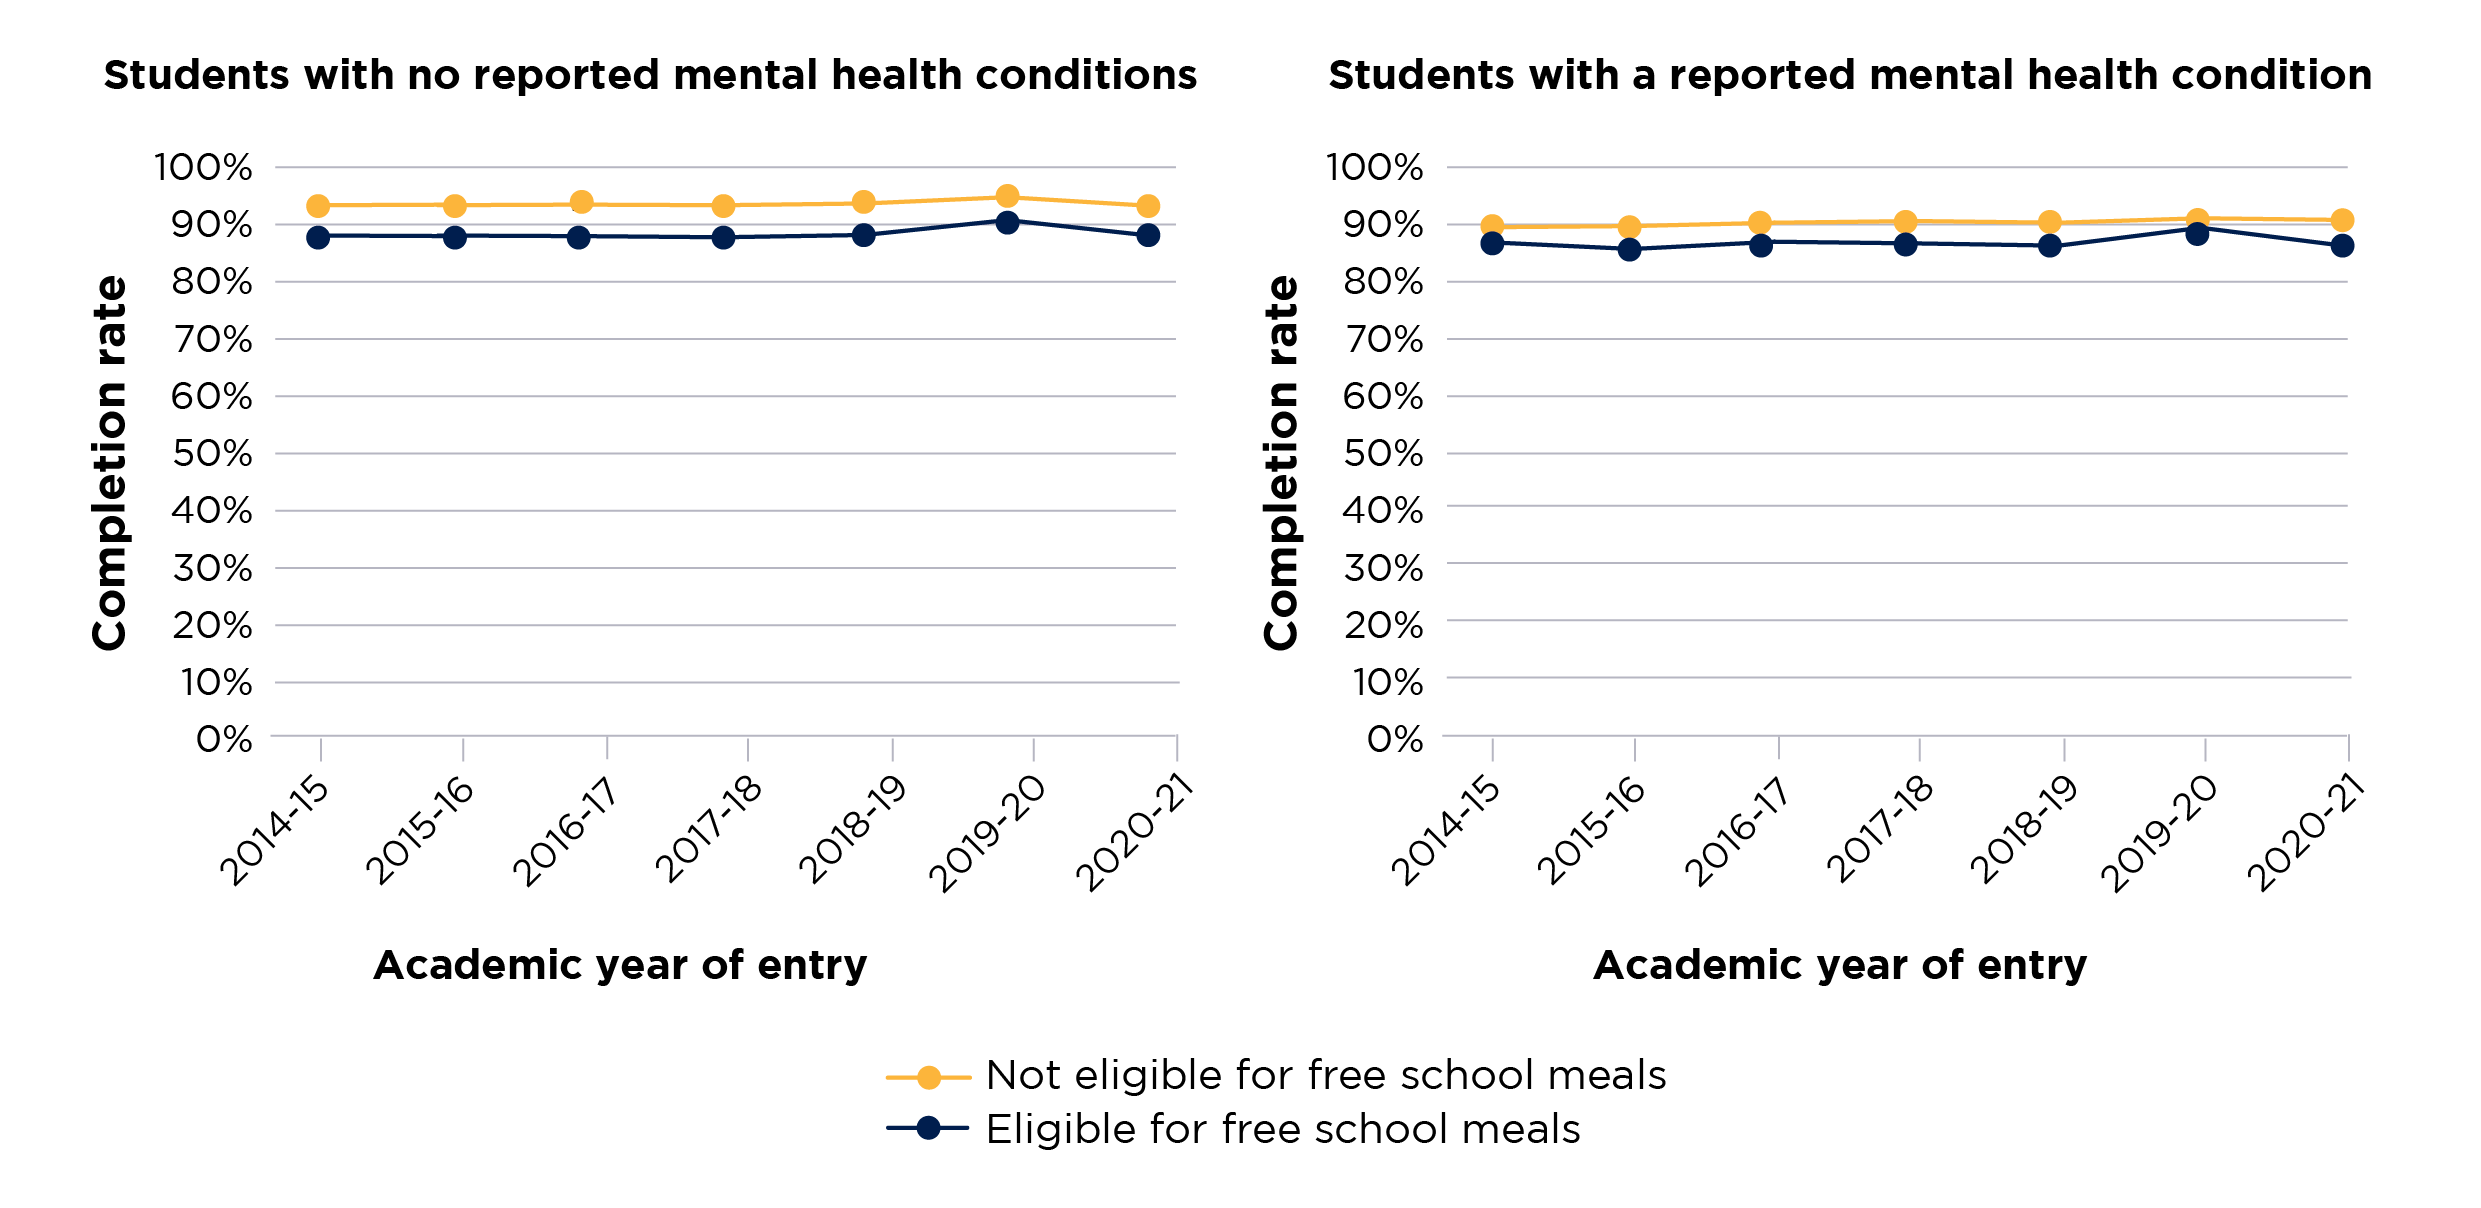
Figure 11 consists of two side-by-side line charts, which show the continuation rates for students who reported having a mental health condition and students who did not, across the years of the time series.
The left chart shows continuation rates for students who reported having a mental health condition, and the chart on the right continuation rates for students who did not report a mental health condition.
There are two solid lines in each chart, which display the rate for each year in the time series for each of the student groups. Students who were eligible for free school meals are shown with a blue line, and students who were not with a yellow line.
The y axis displays the continuation rate and is scaled between 0 and 100 per cent.
The x axis shows the relevant year of entry for the student population used in the data.
Note: Free school meals data is only available from 2014-15 onwards.
Outcomes for students from areas of different levels of relative deprivation
The Index of Multiple Deprivation measures areas of England by relative deprivation, where quintile 1 represents the most deprived areas and quintile 5 the least deprived areas. The latest data we have on UK-domiciled full-time students (2020-21 entrants) shows that the number of students who reported having a mental health condition in each quintile was broadly similar (see Figure 12). However, for part-time students, those from quintile 5 areas were least likely, and those from quintile 1 the most likely, to report having a mental health condition.
Those full-time students who reported a mental health condition had lower continuation, completion and progression rates across all five quintiles than their counterparts who did not. However, no clear pattern emerges across continuation, completion and progression rates regarding how students from different quintiles are impacted.
Figure 12: Proportion of full-time students who started their course in 2021-22 and reported having a mental health condition, by IMD quintile
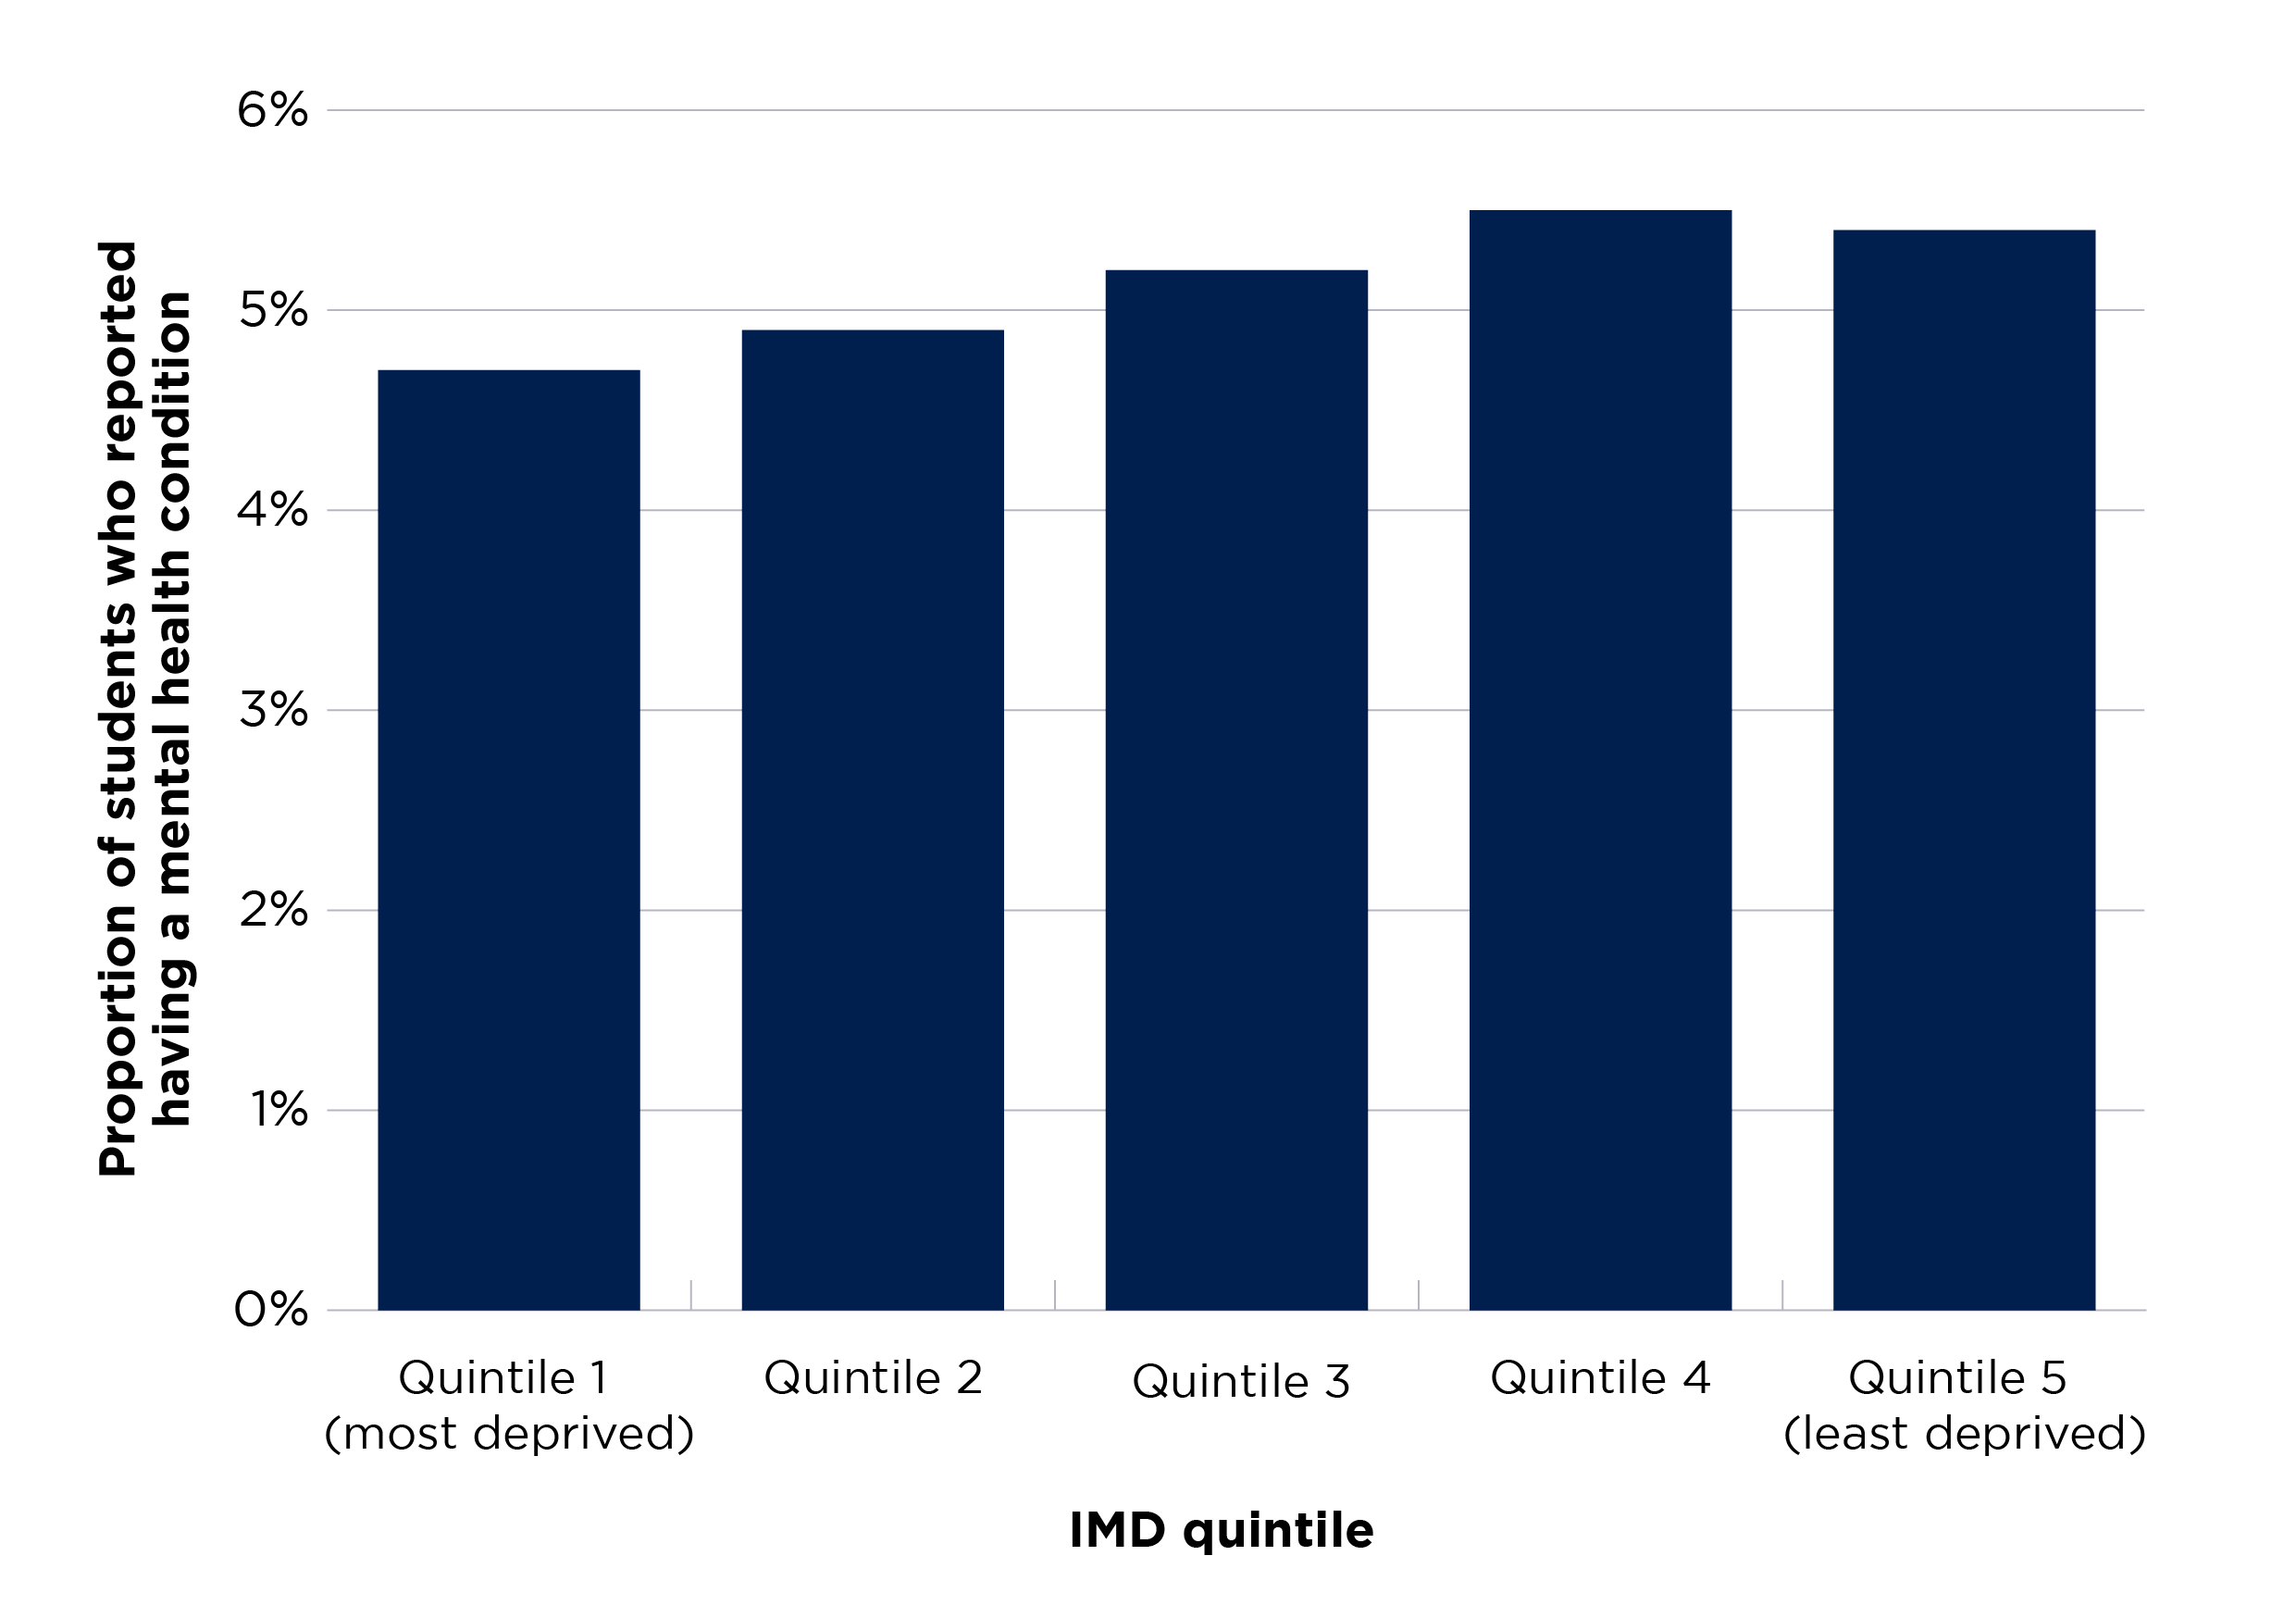
Figure 12 is a bar chart presenting the proportions of full-time students who reported a mental health condition in 2021-22. There are five bars in this chart and each bar shows the proportion for each IMD quintile. The y axis is scaled between 0 and 6 per cent.
Outcomes for students from areas with different rates of young participation in higher education
TUNDRA classifies local areas across England into five equal groups (quintiles) based on the level of young participation in higher education in those areas. The measure used is the proportion of 16-year-old state-funded mainstream school pupils who go on to participate in higher education at the age of 18 or 19 years. Quintile 1 represents the lowest rate of participation and quintile 5 represents the highest rate of participation. The analysis presented in this brief uses middle super output areas as the definition of local areas.
The pattern observed for mental health reporting for full-time entrants from different TUNDRA MSOA quintiles is different from that for IMD quintiles. In 2021-22, entrants from TUNDRA MSOA quintile 1 areas (showing the lowest rate of participation) were the group most likely to have reported a mental health condition (6.0 per cent). Entrants from quintile 5 (showing the highest rate of participation) were the least likely to have reported (4.2 per cent).
The difference in likelihood of reporting of a mental health condition between entrants from TUNDRA MSOA quintiles 1 and 5 has widened throughout the time series. The quickest increase has been for quintile 1, from 0.5 per cent in 2010-11 to 6.0 per cent in 2021-22 (see Figure 13).
Those full-time students who reported a mental health condition had lower continuation, completion and progression rates across all five quintiles than those who did not.
Figure 13: Proportion of full-time students who reported having a mental health condition, by TUNDRA quintile
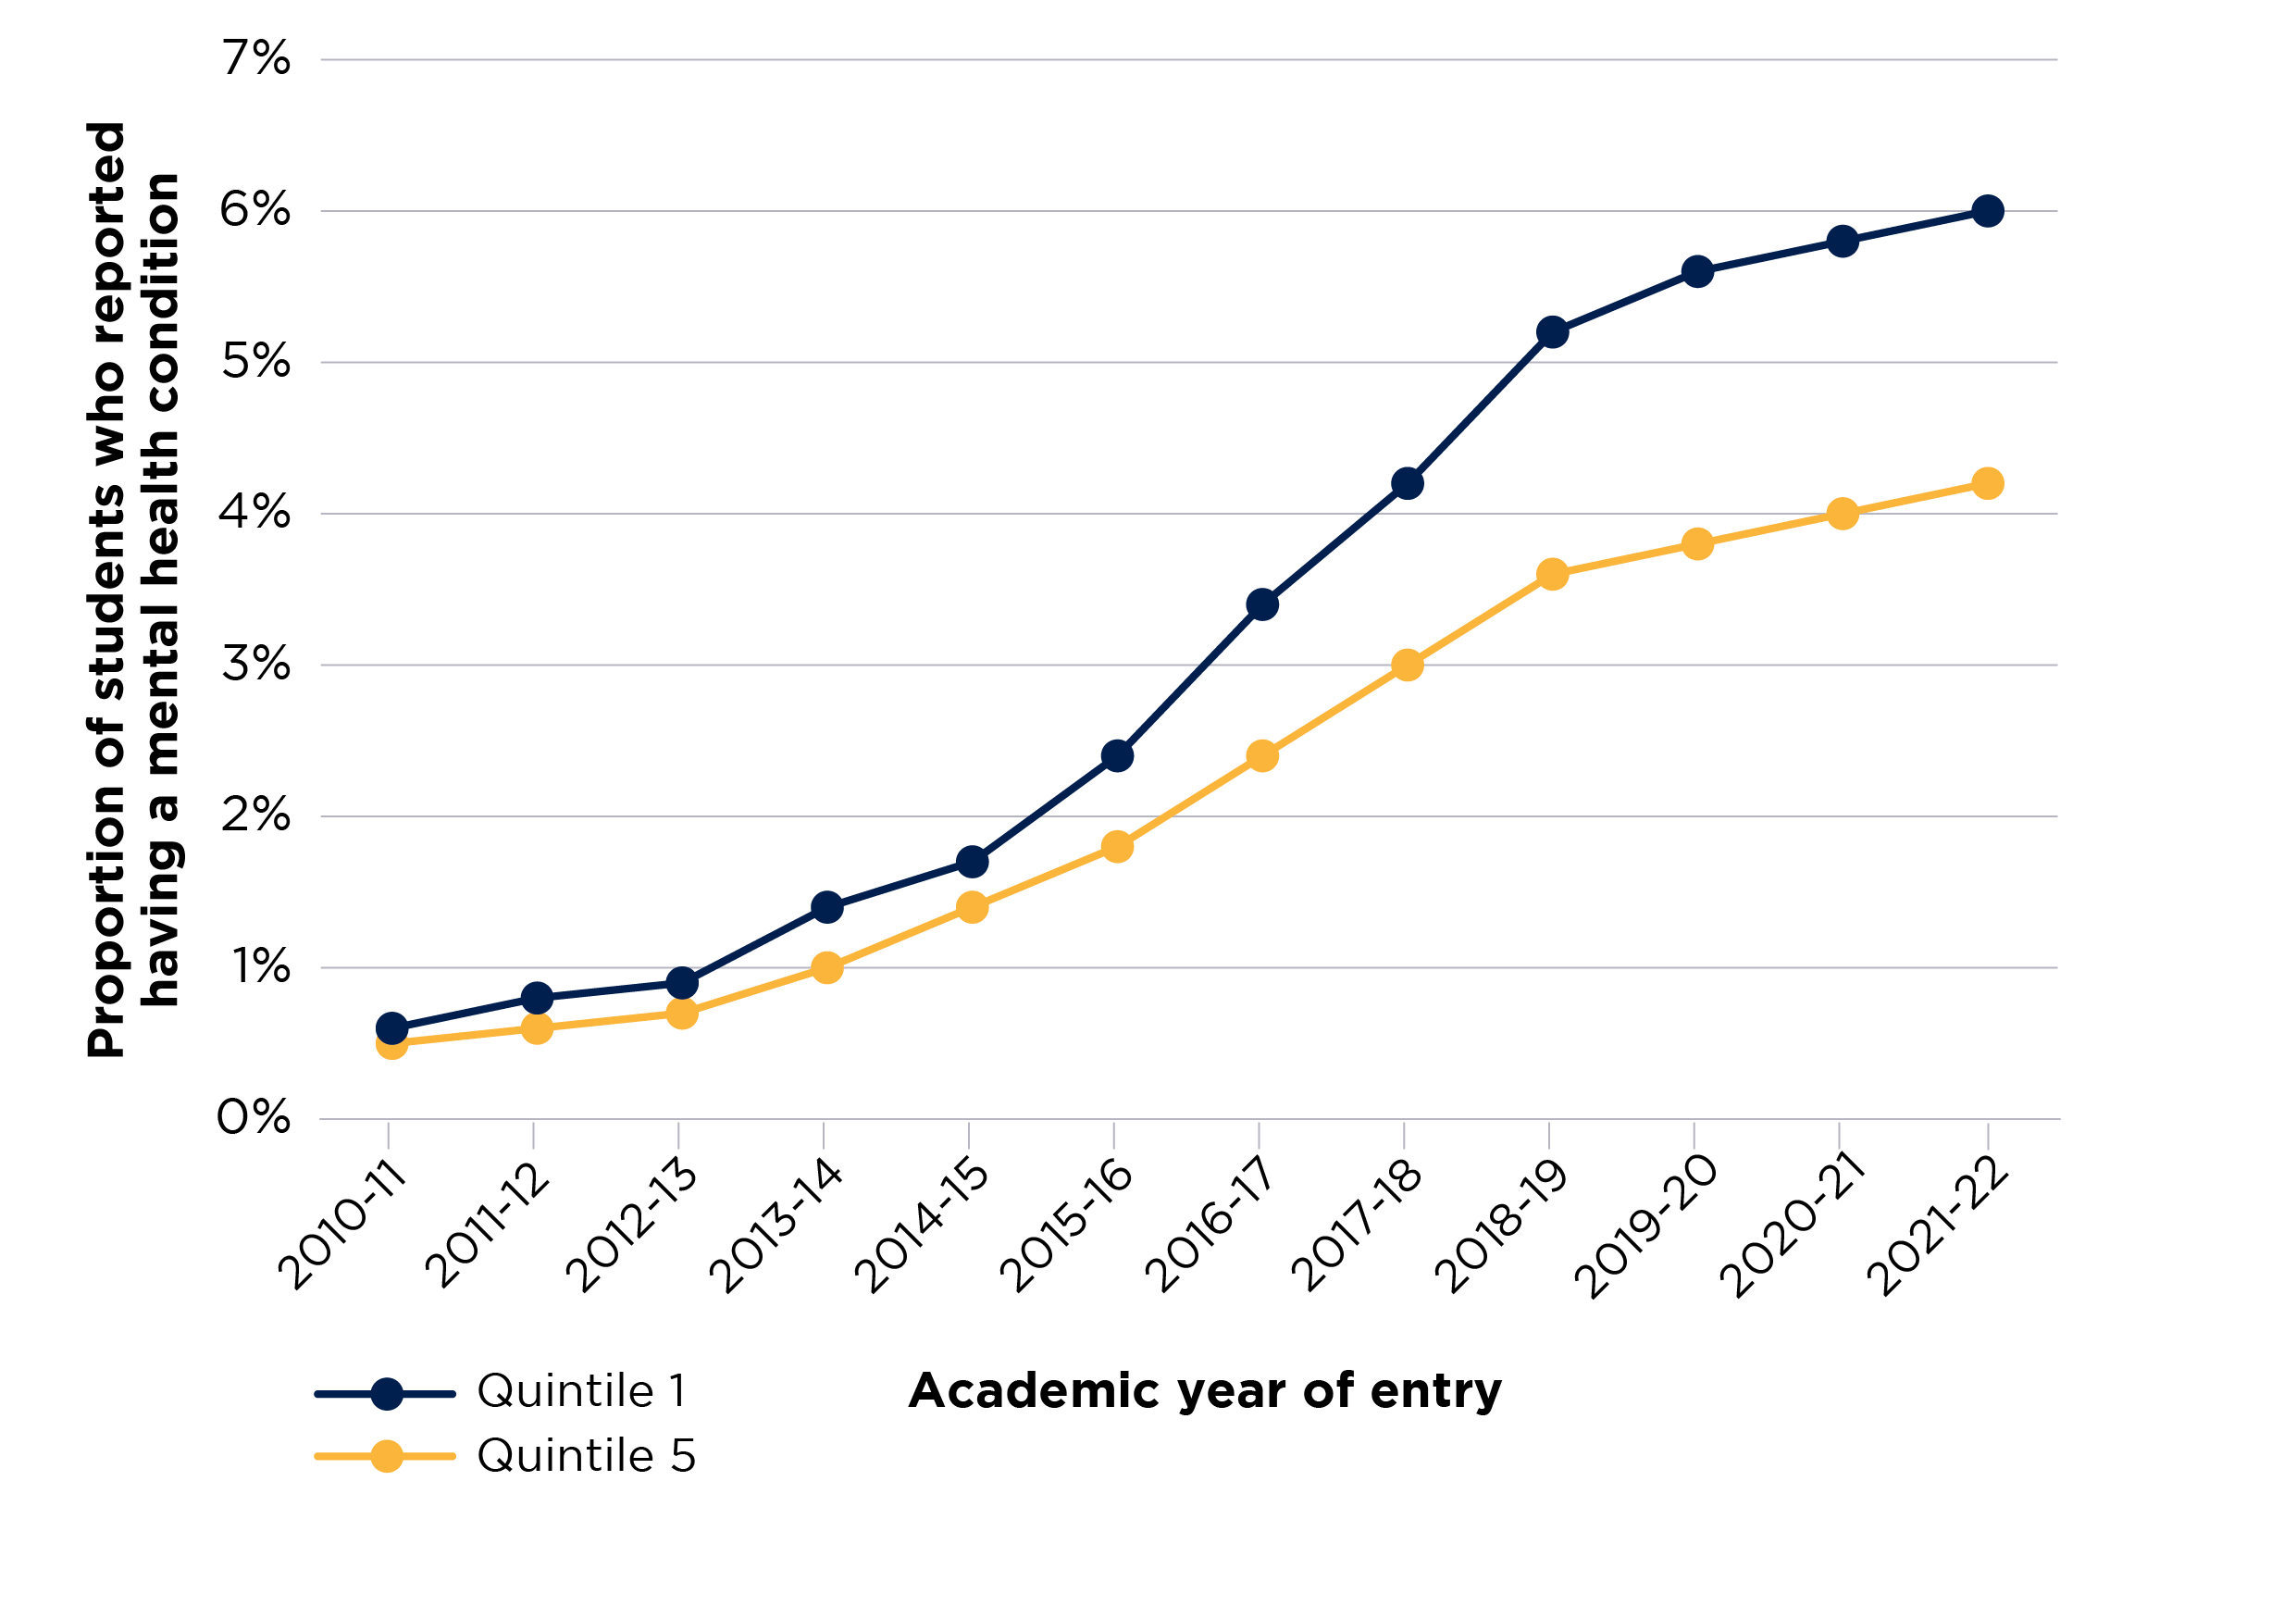
Figure 13 is a line chart that shows the proportion of students who reported having a mental health condition across the years of the time series.
There are two solid lines, which display the proportion of students for each year in the time series for each of the student groups. Students from TUNDRA quintile 1 are shown with a blue line, and those from quintile 5 with a yellow line.
The y axis displays the proportion of students with certain outcomes and is scaled between 0 and 7 per cent.
The x axis shows the relevant year of entry for the student population used in the data.
Outcomes for students from different ethnic groups
For both full-time and part-time undergraduate entrants, students of mixed ethnicity were most likely to report a mental health condition for all academic years from 2010-11 to the latest data available in 2021-22. 6.3 per cent of full-time entrants of mixed ethnicity reported having a mental health condition in 2021-22. The ethnic group of student entrants with the next largest proportion reporting a mental health condition is full-time white students (6.1 per cent in 2021-22). Asian students entering higher education in 2021-22 are the least likely to report a mental health condition (2.7 per cent).
In 2020-21, the largest disparity in continuation rates between full-time entrants with and without a reported mental health condition is for students with a mixed ethnic background. The rate is 4.9 percentage points lower for those who reported such a condition. This is followed by the differences between such students from an ‘other’ ethnic background (4.3 percentage points), and black students (3.7 percentage points) (see Figure 14). These continuation rate differences have decreased for students from white and Asian ethnic backgrounds throughout the time series since 2010-11, but they have increased for students with a mixed ethnicity since 2016-17.
Figure 14: Continuation rates of full-time students, by ethnicity for courses starting in 2020-21
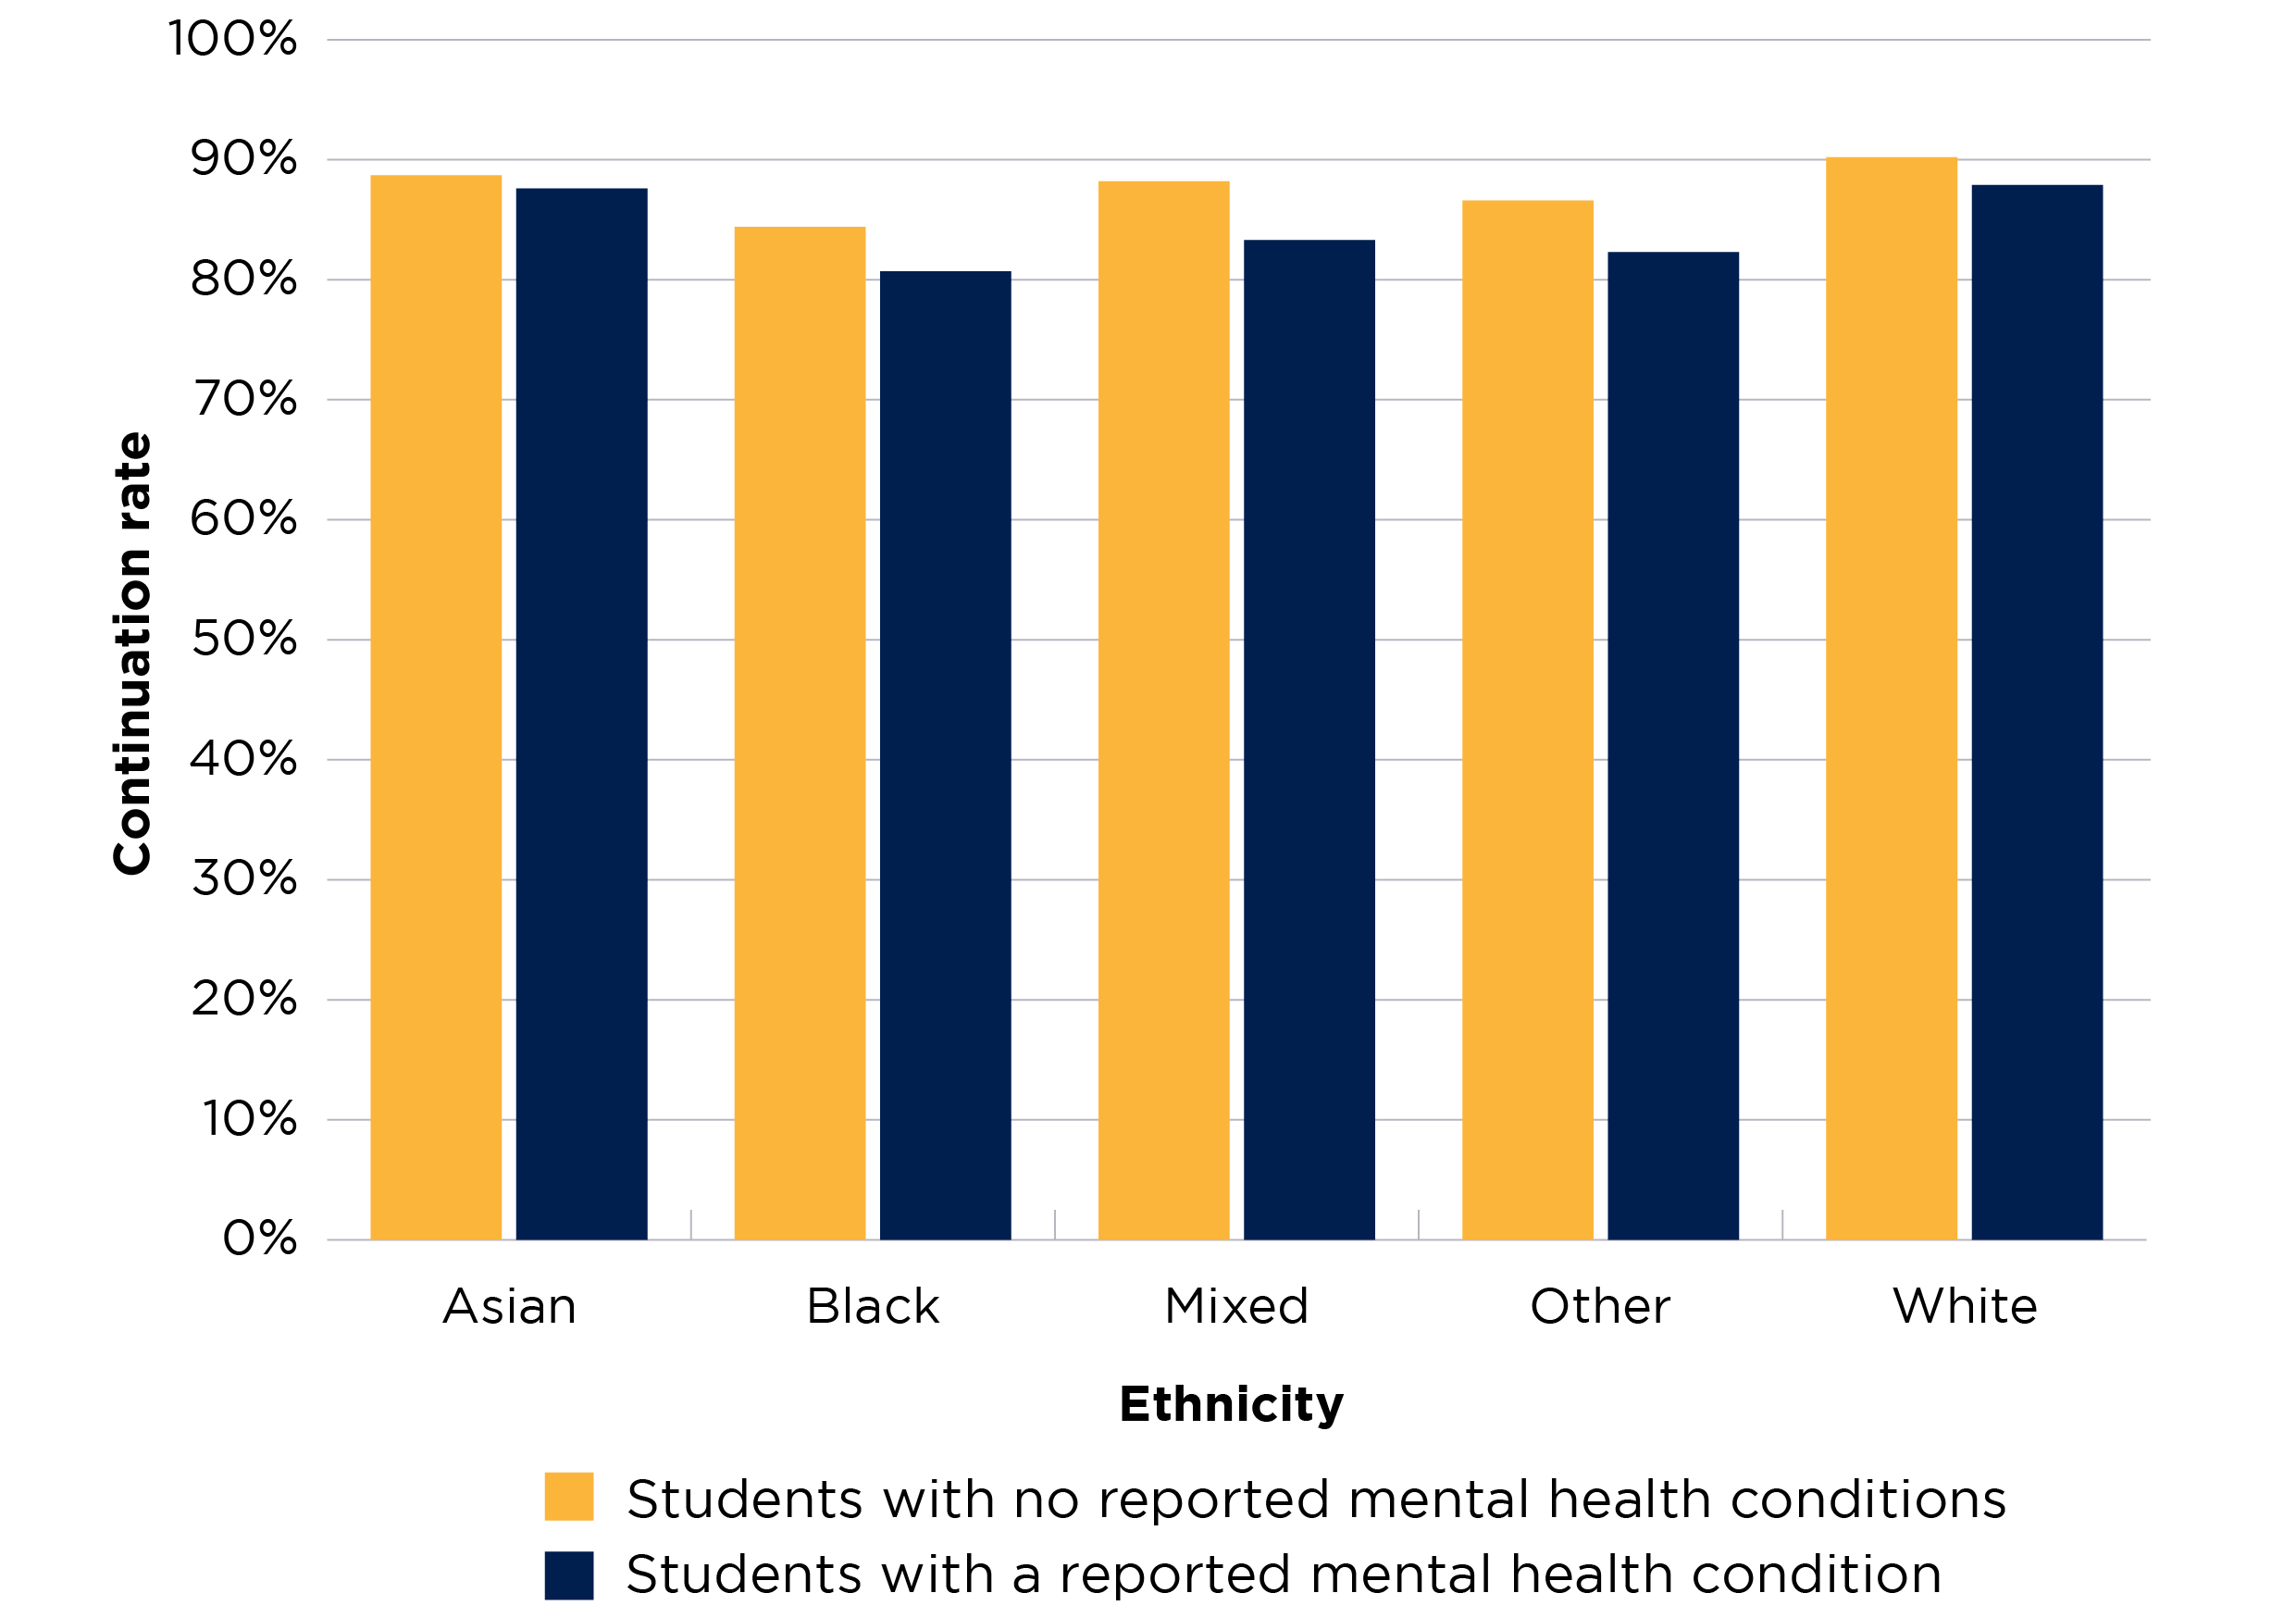
Figure 14 is a bar chart presenting the continuation rates for two groups of students – those who reported a mental health condition, and those who did not.
There are ten bars in this chart – five yellow bars show the rates for students with no reported mental health conditions from each ethnicity, and five blue bars show the rates for students with a reported mental health condition from each ethnicity.
The y axis is scaled between 0 and 100 per cent.
The completion rate for black students entering higher education in 2017-18 is 10.3 percentage points lower if they reported having a mental health condition. This is the largest such disparity for any ethnic group. Asian students have the smallest completion rate difference (2.7 percentage points) (see Figure 15).
Figure 15: Completion rates of full-time students, by ethnicity for courses starting in 2017-18
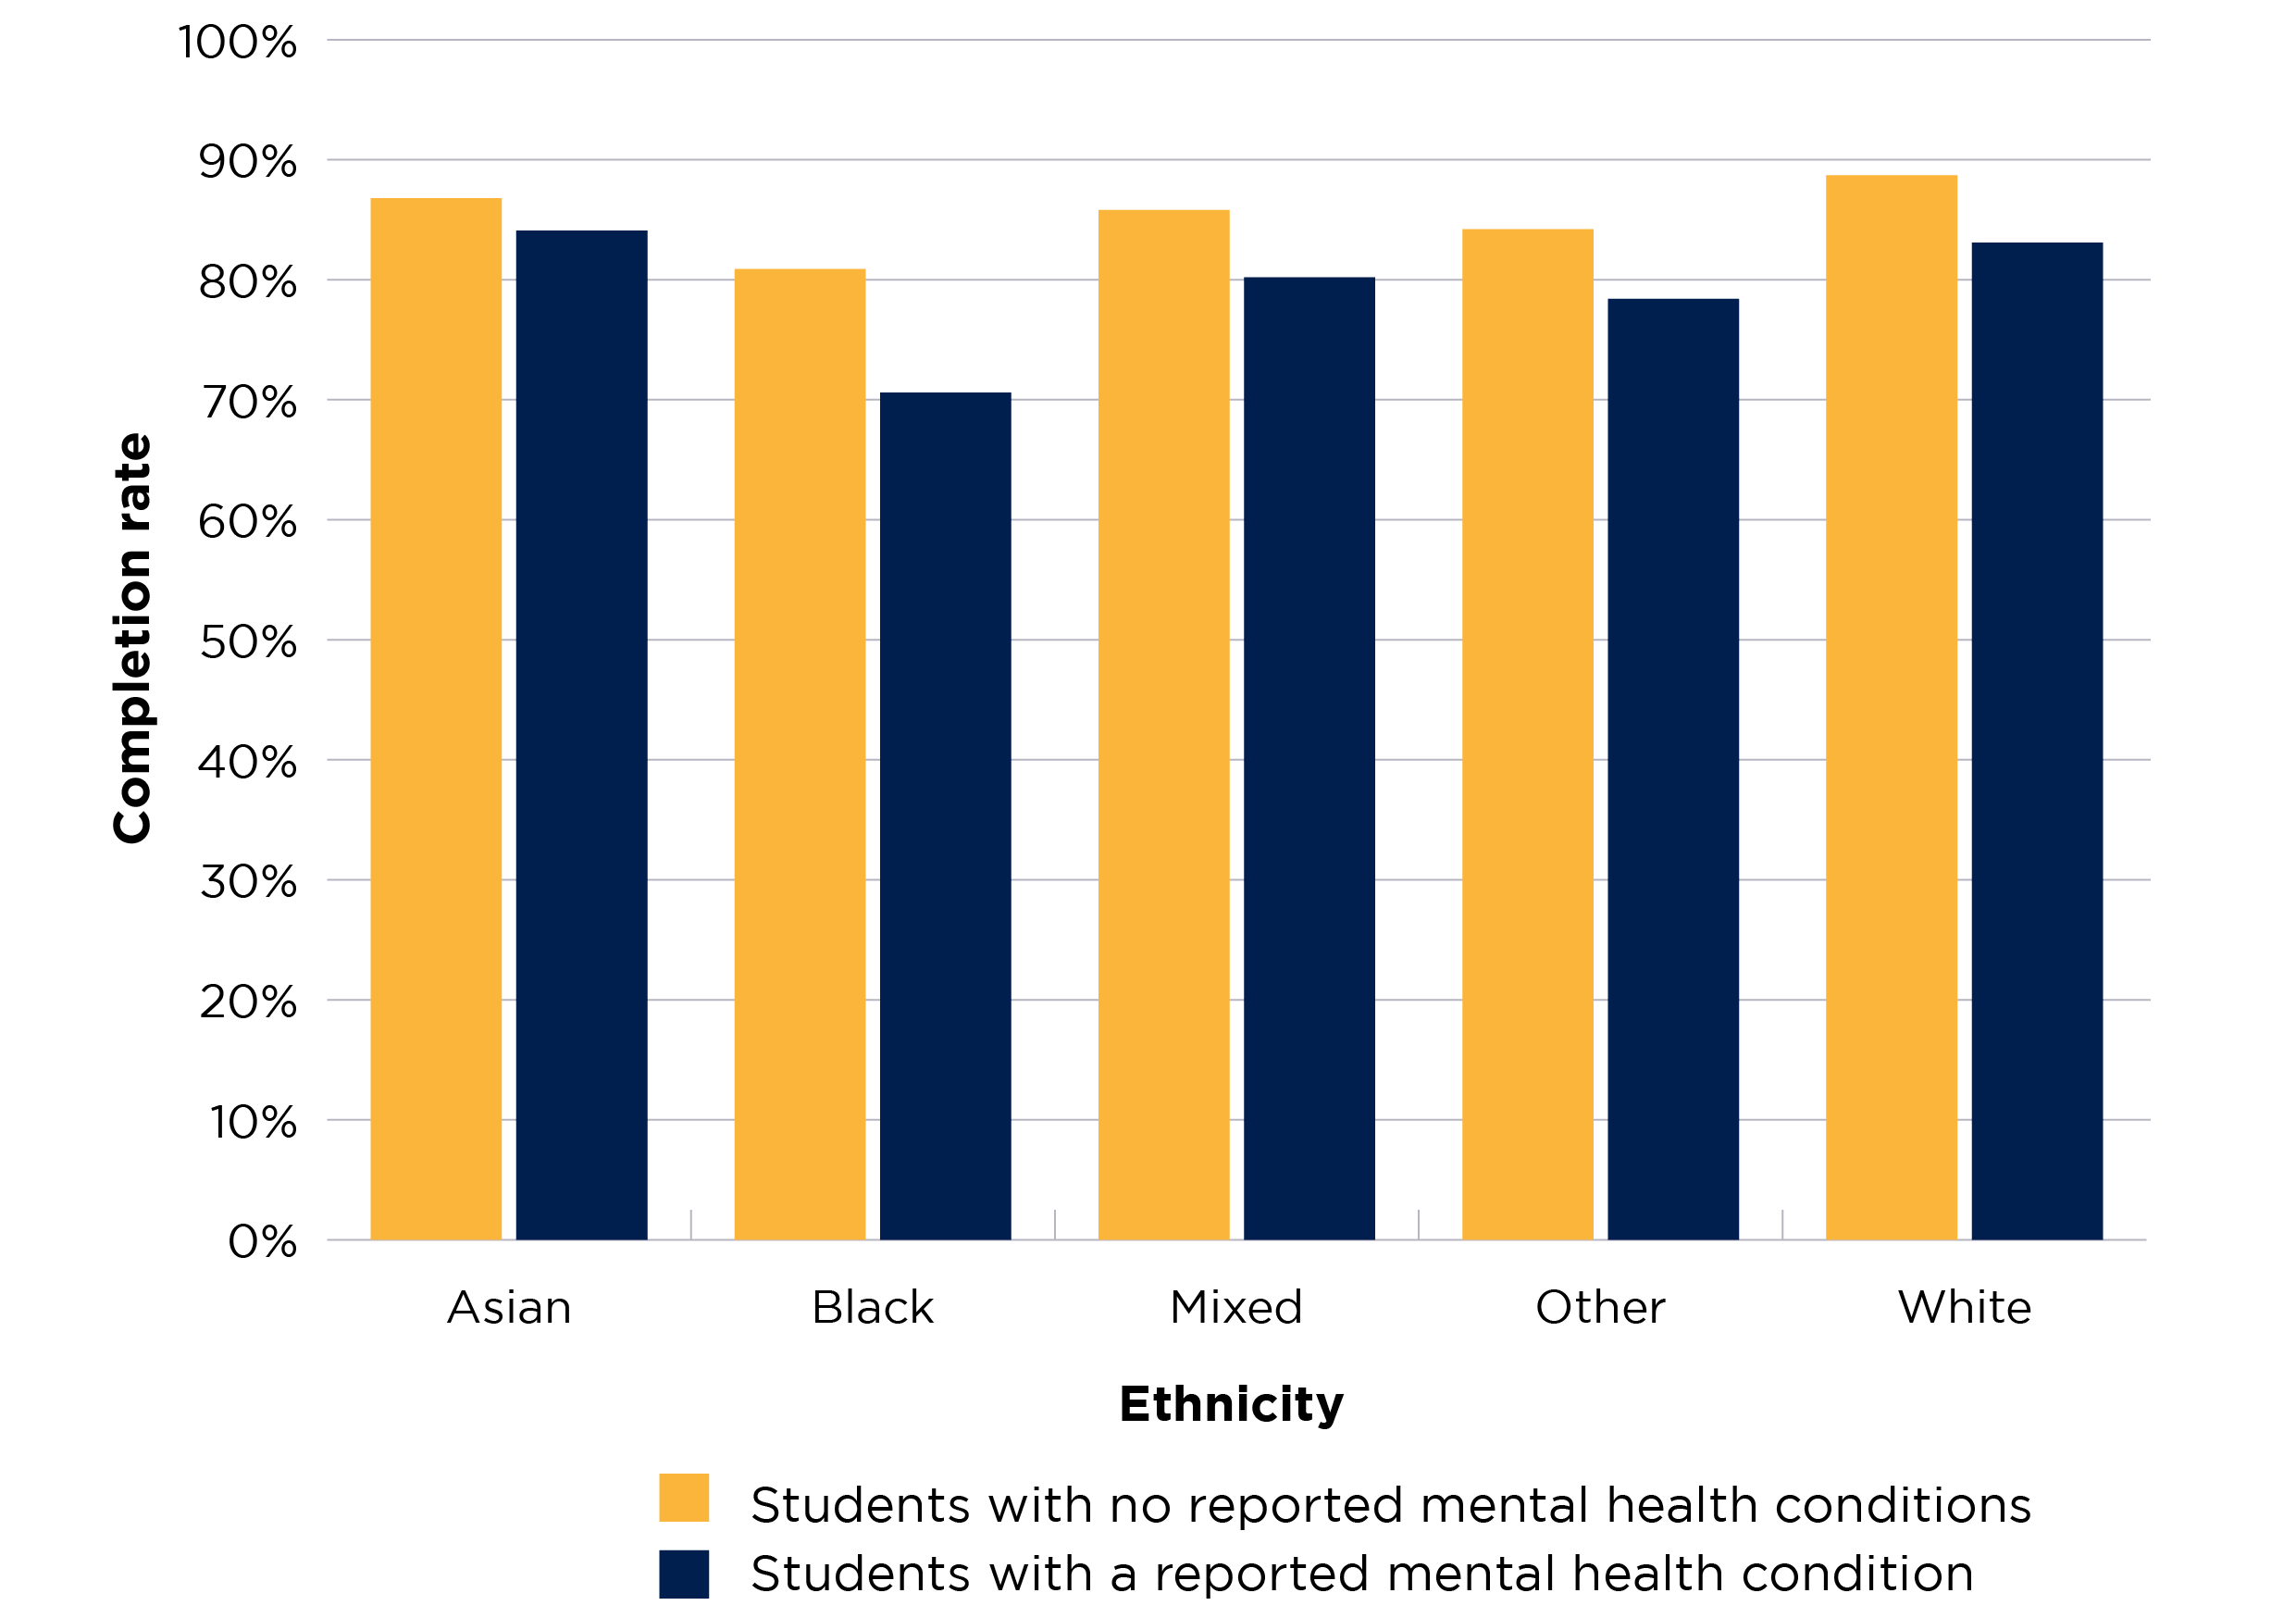
This is a bar chart presenting the completion rates for two groups of students – those who reported a mental health condition, and those who did not.
There are ten bars in this chart – five yellow bars show the rates for students with no reported mental health conditions from each ethnicity, and five blue bars show the rates for students with a reported mental health condition from each ethnicity.
The y axis is scaled between 0 and 100 per cent.
As noted, attainment rates are higher for students who reported having a mental health condition than for those who did not. This applies across most of the student characteristics analysed in the latest year of data, 2021-22. The only exceptions are students from mixed, white and other ethnic backgrounds, although even here the differences between those with a reported mental health condition and those without are very small (0.2, 0.3 and 1.4 percentage points respectively).
Since 2018-19, the attainment rate difference between white students and black students with a reported mental health condition has become smaller than the difference between students from these two groups without a mental health condition. This reverses a previous trend in the time series. In the latest year of data, there was a difference of 18.6 percentage points between white and black students with a reported mental health condition, and a 20.1 percentage points between white and black students without such a condition. This is shown in Figure 16.
Figure 16: Attainment rates of full-time students who did and did not report having a mental health condition, by ethnicity
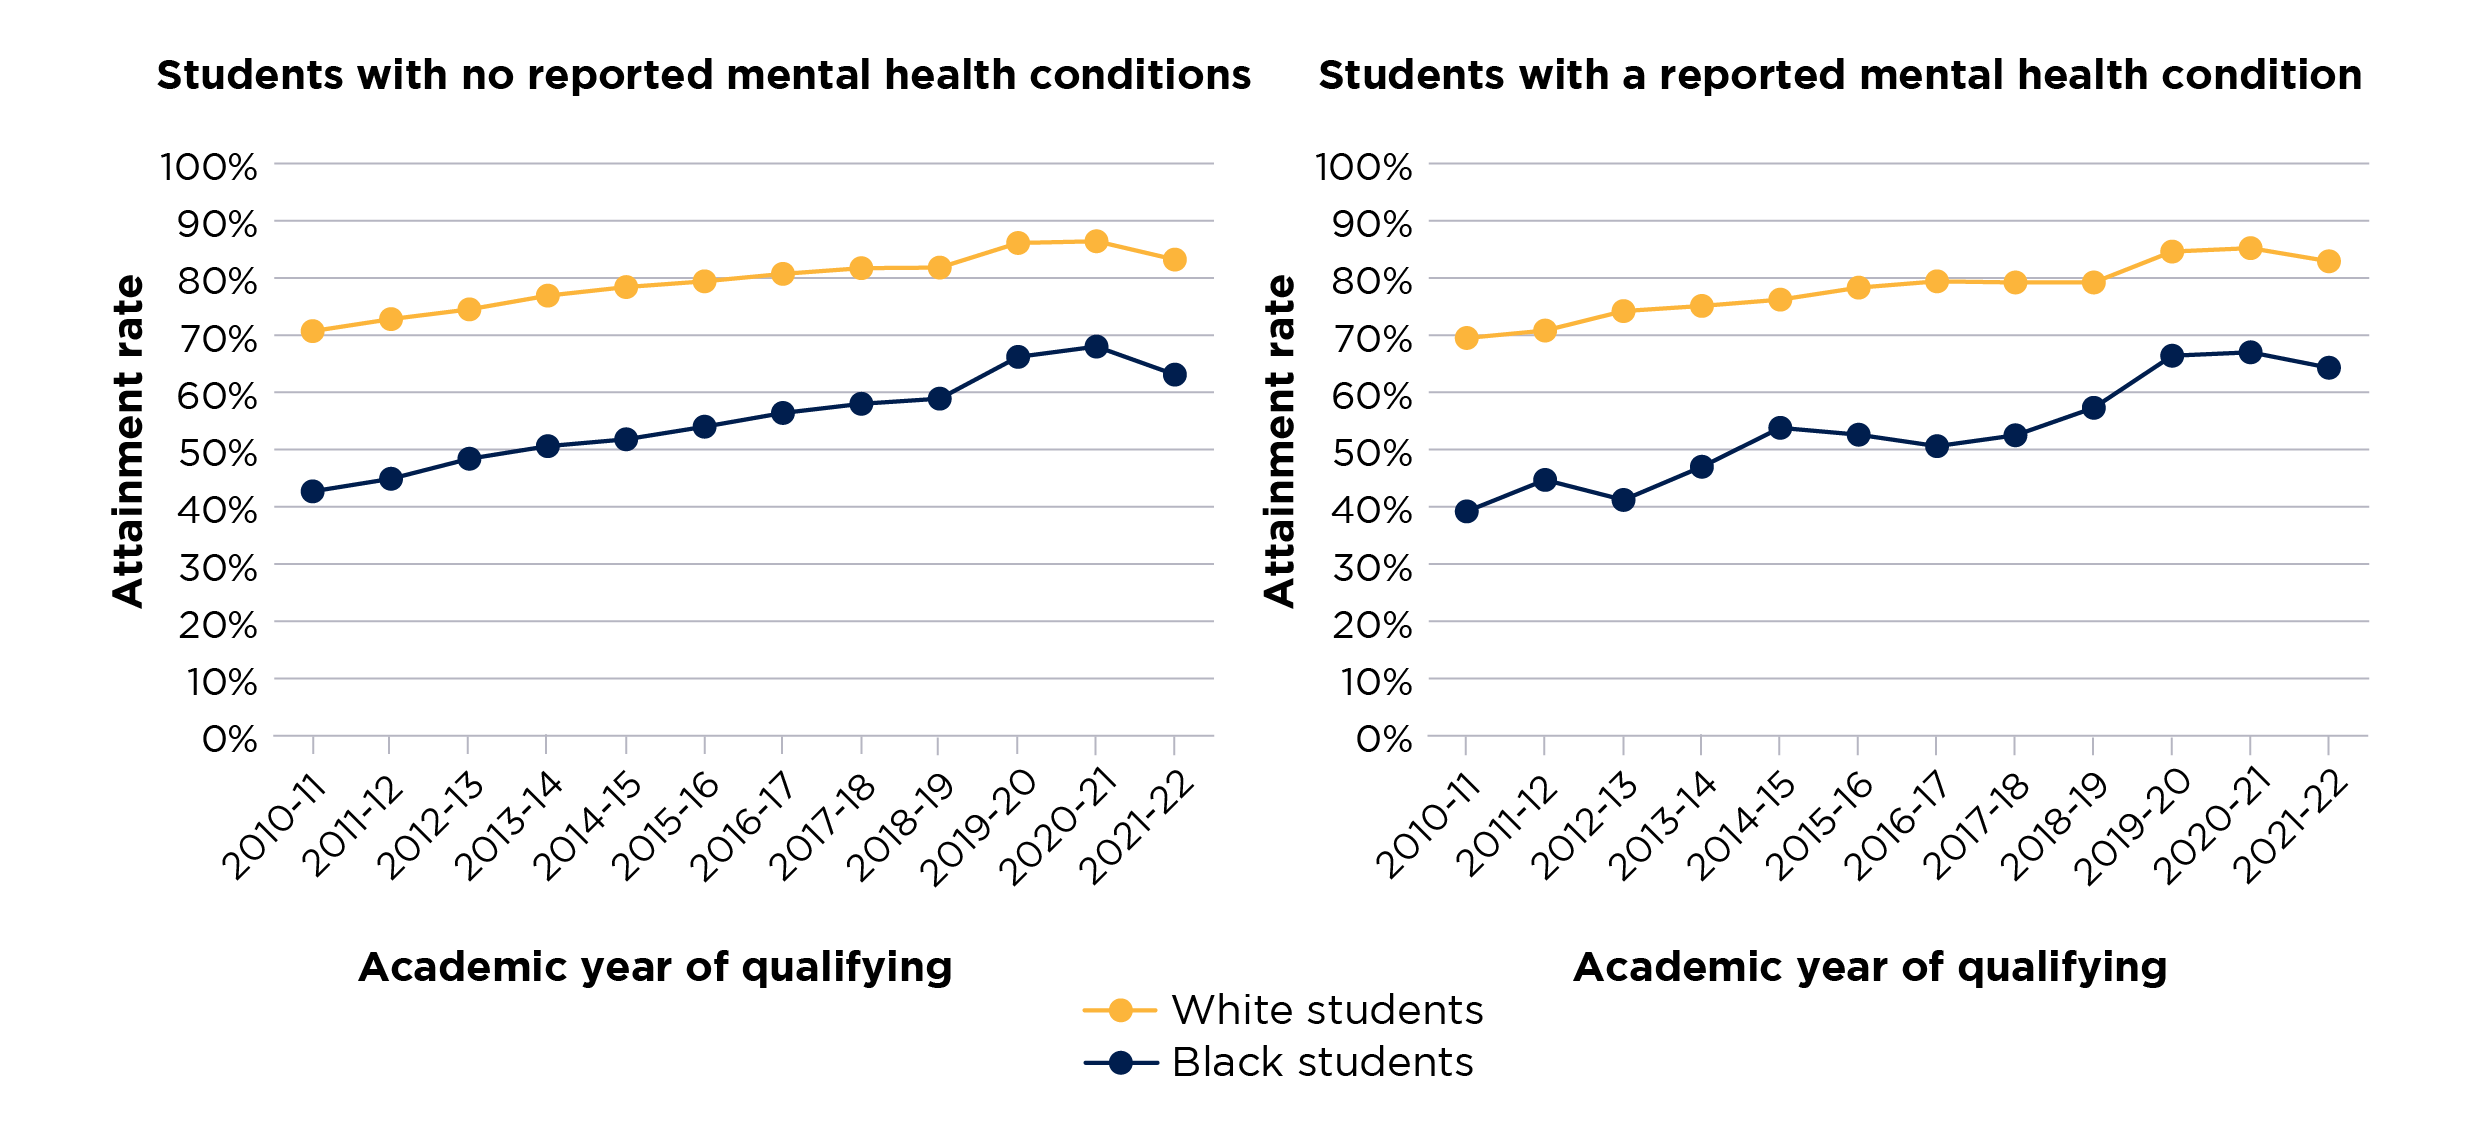
Figure 16 consists of two side-by-side line charts, which show the attainment rates for students who reported having a mental health condition and students who did not, across the years of the time series.
The left chart shows attainment rates for students who reported having a mental health condition, and the chart on the right attainment rates for students who did not report a mental health condition.
There are two solid lines in each chart, which display the rate for each year in the time series for each of the student groups. Black students are shown with a blue line, and white with a yellow line.
The y axis displays the attainment rate and is scaled between 0 and 100 per cent.
The x axis shows the relevant year of qualifying for the student population used in the data.
The progression rates for full-time students qualifying in 2020-21, disaggregated by ethnicity, show a different pattern from that seen for continuation and completion rates. Asian and black students who reported having a mental health condition have higher progression rates than those who did not. The difference among white students is larger than those for other ethnicities (see Figure 17). However, these rates are based on a small number of Asian and black students, as they are the groups least likely to have reported a mental health condition. The completion rate for black students with a mental health condition is also lower than for other ethnic groups, contributing to the small numbers of black students included in the analysis of progression rates.
Figure 17: Progression rates of full-time students, by ethnicity for students qualifying in 2020-21
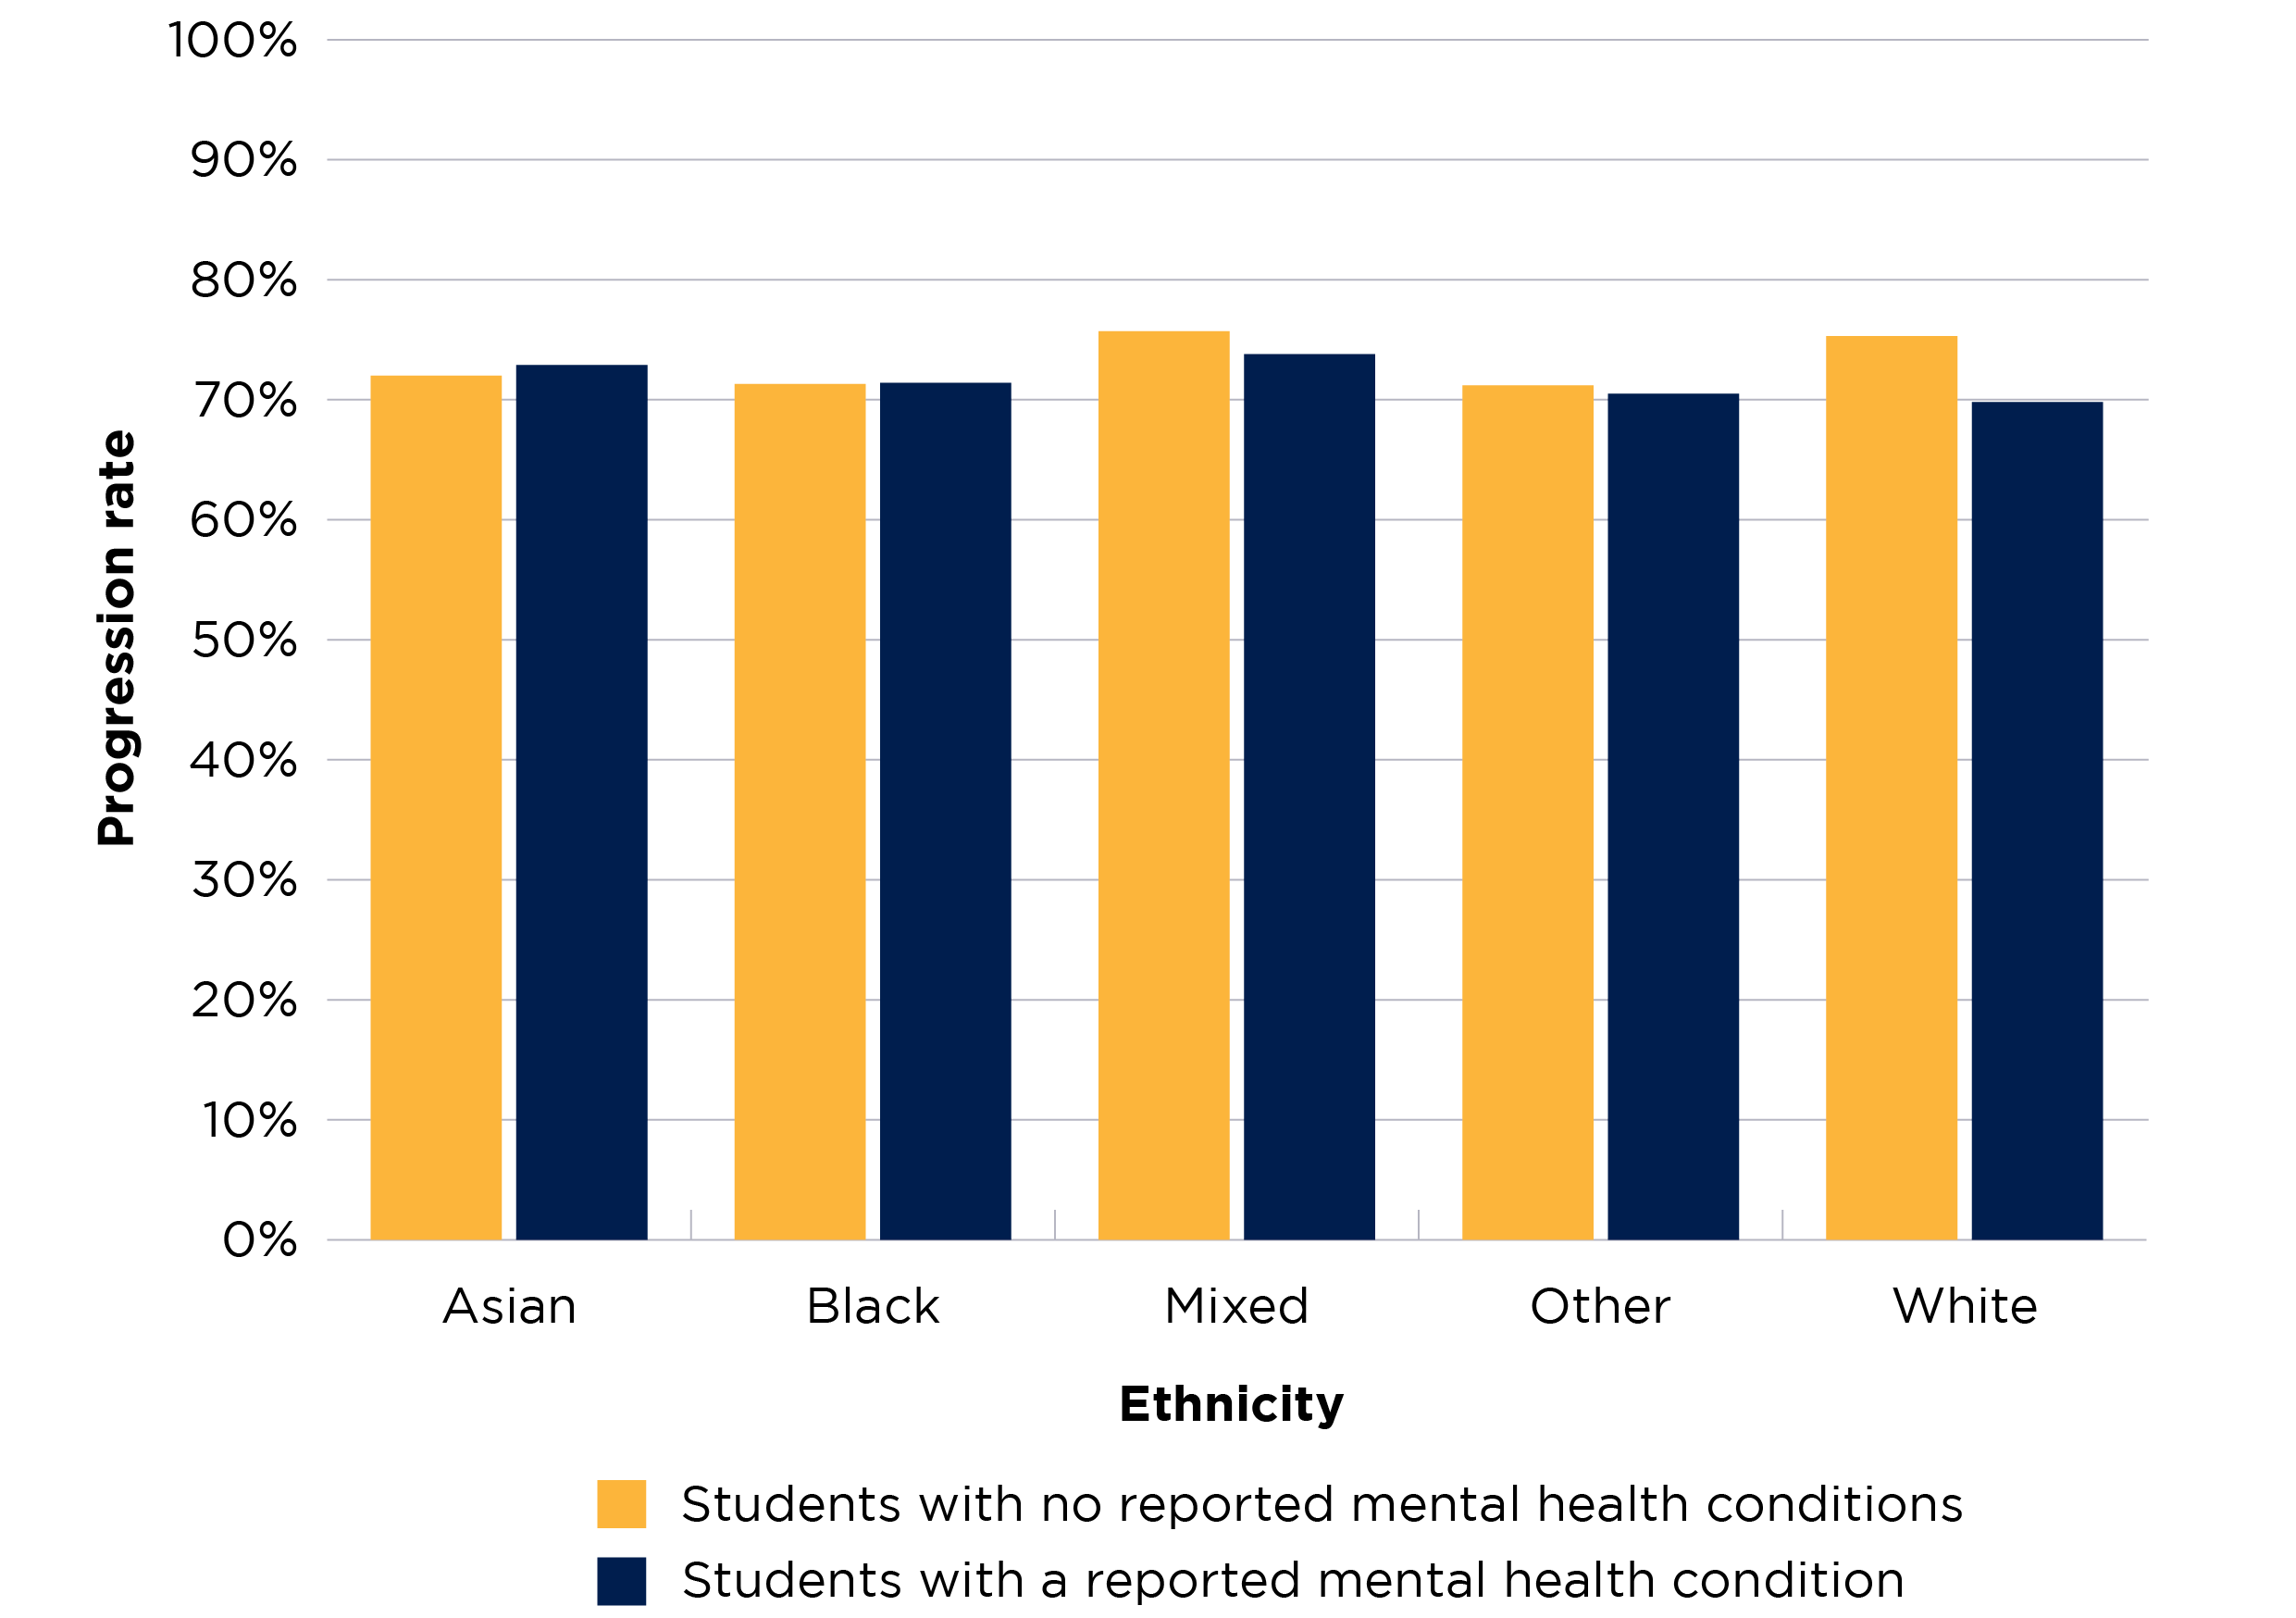
Figure 17 is a bar chart presenting the progression rates for two groups of students – those who reported a mental health condition, and those who did not.
There are ten bars in this chart – five yellow bars show the rates for students with no reported mental health conditions from each ethnicity, and five blue bars show the rates for students with a reported mental health condition from each ethnicity.
The y axis is scaled between 0 and 100 per cent.
What the OfS is doing
The data analysis in this brief is part of a range of activities carried out by the OfS related to mental health among students. We work to ensure that the universities and colleges registered with us create an environment conducive to the good mental health and wellbeing students need to succeed in their higher education. We also want to ensure that they recognise and respond to the differing mental health needs of specific student groups. It is important to note, however, that individual universities and colleges are responsible for developing their own mental health policies and procedures.
We do this work through our funding of mental health related projects, collaboration with a range of partners and groups across the higher education sector, the publication of mental health related data (including the data published in this brief), and our regulation of equality of opportunity.
The OfS’s regulatory approach to mental health support
Funding mental health projects: We fund external projects to develop and support effective practice on mental health among students across the higher education sector. Examples of funded projects include the Student Mental Health Evidence Hub, led by the Centre for Transforming Access and Student Outcomes (developing a digital hub of evidence, evaluation, examples of practice and resources for what works in supporting mental health among students); facilitating discussions between universities and NHS providers through our ‘action learning sets’ project; and Student Space (an online platform to support students' mental health and wellbeing).26
We have allocated £15 million for mental health funding to universities and colleges in 2022-23 via our strategic priorities grant, and £41 million in disabled students premium funding (which includes funding for students with mental health conditions).27
We have funded universities and colleges to develop innovative solutions to tackle poor mental health among students and share their findings and resources, such as through the Mental Health Challenge Competition and the Mental Health Funding Competition. We have invested around £9 million of funding in these programmes to date, with co-investment from the successful higher education providers and their project partners.28
Collaboration: We work with a range of partners and groups across the higher education sector to bring together universities, voluntary sector organisations and government departments. We have also funded or part-funded sector-level guidance, such the University Mental Health Charter, led by Student Minds; the ‘Suicide-safer universities’ guidance, developed by Universities UK and PAPYRUS; and Universities UK’s advice for universities on responding to a death by suicide (written in partnership with PAPYRUS and the Samaritans).29
Publication of data: We publish the access and participation dashboard to encourage universities and colleges to take a targeted approach to addressing risks to equality of opportunity. This dashboard shows data for individual higher education providers across different student characteristics.30 We also publish data from across the higher education sector on student characteristics related to population, outcomes and associations between groups of students, including those with a reported mental health condition.31 This year, we published the results of a new question in the National Student Survey on how well universities and colleges communicate information about their mental wellbeing services to students.32
Regulating risks to equality of opportunity: Our regulatory guidance encourages universities and colleges to consider the risk to equality of opportunity due to mental health when preparing their access and participation plans.33 Mental health is included as a sector-wide risk in our Equality of Opportunity Risk Register.34
We have also recently published updates to Regulatory Notice 1 and Regulatory Advice 6. These give more information about how universities and colleges should consider and address risks to equality of opportunity in their access and participation plans regarding outcomes for students with a declared mental health condition as a disability. All providers are expected to include outcomes for students with mental health conditions (disaggregated from wider disability) in their assessment of performance.35
Conclusion
This brief offers an analysis of data on the outcomes for different student groups at the level of the whole higher education sector, where this is available. Further research is needed to understand why disparities in student outcomes occur and how to address them effectively.
There has been a lot of recent work, across the sector and in individual universities and colleges, on improving support for students with poor mental health. We encourage universities and colleges to consider the findings presented in this brief in their continuing work on mental health among students; to consider the risks presented in our Equality of Opportunity Risk Register; and to also look at their own cohorts and contexts when planning and delivering mental health interventions.
Universities and colleges registered with the OfS should have regard to the Equality of Opportunity Risk Register when writing their access and participation plans. It can be used to consider the various risks that different groups of students might face and the ways these risks may interact. From this, they can consider how they can contribute to reducing them.36 It is also important that students, particularly those with lived experience of poor mental health, are involved in co-creating mental health strategies and support at their university or college. Where appropriate, this should include students from groups who may be more at risk of poor mental health and face specific barriers to accessing support.37
Some key findings to consider from our analysis are:
- There has been a broad trend of increased reporting to universities and colleges of mental health conditions by students entering higher education. However, the number of students reporting them remains low: 4.5 per cent of full-time students and 5.3 per cent of part-time students in England in 2021-22.
- Looking at overall full-time undergraduate data throughout the time series, there are differences in continuation, completion, and progression rates between those students who report having a mental health condition to their university or college and those who do not. Our analysis also shows that some student groups are more likely to report a mental health condition, and that having such a condition affects the outcomes of specific student groups differently.
- Part-time undergraduate students are more likely to report having a mental health condition than full-time students. In 2021-22, 5.3 per cent of part-time entrants reported such a condition, compared with 4.5 per cent of full-time entrants.
- Mature full-time entrants to higher education are more likely to report a mental health condition than their younger counterparts (4.9 per cent compared with 4.3 per cent in 2021-22). Progression rates are lower across the time series for both full-time mature and full-time young students who did so.
- Female students are more likely to report having a mental health condition than male students (6.3 per cent of full-time female entrants, compared with 2.3 per cent of male full-time entrants in 2021-22). The rate of reporting for female students has increased dramatically throughout the time series (from year of entry 2010-11 to 2021-22).
- Since 2016-17, entrants to full-time courses who were eligible for free school meals when at school have been more likely to report having a mental health condition than those who were not eligible (5.7 per cent compared with 4.8 per cent in 2021-22).
- Full-time students who reported a mental health condition had lower continuation, completion and progression rates across all five IMD quintiles than their counterparts without a reported mental health condition. However, no clear pattern emerges across continuation, completion and progression rates regarding how students from different quintiles are impacted by mental health conditions.
- Full-time students from TUNDRA MSOA quintile 1 areas (showing the lowest rate of participation in higher education in England) are most likely to have reported a mental health condition (6.0 per cent in 2021-22). The difference in reporting a mental health condition between entrants from quintile 1 and quintile 5 has widened throughout the time series, with the rate of reporting a mental condition for entrants from quintile 1 increasing more quickly.
- For both full-time and part-time undergraduate entrants, students of mixed ethnicity were most likely to report a mental health condition throughout the time series. 6.3 per cent of full-time entrants of mixed ethnicity did so in 2021-22.
- The completion rate for black students entering higher education in 2017-18 is 10.3 percentage points lower if they reported having a mental health condition. This is the largest such disparity for any ethnic group.
- Since 2018-19, the attainment rate difference between white and black students without a reported mental health condition has become smaller than the difference between students from these two groups with such a condition.
The OfS will continue its work on encouraging and supporting higher education environments that are conducive to good mental health for all student groups. The OfS is part of the government’s new Higher Education Mental Health Implementation Taskforce, which looks at best practice in mental health support for students, and will produce a plan for improvement in mental health support for students in higher education.38
The Student Mental Health Evidence Hub (led by the Centre for Transforming Access and Student Outcomes and funded by the OfS) is launching on the day of publication of this brief (19 October 2023).39 The Hub provides information, evidence and evaluation guidance that universities and colleges can use to improve the efficacy of their mental health support for students.
We also intend to publish learning from partnership work between the NHS and higher education providers in late 2023; and, in 2024, the final evaluation report (written by Wavehill) of projects funded under our Mental Health Funding Competition.
Notes
- In this brief, for the sake of readability, we have used ‘universities and colleges’, or sometimes simply ‘universities’, to refer to what our regulatory framework and other more formal documents call ‘higher education providers’.
- See Office for Students (OfS), ‘Key performance measures’, last updated August 2023.
- OfS, ‘Risk 8: Mental health’, last updated March 2023.
- Office for National Statistics (ONS), ‘Coronavirus and higher education students: 25 February to 7 March 2022’, 2022; OfS, ‘Coronavirus briefing note. Supporting student mental health’, 2020; OfS, ‘Studying during rises in the cost of living’ (OfS Insight brief #17), 2023.
- OfS, ‘Mental health Challenge Competition: Achieving a step change in mental health outcomes for all students’, last updated July 2023; OfS, ‘Mental health funding competition: Using innovation and intersectional approaches to target mental health support for students’, last updated May 2023.
- See University Mental Health Charter.
- Universities UK, ‘Stepchange: Mentally healthy universities’, last updated February 2023.
- See Student space.
- Department for Education, ‘HE providers’ policies and practices to support student mental health’, 2023. A survey of all OfS-registered higher education providers. The survey took place between 11 May and 27 July 2022. The overall response rate was 45 per cent (179 respondents). There was also qualitative research: 75 in-depth interviews conducted across 33 higher education providers, from 27 June to 1 September 2022.
- OfS, ‘National Student Survey data: Provider level’, last updated August 2023. This year’s National Student Survey was open to students from 11 January to 30 April 2023. In England, 276,675 students responded to this question, a response rate of 71.3 per cent.
- OfS, ‘Office for Students Strategy 2022 to 2025’ (OfS 2022.15), 2022, p15.
- OfS, ‘Risk 8: Mental health’, last updated March 2023.
- OfS, ‘Mental health: Are all students being properly supported?’ (OfS Insight brief #5), 2019.
- OfS, ‘Mental health funding competition: Using innovation and intersectional approaches to target mental health support for students’, last updated May 2023.
- OfS, ‘Mental health funding competition: Using innovation and intersectional approaches to target mental health support for students’, last updated May 2023.
- Wavehill, ‘Co-creating intersectional student mental health initiatives: Lessons from the mental health funding competition’, OfS, 2022.
- Gov.UK, ‘National statistics: English indices of deprivation 2019’, published September 2019. ‘The English indices of deprivation measure relative deprivation in small areas in England called lower-layer super output areas. The index of multiple deprivation is the most widely used of these indices.’ See also OfS, ‘Young participation by area’, last updated September 2022. TUNDRA is an area-based measure of young participation in higher education at age 18 or 19 for state-funded mainstream school students in England. It classifies local areas across England using middle super output area and lower super output area according to this young participation rate.
- OfS, ‘Student characteristics data’, last updated July 2023. Comparisons should not be made between the data presented in this brief and those in Insight brief #5, because of differences in the ways in which data was analysed. However, a time series is provided in this brief and in the accompanying analysis report, which uses consistent analytical approaches, allowing for comparisons over time.
- OfS, ‘Analysis of data of students reporting a mental health condition’ (OfS 2023.55), 2023.
- See OfS, ‘Student characteristics: Technical document’, 2023.
- See UCAS, ‘450% increase in student mental health declarations over last decade but progress still needed to address declarations stigma’, June 2021; Wavehill, ‘Co-creating intersectional student mental health initiatives: Lessons from the mental health funding competition’, OfS, 2022.
- For more information on how poor mental health affects specific student groups and specific groups in the general population, see OfS, ‘Office for Students funding competition: Using innovation and intersectional approaches to target mental health support for students’ (OfS 2020.14), 2020, pp9-11; Mind, ‘Mental health facts and statistics’, published June 2020; Wavehill, ‘Co-creating intersectional student mental health initiatives: Lessons from the mental health funding competition’, OfS, 2022, key findings on pp3-5; the health inequalities reports by Students Minds available at Reports: Student Minds.
- OfS, ‘Analysis of data of students reporting a mental health condition' (OfS 2023.55), 2023.
- Office for National Statistics, ‘Cost of living and depression in adults, Great Britain: 29 September to 23 October 2022’, December 2022. The analysis is based on 4,266 adults aged 16 years and over in England, Scotland and Wales with a valid depression score. Survey weights were applied to make estimates representative of the population. This research used the patient health questionnaire PHQ8 to identify forms of depression.
- Department for Education, ‘HE providers’ policies and practices to support student mental health’, 2023. A survey of all OfS-registered higher education providers. The survey took place between 11 May and 27 July 2022. The overall response rate was 45 per cent (179 respondents). There was also qualitative research: 75 in-depth interviews conducted across 33 higher education providers, from 27 June to 1 September 2022.
- OfS, ‘Student mental health’, last updated July 2023.
- OfS, ‘Funding for academic year 2022-23: OfS decisions’ (OfS 2022.28), 2022, p8.
- OfS, ‘Mental health Challenge Competition: Achieving a step change in mental health outcomes for all students’, last updated July 2023; OfS, ‘Mental health funding competition: Using innovation and intersectional approaches to target mental health support for students’, last updated May 2023.
- See University Mental Health Charter; Universities UK and PAPYRUS, ‘Suicide-safer universities’, 2018; Universities UK, ‘Responding to a suicide: Advice for universities’, 2022.
- OfS, ‘Access and participation data dashboard’, last updated July 2023.
- OfS, ‘Student characteristics data’, last updated July 2023.
- OfS, ‘National Student Survey data: Provider level’, August 2023.
- Access and participation plans set out how higher education providers will improve equality of opportunity for underrepresented groups to access, succeed in and progress from higher education. See OfS, ‘Access and participation plans’, last updated March 2023.
- OfS, ‘Risk 8: Mental health’, last updated March 2023.
- OfS, ‘Regulatory notice 1: Access and participation plan guidance’ (OfS 2023.15), 2023; OfS, ‘Regulatory advice 6: How to prepare an access and participation plan – Supplementary access and participation plan guidance’ (OfS 2023.21), 2023.
- OfS, ‘Equality of Opportunity Risk Register’, March 2023. Access and participation plans set out how higher education providers will improve equality of opportunity for underrepresented groups to access, succeed in and progress from higher education.
- Wavehill, ‘Co-creating intersectional student mental health initiatives: Lessons from the mental health funding competition’, OfS 2022.
- Gov.UK, ‘Higher education mental health implementation taskforce’, 2023.
- See TASO, ‘Student Mental Health Evidence Hub’.
Describe your experience of using this website