As we reflect on this year’s National Student Survey results, it seems many disabled students are still not receiving the same quality of experience as their peers.

The National Student Survey (NSS) has been a fixture of the English higher education world for 20 years. According to evidence provided by the survey, much has improved for students in those two decades but, for some groups, the picture is less comfortable. As universities and colleges digest their individual results, the OfS is especially concerned about the experiences of disabled students – and the persistent gap between their reported experiences and those of other students.
Disabled students’ perceptions
Disabled students make up a significant minority of the student population in England (20 per cent). Yet this year’s NSS results, like those from recent years and other available data, show that while disabled students may join higher education in numbers proportionate to the wider population, once there they consistently view their experience less positively than students who don’t report a disability.
Thirty years on from the passage of the Disability Discrimination Act, and 15 years on from the Equality Act, it cannot be good enough that this gap in experience is widespread across the sector, and so persistent across time.
The OfS’s Equality of Opportunity Risk Register identifies 12 sector-wide risks that may affect a student’s opportunity to access, and succeed in, higher education. Disabled students are more likely to come up against many of these throughout their higher education. They include risks in areas such as:
- knowledge and skills
- academic support
- personal support
- mental health
- capacity issues relating to accessing resources.
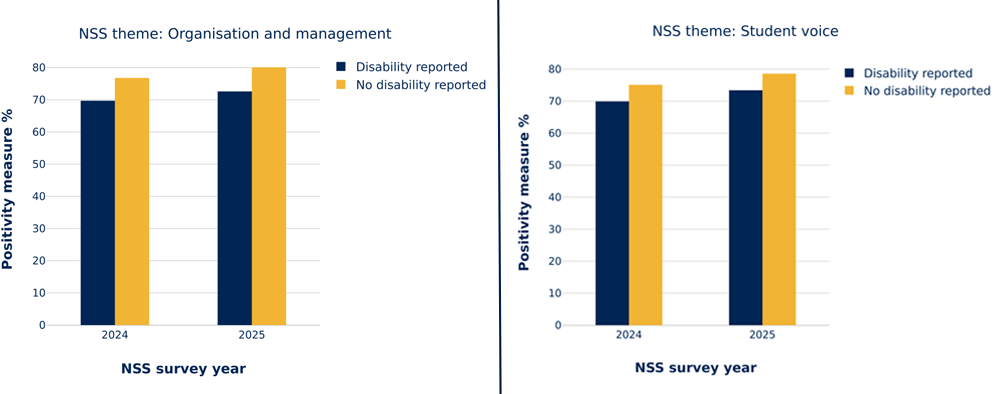
The 2025 NSS results show that disabled students feel less well served than their non-disabled peers in several key areas, including student voice and organisation and management. While we have seen small improvements in scores since 2024 for both disabled and non-disabled students, in some cases the gap between the two groups is getting wider.
We know this from looking at not just the ‘positivity’ measure (i.e. the proportion of respondents who gave a positive answer), but also the ‘benchmarked score’. We construct benchmarks for particular groups of students and each question – these are sector averages, which we adjust based on the characteristics of the group we’re interested in.
Benchmarks are important when trying to understand NSS results for students with different characteristics, because they can help us understand whether the positivity measure for a particular group is higher or lower than we’d expect when taking everything else into account. Again, this shows us that the experiences of disabled students fall behind those of their peers.
Gaps in student experience
We can also evaluate the data by the following reported disability types:
- mental health condition
- sensory, medical or physical impairment
- social or communication impairment
- cognitive or learning difficulties
- multiple or other impairments.
Whichever way we cut the data, though, we should always remember that behind the statistics are real people and their experiences.
Let’s look at some of the biggest gaps shown in this year’s data.
Students with a reported disability were less positive about assessment and feedback on their course, with results for the last two years significantly below the benchmark.
Significantly below the benchmark are the results for students with mental health conditions (-3.2 per cent) and with multiple or other impairments (-3.6 per cent). If we explore some of the questions in this theme, we see that students with a mental health condition (-3.1 per cent) and those with multiple or other impairments (-3.3 per cent) are less likely to say their assessment has allowed them to demonstrate what they have learnt, pointing perhaps to a need to ensure appropriate reasonable adjustments are in place.
Organisation and management scores for students with a disability have been significantly below the benchmark for the last two years, with results varying by disability type. For example, students with a mental health condition are -4.3 per cent below benchmark, those with cognitive or learning difficulties are at -3.2 per cent, and students with multiple or other impairments are at -5.5 per cent.
Perhaps most concerning is the continued gap in student voice scores. This suggests that some universities and colleges need to increase their efforts to listen to and act on feedback from disabled students. Students with a mental health condition (-4.0 per cent), and with multiple or other impairments (-4.2 per cent), are significantly below the benchmark.
When we look at results for academic support by disability type, students with multiple or other impairments fall significantly below the benchmark. The lower scores for this theme are consistent with Risk 6 on our Equality of Opportunity Risk Register, which highlights that disabled students may not receive the personalised academic support they need to succeed.
Regardless of entry qualifications, students may require different levels of support due to their individual circumstances, such as health conditions or special educational needs that might affect the way they can engage with their studies.
For learning resources, students with cognitive or learning difficulties (-3.0 per cent) and students with multiple or other impairments (-3.6 per cent) were less likely to say that IT resources and facilities had supported their learning. Students with multiple or other impairments (-4.1 per cent) also found it harder to access subject-specific resources when they needed them. This aligns with Risk 11 (capacity issues relating to resources).
When asked about the balance of directed and independent study under the learning opportunities theme, students with a mental health condition are -3.4 per cent below benchmark and those with multiple or other impairments are -3.1 per cent below benchmark.
In summary
The latest NSS results underline the need for renewed effort across the higher education sector to address the comparatively poor experience of many disabled students. Besides these results, there is other significant evidence of the disparity in experience between disabled and non-disabled students (in particular, Access Insights from Disabled Students UK, and the OIA annual report which explains that disabled students are overrepresented in complaints).
So, how might institutions respond to this?
- Universities and colleges should invest time engaging with their disabled students on the issues highlighted in their NSS data, listening and addressing the gaps. They should draw on other available guidance and evidence to support them in developing actions and approaches, including ensuring that they’re meeting their obligations to disabled students under the Equality Act 2010.
- The OfS is committed to supporting disabled students to have an inclusive and positive experience of higher education. In 2024, we established the Disability in Higher Education Advisory Panel, to provide expert advice on improving disabled students’ experiences by reviewing how they are currently supported. Using sector evidence, research and analysis, the panel makes recommendations to help shape the OfS’s approach in this area. With its term recently extended until late March 2026, the panel will reconvene at the end of July.
The experience of disabled students will continue to be a focus for us.
We plan to share further research on this in the autumn, to inform sector work to bridge the gap between disabled students’ experiences and those of their peers, ensuring they receive the rights Parliament first guaranteed three decades ago.
Comments
Report this comment
Are you sure you wish to report this comment?