English higher education 2019: The Office for Students annual review
Value for money
One of our four primary objectives is that all students, from all backgrounds, receive value for money. We secure value for money in return for the contributions made by individual students and taxpayers, in terms of student participation, experience and outcomes, high continuation rates and good degrees which hold their value over time. This chapter looks at students’ conceptions of value for money, how the OfS is responding to its own need to give value for money, and what the sector and the OfS need to do over the coming year.
What is value for money?
Growing student expectations
The tripling of fees in 2012 increased expectations of value for money. This reform was met by widespread student protests and warnings of a fall in student numbers. Many of these forecasts have not come to pass. For example, the fee change has not resulted in a fall in the number of 18-year-olds from disadvantaged backgrounds entering higher education.141 Nor has it resulted in a substantial fall in students’ satisfaction with their degrees, which remains high at 83 per cent.142 A 2018 survey of 1,505 young people by Universities UK showed that 54 per cent of respondents agreed that students should contribute to the cost of their education.143
The understanding of what ‘value’ means among students is neither uniform nor unchanging. For many, value is understood in economic terms: they want a degree that will confer the skills to get a well-paid job. For others, it is measured academically, in getting to study with world-leading experts on a particular topic. And for some, it is meant in terms of the broader experience they get at university, for instance by getting involved with their students’ union. While government policies and legislation have long situated students as consumers, and indeed many of the mechanisms for protecting them are predicated on this positioning, many students resist this label.
The value of a degree, therefore, is a complex mix of academic expertise and excellent teaching, job opportunities and transferable skills, cultural capital and institutional prestige. Value for money encompasses a vast array of topics and interests.
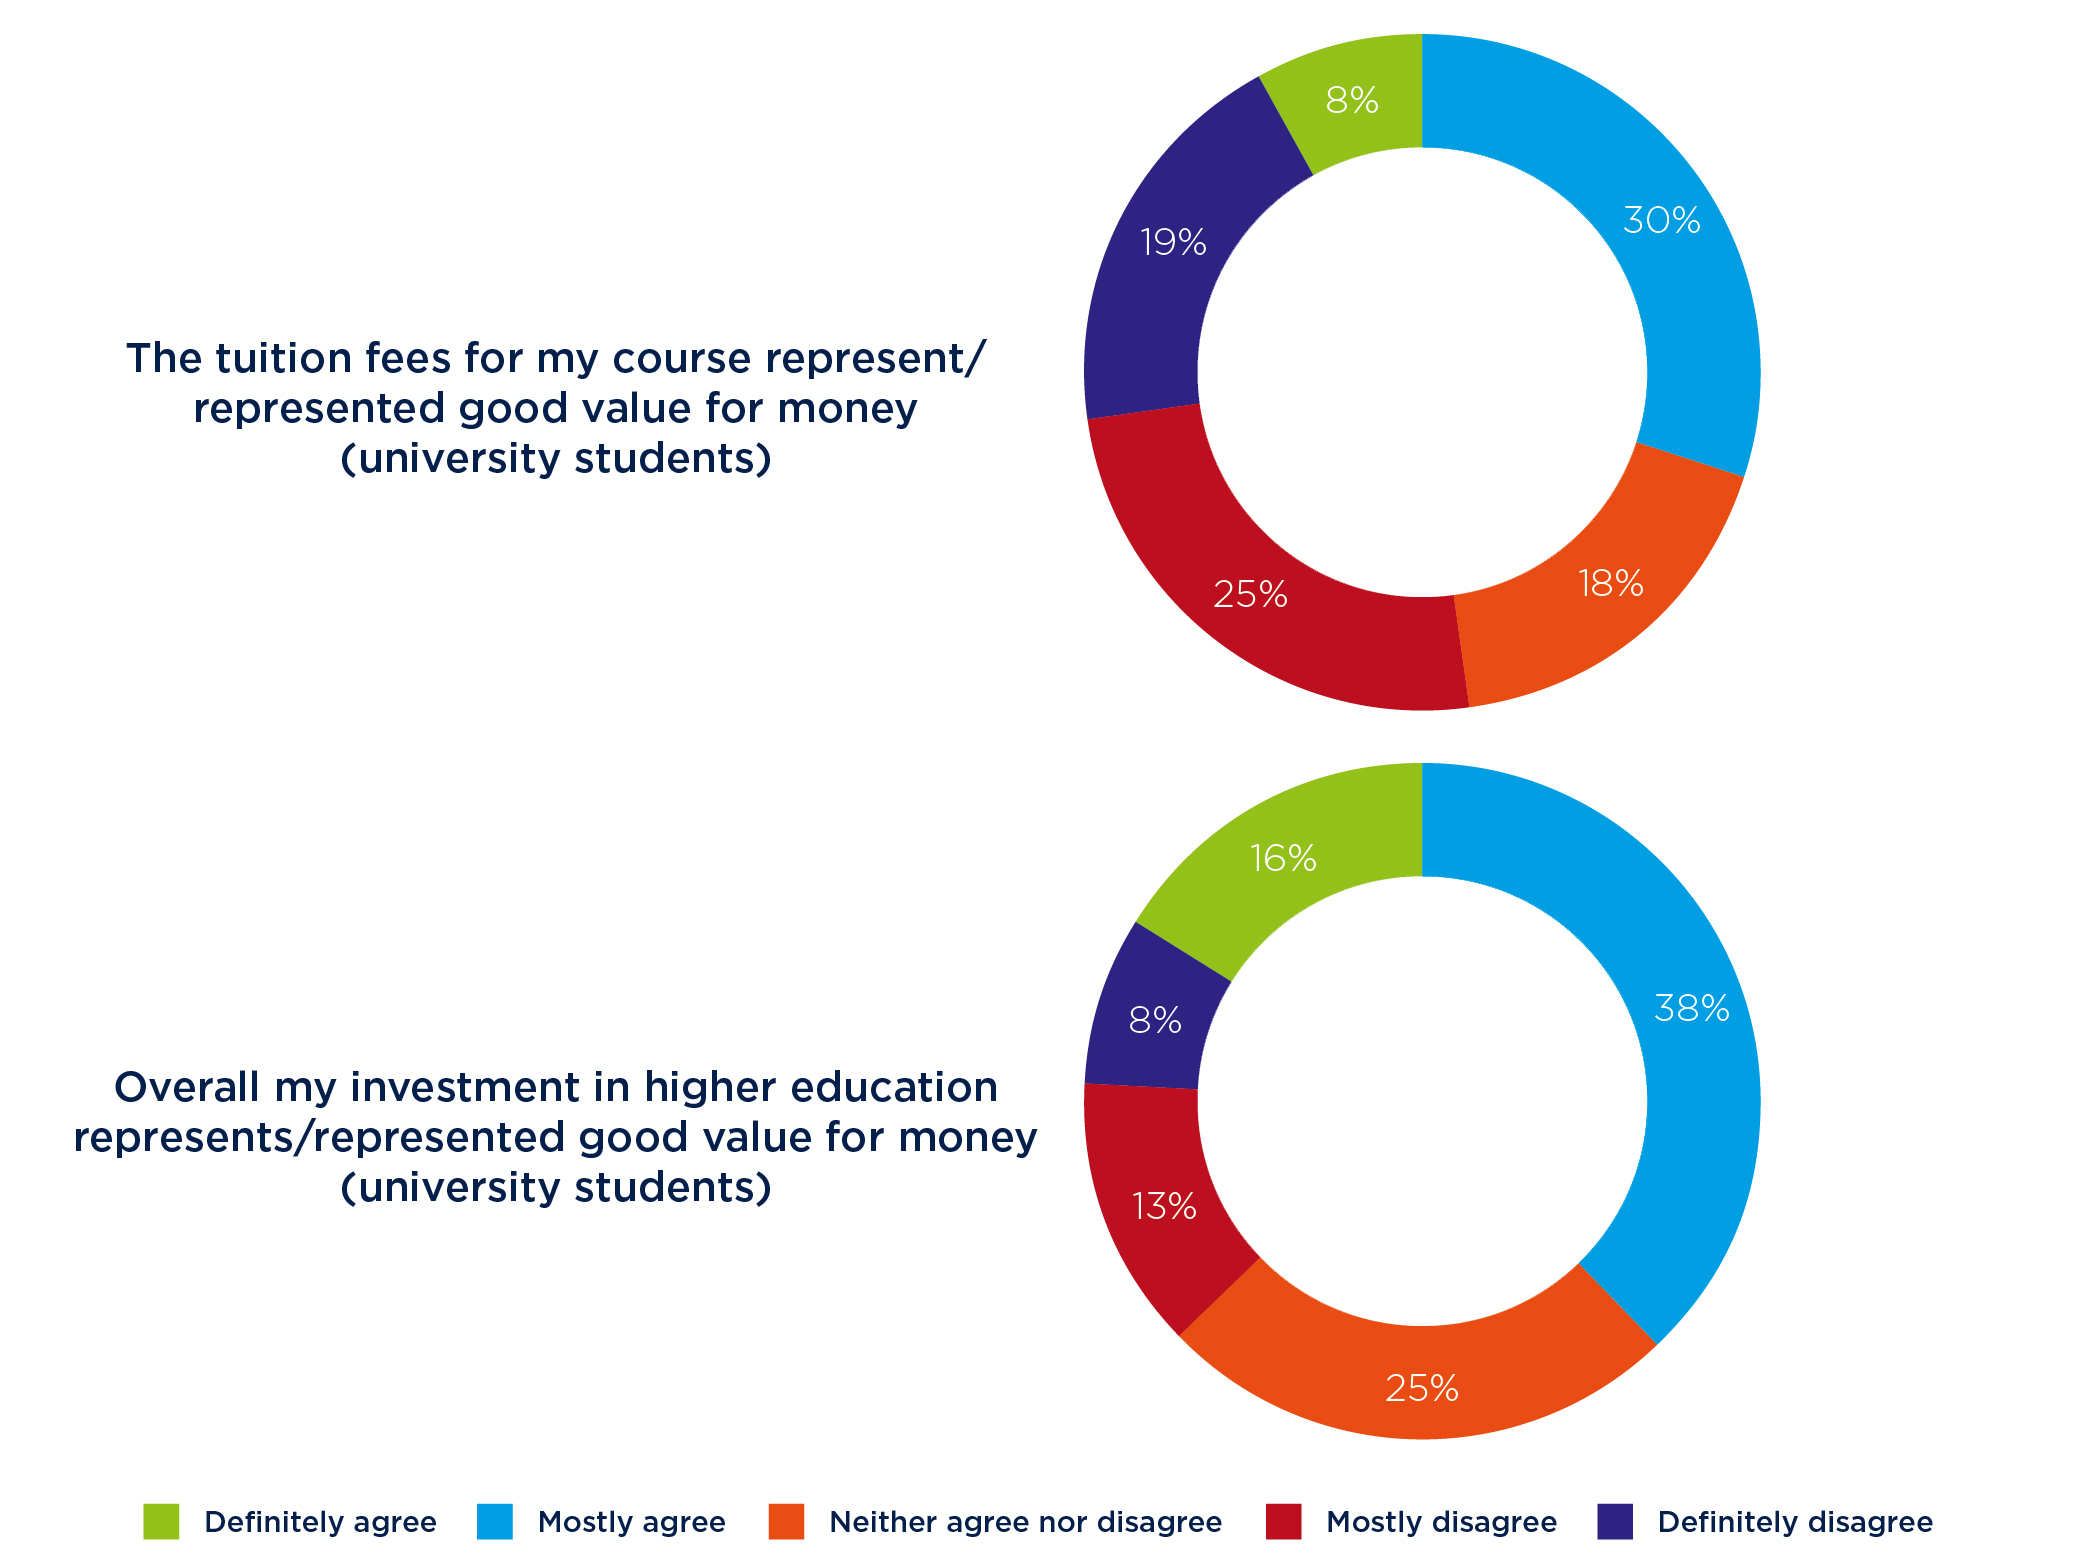
Figure 9: Students’ views of the value for money they receive
Population: Current higher education students in England (including full-time undergraduates, part-time undergraduate and postgraduate students), recent graduates and school students
Source data: Survey carried out as part of the ‘Value for money: The student perspective’ research
Figure 9 is a double donut chart showing students’ views of the value for money they receive
The first donut shows that, in response to the statement ‘The tuition fees for my course represent/represented good value for money’, of the surveyed university students:
- 8 percent definitely agreed
- 30 percent mostly agreed
- 18 percent neither agreed nor disagreed
- 25 percent mostly disagreed
- 19 percent definitely disagreed.
The second donut shows that, in response to the statement ‘Overall my investment in higher education represent / represented good value for money’, of the surveyed university students:
- 16 percent definitely agreed
- 38 percent mostly agreed
- 25 percent neither agreed nor disagreed
- 13 percent mostly disagreed
- 8 percent definitely disagreed.
Teaching quality and feedback
Value for money for students was the subject of the first piece of research commissioned by the OfS (see Figure 9).144 This research surveyed students, to explore value for money from their perspective. It asked what value for money meant to them, whether or not they felt they were receiving it, and what could be done to improve it.
Teaching and feedback quality was highlighted as the most important factor. Over 90 per cent of students responding to the OfS survey felt that the quality of teaching, assessment and feedback were important in demonstrating value for money. 81 per cent of respondents identified learning resources, such as library and IT services, as very important.
In 2017, a large survey of higher education applicants, commissioned by the Higher Education Policy Institute and Unite Students, found that 60 per cent expected to spend more time in lectures than they did in school lessons. Only 19 per cent of students found that this actually happened.145 It is clear that students consider the number of scheduled contact hours to be important in determining value for money, and they expect universities and colleges to be more upfront about what they can expect.
The OfS uses a number of mechanisms to ensure high-quality teaching and feedback. We only register providers that meet our conditions for quality, as set out in our regulatory framework.146 Through our regulation, we are encouraging providers not just to meet this baseline but to continually improve on it.
We also run the TEF, which rates universities and colleges as Bronze, Silver or Gold depending on the quality of their teaching. This framework is informed by the feedback students themselves give in the National Student Survey, a census of most of the final year undergraduate students in the UK.
This information on teaching quality is presented in a more user-friendly form on Discover Uni, the official website for comparing higher education courses. It allows prospective students to identify which providers and courses are most likely to meet their needs. Alongside other online sources like UCAS and the Student Room, Discover Uni will give students access to the best information to decide between potential destinations.
The need for better consumer information
Prospective students are not always fully aware of what their educational experience will involve. They can also be surprised by extra costs. Housing and printing costs and the need to buy a computer all affect how students judge the value for money they are getting from their degree. Almost a quarter of respondents to the OfS value for money survey said that they were not informed of or prepared for how much everything would cost as a student.
The Higher Education Policy Institute’s annual Student Academic Experience Survey asks students about the value for money of their course, and how their experience compares with their expectations.147 The results show that students who feel their academic experience did not meet their expectations are much more likely to feel they have not received value for money.
Universities and colleges therefore need to be more transparent. These issues, and others where student expectations are not met, may result from a lack of information available to students. As noted previously, informed choice by students is essential in prompting providers to improve the value for money that they offer. Good consumer information should also inform students about what they can expect for their fees.
Under consumer protection law, providers must give students clear, accurate and timely information about their course. The Competition and Markets Authority has published guidance for higher education providers about how consumer law applies to them.148 This guidance suggests that they should tell students about the number and type of contact hours and self-study time that are expected, and inform them of the total cost of a course, including fees and any necessary additional costs. We are considering how to strengthen such guidance in the coming year.
Value for money of the OfS
The OfS has two sources of funding.
Firstly, central government issues us with guidance and supplies the public funding that we distribute. This means we need to ensure we are returning value for money for taxpayers (see Figure 10). We do this by enabling the higher education sector to deliver wide social and economic benefits in exchange for public investment. Providers that receive public funding from us, such as through our Challenge Competition, must comply with our terms and conditions, including a stipulation that they ensure effective accountability and represent value for money.149 After these projects are complete, we evaluate how cost-effective they were.
Secondly, registered providers fund our operations through the registration fees they pay. To ensure this money is used wisely, we have systems of governance, risk management and internal control. Our Risk and Audit Committee receives reports from our auditors and provides assurance that these process are working satisfactorily. We publish full details in our annual report and accounts.150
We have an internal plan for improving the organisational value for money of the OfS. This means we embed value for money in our decision-making, measure our performance, procure goods and services effectively, and make best use of our staff, office space and technology. All this helps us to carry out our activities at lower cost, or with greater efficiency and effectiveness. We will publish a report each year, separate to the OfS annual report, on the value for money of the OfS.151
We have established a Portfolio Management Office. This will assess the potential costs and benefits of our planned projects to check that they represent value for money. We also publish key performance measures on our efficiency and effectiveness.152 These will include a measure of our overall performance – we will show the proportion of our full set of key performance targets that we are meeting.
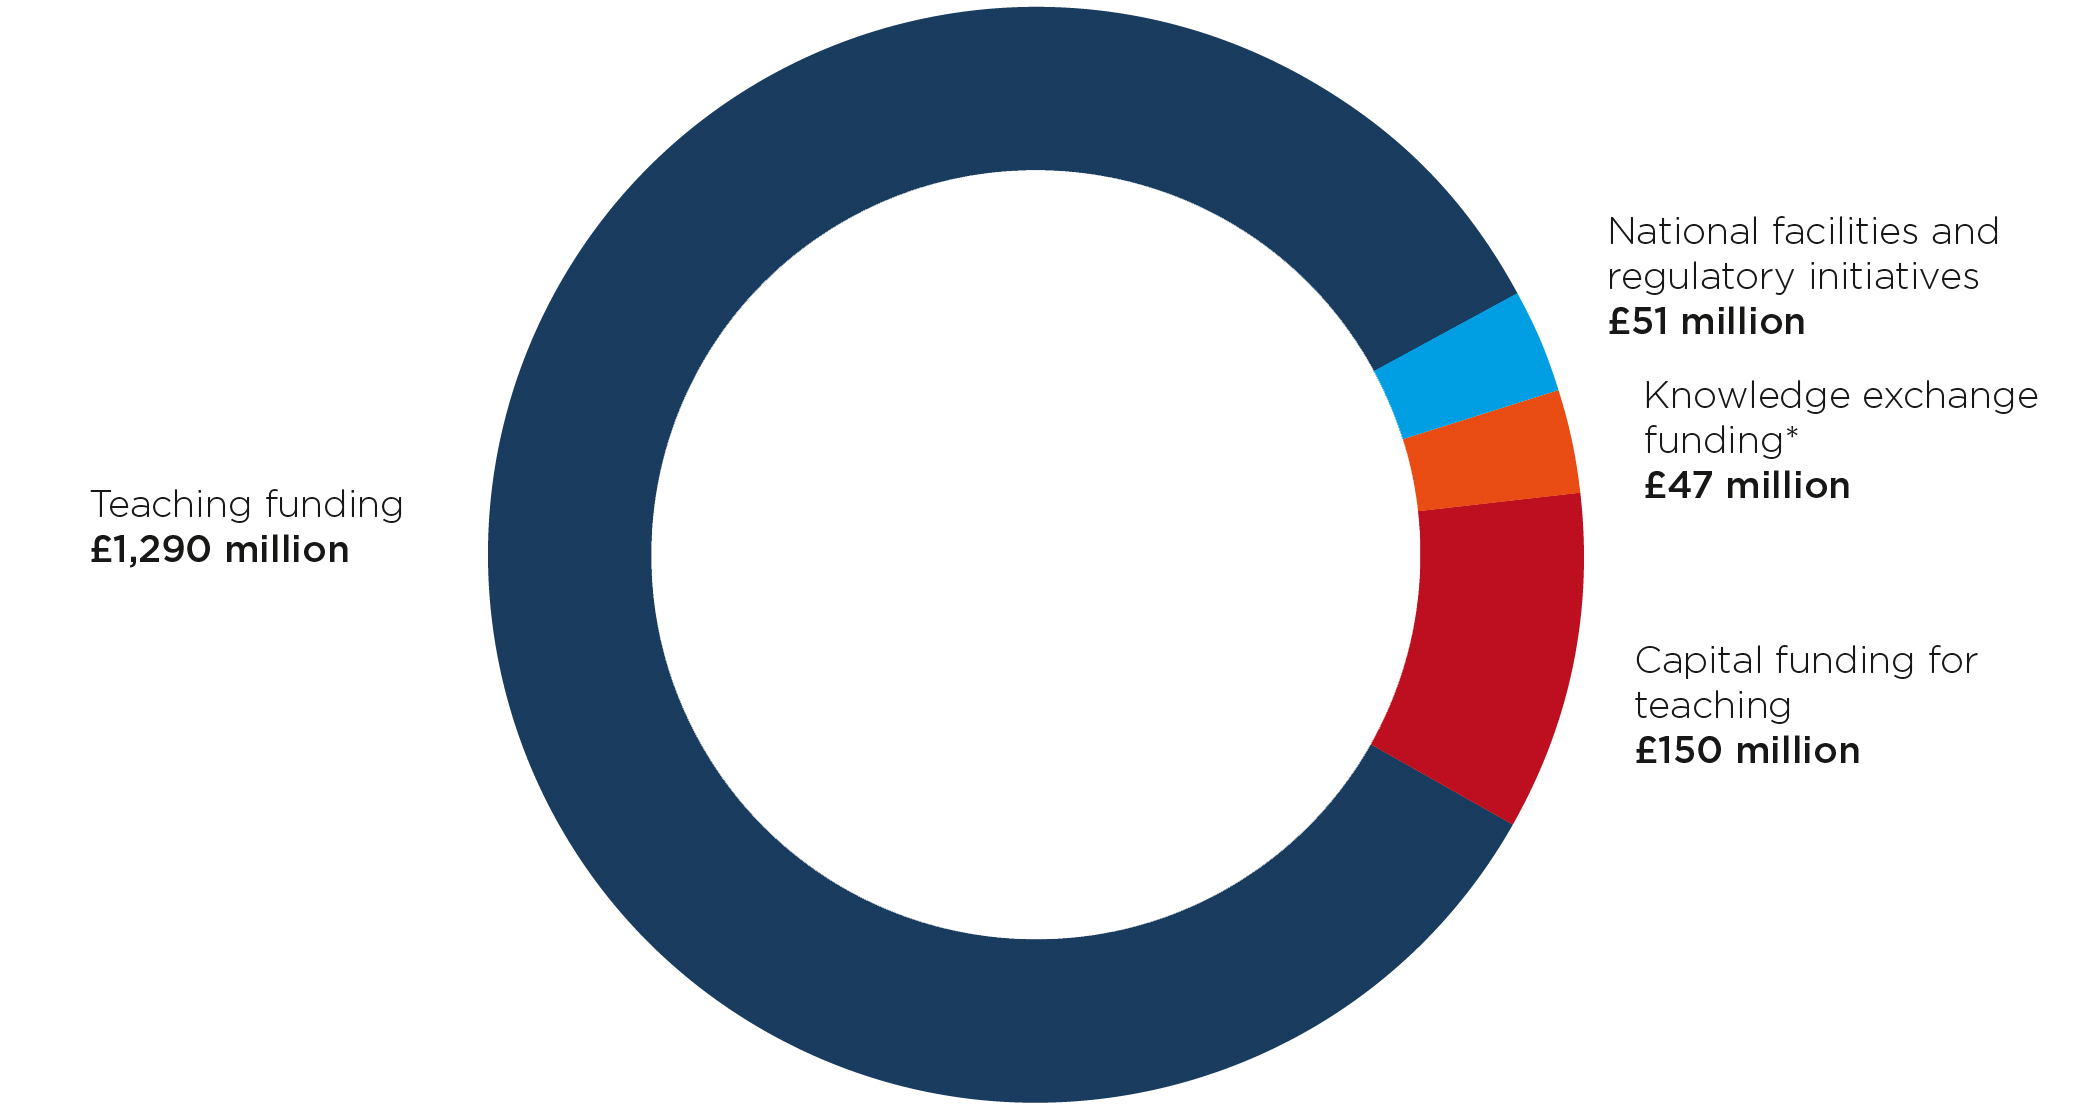
Figure 10: OfS grant in the academic year 2018-19 (£1,538 million)
Source data: OfS grant allocations (*OfS grant distributed by UK Research and Innovation through Research England).
Figure 10 is a single donut chart of how the £1,538 million OfS grant in the academic year 2018-19 was spent. It shows:
- £1290 million for recurrent teaching funding
- £51 million for national facilities and regulatory initiatives
- £47 million for knowledge exchange funding*
- £150 million for Capital funding for teaching.
Conclusion
We have a number of ways to intervene if we do not think universities and colleges are being transparent about value for money. For example, we require them to publish information about senior staff pay in a standard format. In our first audit of senior staff pay, we found that the proportion of all staff paid a basic salary of £100,000 or more in 2017 was 1.5 per cent, up from 1.3 per cent in 2016. However, this increase masks more general variation: 48 providers (36 per cent) reported a decrease in the proportion of staff paid such a salary.153
While there is evidence that some universities and colleges are exercising pay restraint, six universities paid their vice-chancellors more than £500,000 annually in 2017.154 We publish an analysis of senior staff remuneration to ensure transparency.
It is vital that universities and colleges are more upfront about the additional costs that students will be expected to pay. They must also be far more transparent about how much they are paying their senior staff, and what they are spending their students’ fees on. To ensure we fully understand students’ ideas about value for money, and to maintain pressure on universities and colleges to deliver it in the future, we will:
- Consider putting a question in the NSS about value for money.
- Encourage universities and colleges to be more transparent in their value for money plans about how student fees are spent.
- Continue to monitor the pay of senior staff, and consider taking action if it is unjustified.
141 OfS, ‘Gap in participation between most and least represented groups’ (www.officeforstudents.org.uk/about/measures-of-our-success/participation-performance-measures/gap-in-participation-between-most-and-least-represented-groups/).
142 OfS, ‘2019 NSS summary data’.
143 Universities UK, ‘The financial concerns of students’, June 2018 (available at https://www.universitiesuk.ac.uk/sites/default/files/field/downloads/2021-07/the-financial-concerns-students.pdf), p25.
144 Trendence UK, ‘Value for money: The student perspective’.
145 HEPI, ‘Reality check: A report on university applicants’ attitudes and perceptions’, July 2017 (available at https://www.hepi.ac.uk/2017/07/04/reality-check-report-university-applicants-attitudes-perceptions/).
146 OfS, ‘The regulatory framework for higher education in England’ (www.officeforstudents.org.uk/advice-and-guidance/regulation/the-regulatory-framework-for-higher-education-in-england/).
147 HEPI, ‘Student academic experience survey 2019’.
148 Competition and Markets Authority, ‘Higher education: consumer law advice for providers’, 15 March 2015 (https://www.gov.uk/government/publications/higher-education-consumer-law-advice-for-providers).
149 OfS, ‘Terms and conditions of funding for 2019-20’ (OfS 2019.12), March 2019 (available at www.officeforstudents.org.uk/publications/terms-and-conditions-of-funding-for-2019-20/).
150 OfS, ‘Annual report and accounts 2018-19’, July 2019 (available at www.officeforstudents.org.uk/publications/annual-report-and-accounts-2018-19/).
151 OfS 2019.38.
152 OfS, ‘Efficiency and effectiveness performance measures’ (www.officeforstudents.org.uk/about/measures-of-our-success/efficiency-and-effectiveness-performance-measures/).
153 OfS, ‘Senior staff remuneration: Analysis of the 2017-18 disclosures’ (OfS 2019.03), February 2019 (available at www.officeforstudents.org.uk/publications/senior-staff-remuneration-analysis-of-the-2017-18-disclosures/), p4.
154 OfS 2019.03, pp10-11.
Describe your experience of using this website