English higher education 2019: The Office for Students annual review
Beyond higher education: Ensuring successful outcomes
One of our key regulatory objectives is ensuring that all students, whatever their background, can progress into employment, further study and fulfilling lives. We also have to ensure that their qualifications hold their value over time. This chapter looks at the OfS’s role in ensuring that degrees are equitably awarded and how we are encouraging universities and colleges to address skills shortages. It describes our role in addressing the black attainment gap and the unexplained increase in students receiving first-class degrees. Finally, it outlines what we intend to do and expect providers to do in the future.
The degree dividend to graduates, the economy and society
A degree continues to benefit students and graduates. It can have a transformative impact on students’ lives, and offers both monetary and more intangible benefits to them and to society. The graduate unemployment rate currently stands at 5.1 per cent, the lowest since 1979.117 By the age of 29, the vast majority of graduates earn more than those who do not go to university.118 Increasing numbers are taking postgraduate degrees.119
Higher education can be life-changing. Degrees develop higher-level analytical skills, adaptability, critical thinking, and responsiveness. These qualities are not only in demand in today’s economy, but form a foundation for improved life chances and long-term careers, given the quantity of flex and change demanded over a working life. The employment rate among disabled people is 71.7 per cent for those with a degree, compared with 45.6 per cent for those whose highest qualification is at GCSE level.120 Prisoners who receive funding to undertake Open University courses have a reoffending rate four to eight percentage points lower than similar prisoners who do not.121
Higher education has a major impact on the UK’s economy. In 2014, universities accounted for 1.3 per cent of the jobs in the UK and generated £95 billion of gross output in the economy, 2.9 per cent of the nation’s entire economic activity.122 They remain one of our flagship industries, bringing large numbers of international students into the UK. Universities and colleges are contributing more directly to economic growth through building projects and employing support staff.
Yet not everything is positive. 36.5 per cent of graduates were in ‘non-graduate’ roles five years after leaving university, though this includes positions like paramedic, where degrees are now expected.123 There are also significant differences in the earnings of students from marginalised groups. Graduates from more deprived backgrounds are less likely to progress into highly skilled employment (see Figure 5). Five years after leaving university, students from POLAR quintile 1 areas earned, on average, 19 per cent less than those from quintile 5. In terms of proportions in highly skilled employment or further study, there is a 4.2 percentage point gap between students whose parents come from the most and least advantaged standard occupational classification groups.124
Figure 5: Percentage of graduates in highly skilled jobs by index of deprivation, 2012-13 to 2016-17
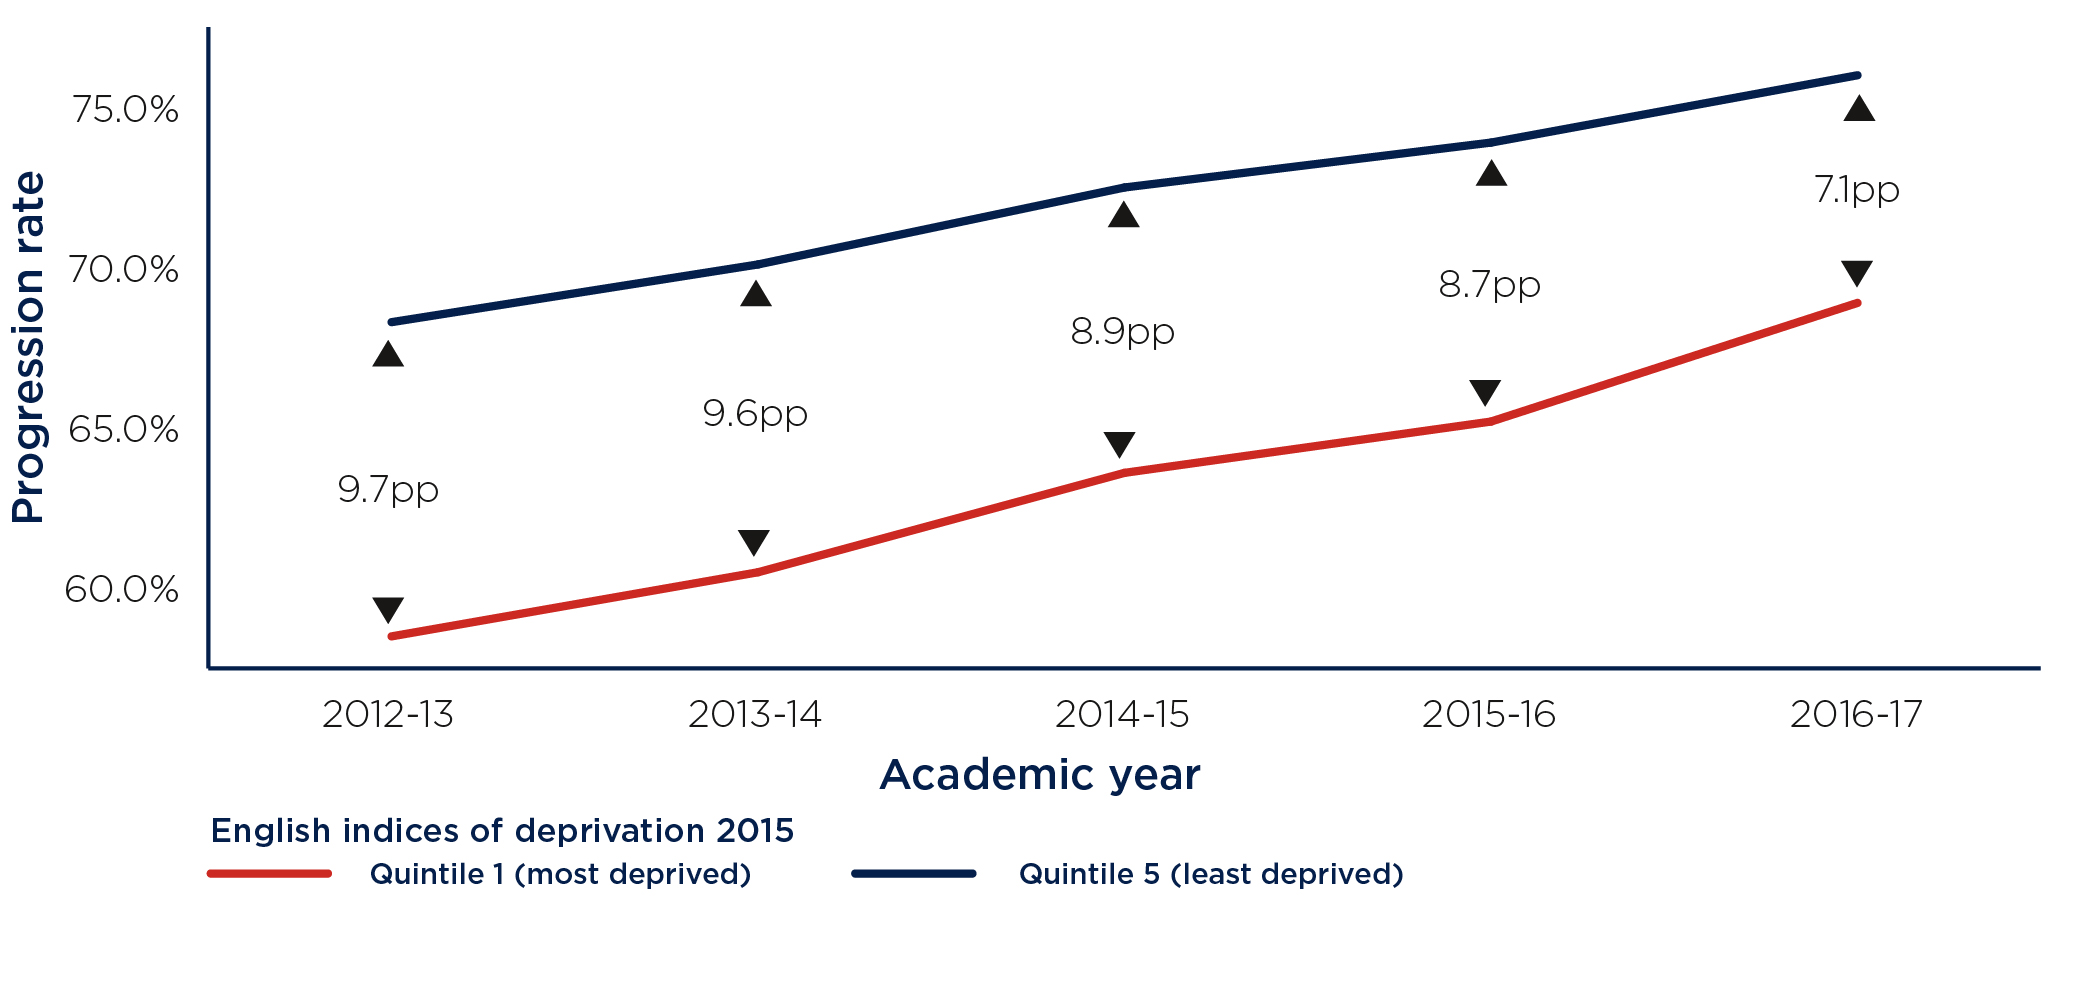
Note: ‘pp’ = ‘percentage point.
Population: English-domiciled full-time undergraduate qualifiers from English higher education providers.
Source data: OfS access and participation dataset 2019.
Figure 5 is a double line graph showing the percentage of graduates in highly skilled jobs by index of deprivation between 2012-13 to 2016-17
It shows that graduates from the least deprived quintile of the English indices of deprivation are more likely to be employed in a highly skilled job than those from the most deprived quintile. It also shows that the gap has narrowed by 2.6 percentage points between 2012-13 and 2016-17.
The graph shows:
- In 2012-13, 58.5 percent of graduates from the most deprived quintile were employed in a highly skilled job compared to 68.3 from the least deprived, a percentage point gap of 9.7.
- In 2013-14, 60.5 percent of graduates from the most deprived quintile were employed in a highly skilled job compared to 70.1 from the least deprived, a percentage point gap of 9.6.
- In 2014-15, 63.6 percent of graduates from the most deprived quintile were employed in a highly skilled job compared to 72.5 from the least deprived, a percentage point gap of 8.9.
- In 2015-16, 65.2 percent of graduates from the most deprived quintile were employed in a highly skilled job compared to 73.9 from the least deprived, a percentage point gap of 8.7.
- In 2016-17, 68.9 percent of graduates from the most deprived quintile were employed in a highly skilled job compared to 76.0 from the least deprived, a percentage point gap of 7.1.
The OfS’s role: Local graduates and uneven opportunities
Skills gaps
Certain sectors of British industry and business have suffered from a lack of qualified workers. One way the government has sought to close this skills gap is through the Degree Apprenticeship Development Fund. Set up in 2016 and now run by the OfS, it has dispensed over £9 million to support the development and delivery of degree apprenticeships in areas including chartered management, digital and technology solutions, engineering, construction, and healthcare.
Degree apprenticeships benefit school leavers from disadvantaged backgrounds, potentially increasing social mobility. The highest take-up rate is in the North East and North West, where there are multiple higher education cold spots.125 In June 2019, we were invited to assess apprenticeships at Levels 6 and 7 delivered by providers not registered with the OfS, allowing us to ensure that they are of high quality. We are currently running a trial at four providers to assess how we can best regulate these degrees.
A number of our projects aimed at closing skills gaps have focused on encouraging older people to retrain. The OfS has funded research into how to arrest a decline in mature students applying to study nursing since the removal of bursaries in 2017 (before which they made up half of all entrants). The research suggested that universities could better raise awareness of nursing careers, and outline more carefully the financial support available to the student.126 Such conclusions are not only applicable to nursing; they suggest a pathway for providers offering other courses.
Research by the Sutton Trust has shown that 55.8 per cent of graduates study within 55 miles of the area where they grew up, and in 2015 69 per cent took jobs in their home regions.127 Some regions, such as London, retain around four-fifths of their students.128 However, opportunities in some regions are limited because of variations in productivity and labour markets. At the same time, areas with the lowest productivity and growth are the places that most need to capitalise on graduate talent to succeed. Universities in these areas offer industry a ready supply of graduates, many of whom are currently impelled to move away (see Figure 6).
Our role in encouraging such innovation was highlighted in the Industrial strategy white paper. To target current and anticipate future skills shortages we were invited to incentivise existing providers to become more dynamic, and to encourage new high‑quality colleges and universities. This will allow the OfS to ‘drive improvements in productivity and support the wider economic needs of the country.’129
Despite the huge increase in student numbers in the last two decades, there remain substantial skills shortages in certain sectors. In 2017, there were 42,000 vacancies in the NHS for nurses, midwives and allied health professionals. Since 2018, we have invested £1 million annually to increase the number of students studying therapeutic radiography, podiatry, orthoptics, prosthetics and orthotics.130 To help meet the engineering skills shortage, we are supporting the development of innovative provision. We have also funded the establishment of 41 masters’ level conversion courses in engineering, data science, cybersecurity and computing.131
One way to ensure that all students have the opportunity to pursue professional roles is by making work experience an intrinsic part of a degree. Some 59 per cent of employers, when recruiting graduates, regard this as one of the most important factors.132 However, work experience, often undertaken during university holidays in the form of unpaid internships, can be harder for more disadvantaged students to manage.
Case study: Employability for Life at the University of Law
The University of Law has developed an approach to employability which recognises the extra barriers faced by students who are underrepresented in higher education. Employability for Life provides practical support for students before they start, during their time as a student, and throughout their subsequent careers. It also enables staff better to understand how professional and personal ambitions, responsibilities and experiences relate to each other, helping the design of the programme.
The programme is targeted at students from less advantaged economic groups and disabled students. Many disadvantaged students lack the social capital to engage with employers and access voluntary opportunities. They also often have more family and personal responsibilities. Disabled students also receive extra mentoring support through existing programmes.
All students will benefit from a specific Life module embedded in the curriculum which includes support around: employability skills, including volunteering and pro bono work; personal financial management; emotional well-being including mental resilience; and familial relationships. The university works with employers to provide paid internships and work placements, with financial support where required.
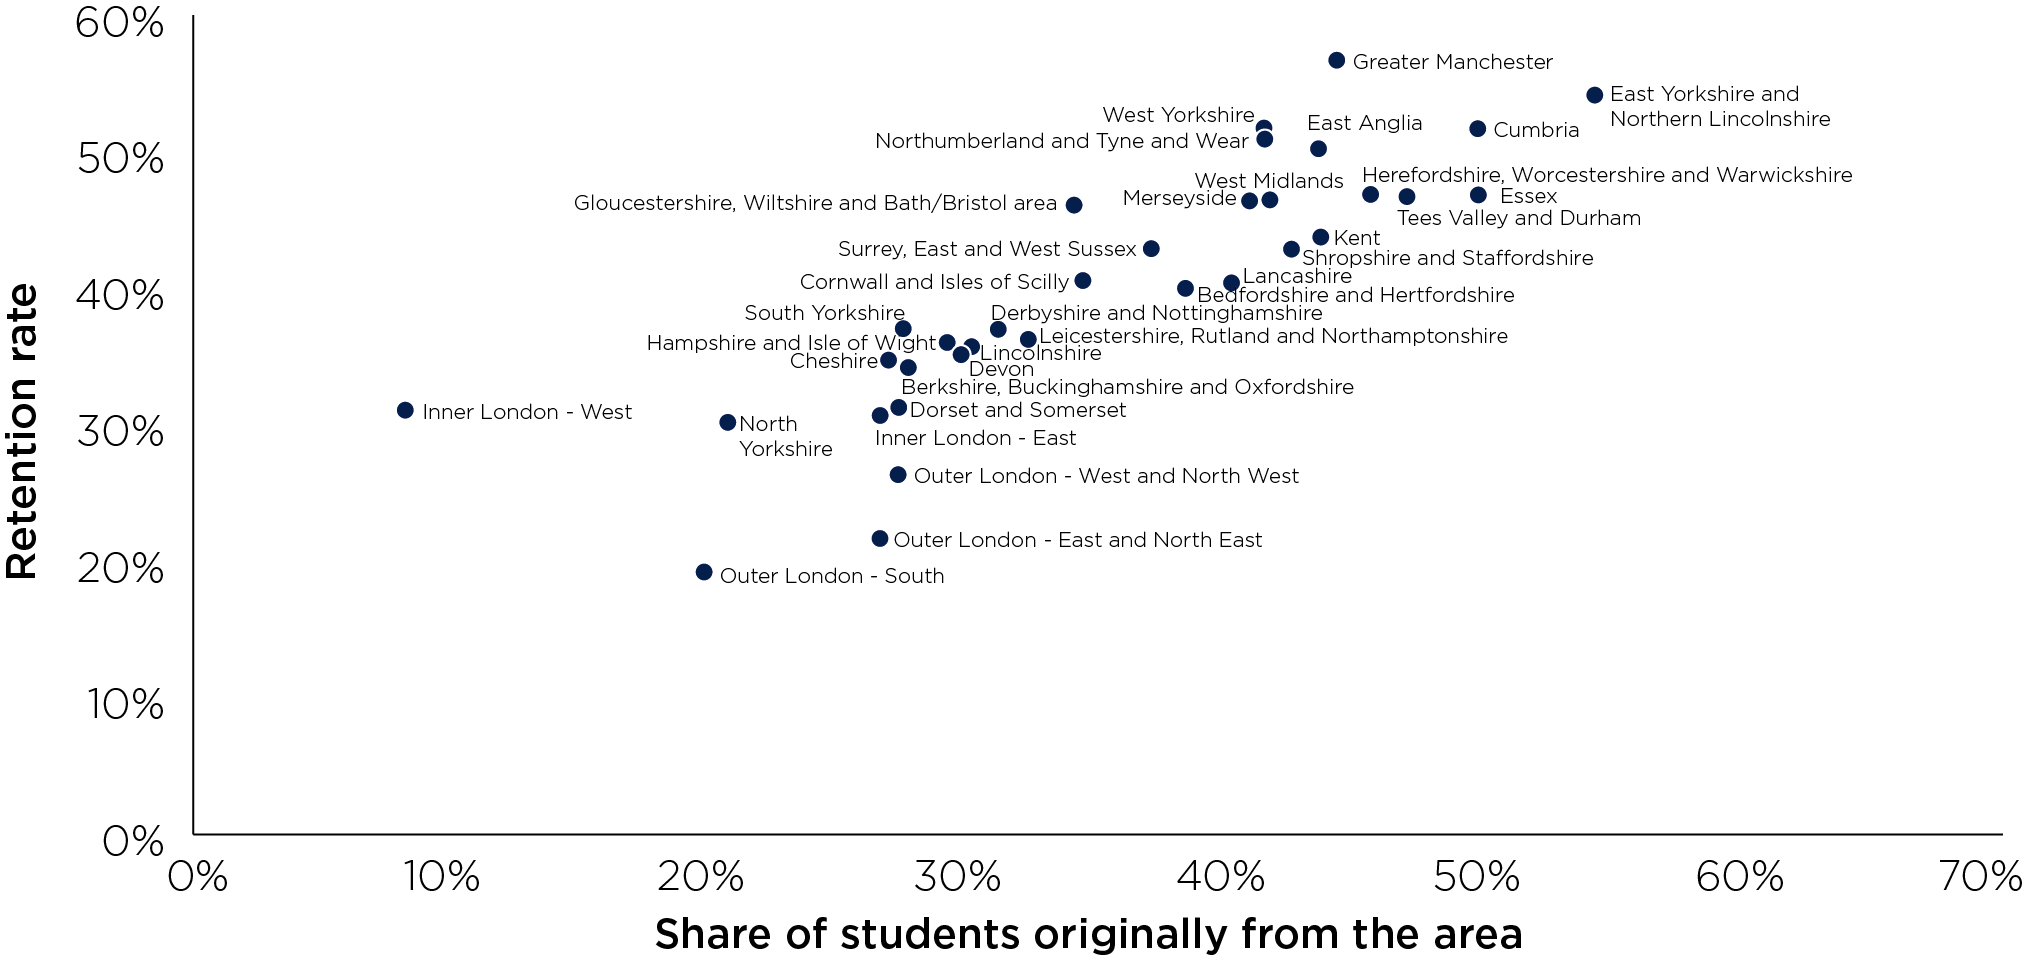
Figure 6: Relationship between retention and local students, 2012-13 to 2016-17
Population: UK-domiciled graduates with an employment postcode (distance learners have been excluded).
Source data: Source data: HESA student records, HESA alternative provider records, ILR, DLHE, 2012-13 to 2016-17.
Figure 6 shows the relationship between retention and local students, 2012-13 to 2016-17
It shows that most areas retain more than 30 percent of their graduates, and a higher proportion than the proportion of students they recruit from the local area.
- In Bedfordshire and Hertfordshire, 38 percent of students were from the local area and 40 percent of graduates who studied here were employed in the area.
- In Berkshire, Buckinghamshire and Oxfordshire, 28 percent of students were from the local area and 35 percent of graduates who studied here were employed in the area.
- In Cheshire, 27 percent of students were from the local area and 35 percent of graduates who studied here were employed in the area.
- In Cornwall and Isles of Scilly, 41 percent of students were from the local area and 34 percent of graduates who studied here were employed in the area.
- In Cumbria, 49 percent of students were from the local area and 52 percent of graduates who studied here were employed in the area.
- In Derbyshire and Nottinghamshire, 31 percent of students were from the local area and 37 percent of graduates who studied here were employed in the area.
- In Devon, 30 percent of students were from the local area and 36 percent of graduates who studied here were employed in the area.
- In Dorset and Somerset, 27 percent of students were from the local area and 32 percent of graduates who studied here were employed in the area.
- In East Anglia, 43 percent of students were from the local area and 50 percent of graduates who studied here were employed in the area.
- In East Yorkshire and Northern Lincolnshire, 54 percent of students were from the local area and 54 percent of graduates who studied here were employed in the area.
- In Essex, 49 percent of students were from the local area and 47 percent of graduates who studied here were employed in the area.
- In Gloucestershire, Wiltshire and Bath/Bristol area, 34 percent of students were from the local area and 46 percent of graduates who studied here were employed in the area.
- In Greater Manchester, 44 percent of students were from the local area and 54 percent of graduates who studied here were employed in the area.
- In Hampshire and Isle of Wight, 29 percent of students were from the local area and 36 percent of graduates who studied here were employed in the area.
- In Herefordshire, Worcestershire and Warwickshire, 45 percent of students were from the local area and 47 percent of graduates who studied here were employed in the area.
- In Inner London (East), 27 percent of students were from the local area and 31 percent of graduates who studied here were employed in the area.
- In Inner London (West), 8 percent of students were from the local area and 32 percent of graduates who studied here were employed in the area.
- In Kent, 43 percent of students were from the local area and 44 percent of graduates who studied here were employed in the area.
- In Lancashire, 40 percent of students were from the local area and 41 percent of graduates who studied here were employed in the area.
- In Leicestershire, Rutland and Northamptonshire, 32 percent of students were from the local area and 37 percent of graduates who studied here were employed in the area.
- In Lincolnshire, 30 percent of students were from the local area and 36 percent of graduates who studied here were employed in the area.
- In Merseyside, 41 percent of students were from the local area and 46 percent of graduates who studied here were employed in the area.
- In North Yorkshire, 21 percent of students were from the local area and 30 percent of graduates who studied here were employed in the area.
- In Northumberland and Tyne and Wear, 41 percent of students were from the local area and 51 percent of graduates who studied here were employed in the area.
- In Outer London (East and North East), 27 percent of students were from the local area and 22 percent of graduates who studied here were employed in the area.
- In Outer London (South), 20 percent of students were from the local area and 20 percent of graduates who studied here were employed in the area.
- In Outer London (West and North West), 27 percent of students were from the local area and 27 percent of graduates who studied here were employed in the area.
- In Shropshire and Staffordshire, 42 percent of students were from the local area and 43 percent of graduates who studied here were employed in the area.
- In South Yorkshire, 27 percent of students were from the local area and 37 percent of graduates who studied here were employed in the area.
- In Surrey, East and West Sussex, 37 percent of students were from the local area and 43 percent of graduates who studied here were employed in the area.
- In Tees Valley and Durham, 47 percent of students were from the local area and 47 percent of graduates who studied here were employed in the area.
- In West Midlands, 41 percent of students were from the local area and 46 percent of graduates who studied here were employed in the area.
- In West Yorkshire, 41 percent of students were from the local area and 51 percent of graduates who studied here were employed in the area.
The Universities of Bath, Bedfordshire and Warwick, to take just three examples, all now offer placements for undergraduate students who want them.
With the expansion of government loans to cover £10,000 towards the cost of a masters’ degree, the number of students studying these degrees increased from 73,880 in 2015 to 96,465 in 2016. The proportional increase was largest among students from low participation areas, black students, and students who declared a disability.133 This loan scheme has therefore allowed more people from underrepresented groups to undertake further study, further enhancing their skills and employability.
We have also encouraged providers to innovate through our Challenge Competition, which has awarded £5.6 million to help 15 projects improve local graduates’ employment opportunities. Through this fund, we will support the providers to furnish students with work-related training and develop links with local employers and infrastructure. This will increase opportunities and choices for graduates to find highly skilled work locally, and its outcomes will be used to inform future practice across the higher education sector.
These projects address one or more of the following challenges:
- improving employment rates for students, particularly those from marginalised backgrounds, such as students of minority ethnic backgrounds and disabled students
- improving graduate outcomes for mature or part-time students who plan to remain in their local area for study and poststudy work
- addressing geographical skills gaps by ensuring graduates are well prepared to succeed in local industries.
This funding will help us and the sector challenge the persistent divergences between outcomes for different student groups, especially the most marginalised, and help us deliver on our Industrial strategy priorities.
Case study: Embedding and sustaining inclusive STEM practices at the Open University
This project has received £480,050 from the OfS to build inclusive learning values and practices in the delivery of science, technology, engineering and maths (STEM) subjects. It is a collaboration between the Open University, the University of Leeds and the University of Plymouth.
The project aims to:
- embed inclusive resources, module and curriculum design practices in the three universities
- create sustained, inclusive module and curriculum delivery practices
- increase awareness of student diversity and inclusive design approaches among staff and students.
- Ultimately, this project will generate recommendations and principles for universities, colleges and associated professional bodies to ensure equality of opportunity for all STEM students.
Divergent outcomes
The proportion of students getting a 1st has been increasing steadily, by around two percentage points a year, for over a decade, increases that partly reflect grade inflation. Nevertheless, not all students who enter with the same A-level results have the same chance of coming out with a good degree, nor of going onto a graduate job. This section looks at these degree results and attainment gaps and asks how universities, colleges and industry should address them.
Case study: Supporting transitions at South Essex College
The college has considerable experience of supporting disabled learners’ progression from further to higher education, both within the college and to other higher education providers. Students are supported by a personal higher education disability adviser throughout their transition from further to higher education. The adviser provides encouragement, and gives impartial advice about options for accessing support to help them make informed decisions about their next educational step.
A key element of this support is through the annual review process of education, health and care plans that students have while studying at further education level. Although the plan expires when they enter higher education, it provides evidence for their needs assessment. The college identifies the aspects within students’ plans that it is able to continue to support at higher education level, thus helping to smooth the transition.
Degree attainment gaps
Women remain more likely to get a good degree than men. 79 per cent of students who began their degree under the age of 21 gained a 2:1 or 1st, compared with 67 per cent of mature students.134 Those who entered with BTEC qualifications fared less well than those who entered with A-levels.135
One of the starkest gaps, however, is that between white students and their counterparts from minority ethnic groups (See Figure 7). For example, while 82.2 per cent of young white students were awarded a 1st or 2:1 in 2017, only 60.4 per cent of their black and 71.7 per cent of their Asian counterparts were.136
Figure 7: Gap in degree outcomes (1sts or 2:1s) between white students and black students
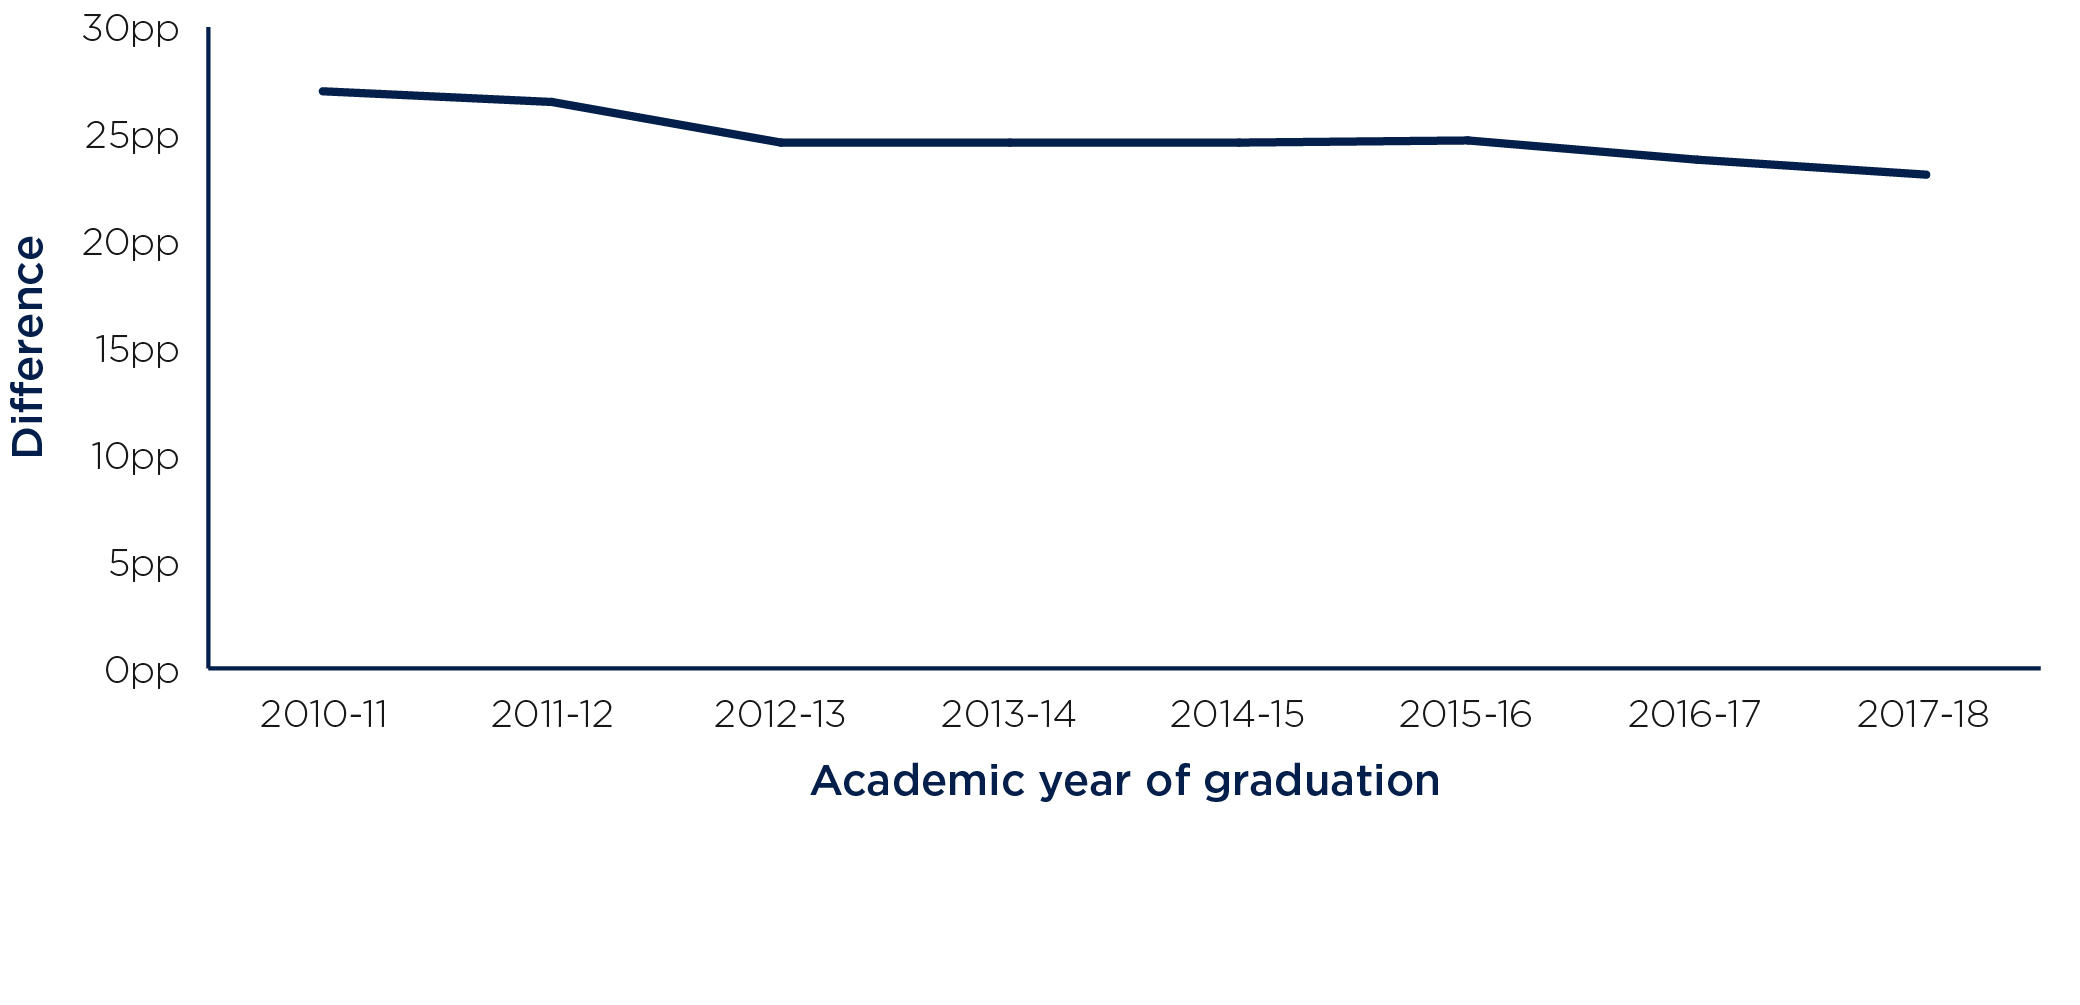
Note: ‘pp’ = ‘percentage point’.
Population: UK-domiciled graduates from full-time first-degree provision at English higher education providers.
Source data: HESA student records and ILR, 2010-11 to 2017-18 data.
Figure 7 is a single line graph which shows the gap in degree outcomes (1sts or 2:1s) between white students and black students between 2010-11 and 2017-18.
In all years, there was over a twenty percentage point gap between white and black students achieving a 2:1 or better. It also shows that this gap has narrowed, from 27 percentage points in 2010-11 to 23.1 in 2017-18.
The graph shows:
- In 2010-11, there was a 27 percentage point gap between white and black students.
- In 2011-12, there was a 26.5 percentage point gap between white and black students.
- In 2012-13, there was a 24.6 percentage point gap between white and black students.
- In 2013-14, there was a 24.6 percentage point gap between white and black students.
- In 2014-15, there was a 24.6 percentage point gap between white and black students.
- In 2015-16, there was a 24.7 percentage point gap between white and black students.
- In 2016-17, there was a 23.8 percentage point gap between white and black students.
- In 2017-18, there was a 23.1 percentage point gap between white and black students.
This year has seen a significant shift in the sector’s response to the issue of attainment for black, Asian and minority ethnic students. While there has been evidence since at least 1996 that such a gap existed, and student activists have long demanded its closure,137 only recently has the issue garnered much interest from universities and colleges. As the Universities UK and National Union of Students (NUS) report from May 2019 stated: ‘the sector now accepts that there is a problem’.138 The report outlined five changes universities and colleges could make: show strong leadership, have conversations about race and racism, create racially diverse and inclusive environments, collect and analyse data, and highlight what works.
Nor is this problem limited to university and college attainment. The 2007 McGregor‑Smith report showed that people from black, Asian and other minority ethnicities experience discrimination throughout their careers. Employers are beginning to use contextual data to ensure they have a more diverse workforce. Where many firms previously set hard A-level entry criteria, now many organisations use contextual data to make offers to disadvantaged candidates who might otherwise be overlooked. In 2015, Deloitte committed to using contextualised data to offer positions to 1,500 graduates.139 This development means that marginalised students can be supported through the university lifecycle and into employment afterwards.
The increased pressure from government, the OfS, students and activists means that this can be a tipping point for black, Asian and minority ethnic attainment. Now that the problem has been recognised, the issue of how to tackle it remains. We need to listen to those with lived experience and create more diverse ways of teaching, targeted mechanisms of support, and more inclusive workplaces to close this gap.
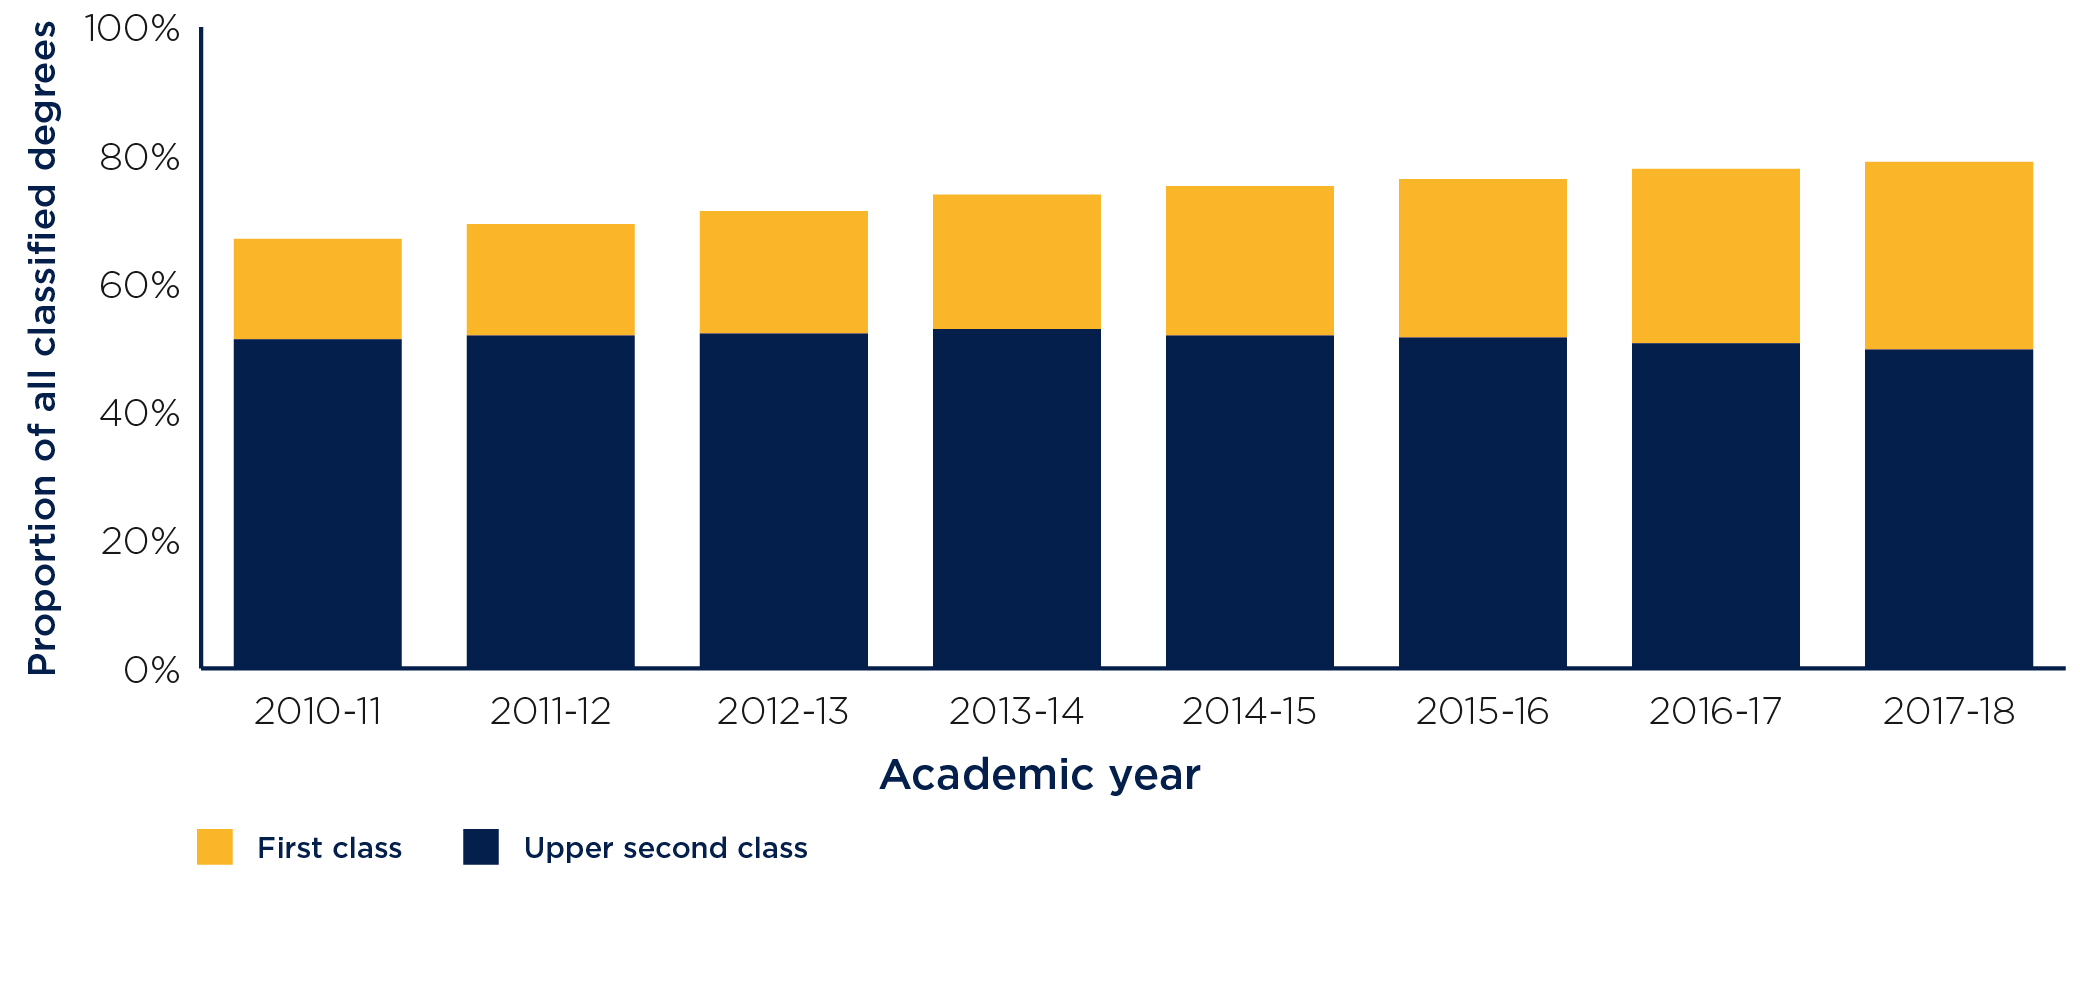
Figure 8: Changes in the proportion of classified degrees awarded as 1st and 2:1 from 2010-11 to 2016-17
Population: UK-domiciled graduates from full-time first degree provision at English higher education providers (with at least 10 graduates in each year).
Source data: HESA student records and ILR, 2010-11 to 2017-18 data.
Figure 8 is a stacked bar graph which shows changes in the proportion of classified degrees awarded as 1st and 2:1 from 2010-11 to 2016-17.
The graph shows a steady increase in the proportion of 1sts awarded over the time period, from 16 percent in 2010-11 to 29 percent in 2017-18. 2:1s remained largely stable.
The graph shows:
- Of students who graduated in 2010-11, 16 percent received a 1st and 51 percent a 2:1.
- Of students who graduated in 2011-12, 17 percent received a 1st and 52 percent a 2:1.
- Of students who graduated in 2012-13, 19 percent received a 1st and 52 percent a 2:1.
- Of students who graduated in 2013-14, 21 percent received a 1st and 53 percent a 2:1.
- Of students who graduated in 2014-15, 23 percent received a 1st and 52 percent a 2:1.
- Of students who graduated in 2015-16, 25 percent received a 1st and 52 percent a 2:1.
- Of students who graduated in 2016-17, 27 percent received a 1st and 51 percent a 2:1.
- Of students who graduated in 2017-18, 29 percent received a 1st and 50 percent a 2:1.
Numbers of 1sts and 2:1s
As shown in Figure 8, the percentage of first and upper second class degrees awarded has increased from 67 per cent in 2010-11 to 78 per cent in 2016-17, while the percentage of first-class degrees has increased from 16 per cent to 27 per cent. The increase in students getting good degree grades is not new: the number of students receiving 1sts or 2:1 has been increasing steadily since the early 1990s.140
Many factors could be behind this increase. Our analysis has shown that a proportion cannot be explained by changes in the graduate population in terms of various explanatory variables, but it could be down to an increased focus on teaching, an encouragement to use the full range of marks, better feedback, schools better preparing pupils for higher education, or the increased necessity of a 2:1 for graduate jobs. However, another possible explanation is ‘grade inflation’ arising from an increased pressure on lecturers to give students ‘value for money’ in the form of a desirable outcome from their more expensive degrees, either as a recruitment tool to encourage students to attend a university or to boost its position in commercial league tables. Across the sector there is considerable variation in the number of 1sts awarded.
We recognise that universities and colleges are beginning to confront this problem and given the significant public scrutiny of degree standards we want to understand how providers have assured themselves that they continue to apply consistent standards. The UK Standing Committee for Quality Assessment has stated its own intent to protect the value of UK degree standards and increase the transparency of degree classifications.141
The increasing use of a narrow range of degree classifications makes it harder for employers to differentiate between an average candidate and an excellent one. There has been growing pressure from think tanks to reform the way degrees are classified. This ranges from proposing an American-style Grade Point Average (GPA) classification system to a nationwide system of exams and marking undertaken by all students regardless of where they study.142
This topic highlights one of the tensions in the OfS’s work as a regulator. On the one hand, we want to encourage a broad range of students to go into higher education and to succeed. On the other, we need to ensure that degrees do not lose their value over time, so that graduates can be rewarded for their hard work and employers can compare like with like. However, there is no inherent contradiction in ensuring all students receive fair degree outcomes.
Conclusion
This chapter illustrates the importance of universities and colleges to the UK economy both nationally and regionally. On an individual level, a graduate continues to earn more, on average, than a non-graduate.
Students expect that their degrees will lead them to good jobs or the chance to study at a higher level. But there has been increasing concern that too many students are not accessing graduate-level employment, and that too many lack the skills required by employers. Universities and colleges have an important role to play as engines of economic growth in their regions, and that extends to ensuring that their graduates have the skills needed by employers.
Equally there has been wider public disquiet about the devaluing of degrees through unexplained grade inflation. At the same time, the proportion of black students gaining a good degree is significantly lower than that of white students. Ensuring that degrees maintain high standards and are awarded fairly is crucial to their continued value.
We will:
- Work with universities to ensure that degree results are not being devalued, that the awarding process is fair and that it does not disadvantage particular groups.
- Put pressure on providers to close the attainment gap between black and white students through access and participation plans, and support them to share good practice in this area.
- Continue to work with industry, including on contextual offers and links with universities and colleges so that the graduate workforce reflects the needs of UK industry and the population it serves.
As a regulator, our priorities include both maintaining quality and ensuring fairness. We do not accept the argument that poor outcomes must be tolerated because students come from poor backgrounds. Over the next year, we will continue to work with universities and colleges to ensure that all students have equal opportunities to gain a high-quality degree.
117 Luminate, ‘What do graduates do?’, 2018 (available at https://luminate.prospects.ac.uk/what-do-graduates-do).
118 Institute of Fiscal Studies, ‘The relative labour market returns to different degrees’, 2018, p24.
119 OfS, ‘The effect of postgraduate loans’.
120 House of Commons, ‘People with disabilities in employment’, May 2019 (available at https://researchbriefings.parliament.uk/ResearchBriefing/Summary/CBP-7540), p11.
121 Ministry of Justice, ‘Justice Data Lab re-offending analysis: Prisoners Education Trust’, May 2014, (https://www.prisonerseducation.org.uk/resource/justice-data-lab-re-offending-analysis-prisoners-education-trust/), p4.
122 Universities UK, ‘The economic impact of UK universities, 2014-15’, October 2017 (available at https://www.universitiesuk.ac.uk/economic-impact), p1.
123 DfE, ‘Graduate labour market statistics 2018’, p6.
124 OfS, ‘Differences in student outcomes’ (https://www.officeforstudents.org.uk/data-and-analysis/differences-in-student-outcomes/educational-disadvantage/).
125 OfS, ‘Degree apprenticeships: A viable alternative?’, (OfS Insight brief #2), March 2019 (available at www.officeforstudents.org.uk/publications/degree-apprenticeships-a-viable-alternative/), p4.
126 Marketwise Strategy, ‘Research on recruitment of mature students to nursing, midwifery and allied health courses’, March 2019 (available at www.officeforstudents.org.uk/publications/research-on-recruitment-of-mature-students-to-nursing-midwifery-and-allied-health-courses/).
127 Sutton Trust, ‘Home and away’, p4.
128 HESA, ‘Destinations of Leavers from Higher Education 2015-16’, July 2017 (available at https://www.hesa.ac.uk/data-and-analysis/publications/destinations-2015-16).
129 Department for Business, Energy and Industrial Strategy, ‘Industrial Strategy’, p101.
130 OfS, ‘Strategic interventions in health education disciplines’ (www.officeforstudents.org.uk/advice-and-guidance/funding-for-providers/health-education-funding/strategic-interventions-in-health-education-disciplines/).
131 Careers Research and Advisory Centre, ‘Evaluation of a scheme to develop pilot engineering and computing conversion masters’ courses’, April 2019 (available at www.officeforstudents.org.uk/publications/evaluation-of-a-scheme-to-develop-pilot-engineering-and-computing-conversion-masters-courses/), p1.
132 Universities UK, ‘Solving future skills challenges’, August 2018 (available at https://universitiesuk.ac.uk/policy-and-analysis/reports/Pages/solving-future-skills-challenges.aspx), p15.
133 OfS, ‘The effect of postgraduate loans’.
134 OfS, ‘Differences in student outcomes’.
135 OfS, ‘Continuation and attainment gaps’ (www.officeforstudents.org.uk/advice-and-guidance/promoting-equal-opportunities/evaluation-and-effective-practice/continuation-and-attainment-gaps/).
136 OfS, ‘Differences in student outcomes’.
137 Department for Education and Skills, ‘Ethnic minority graduates: Differences by degrees’, August 1996 (available at https://www.employment-studies.co.uk/resource/ethnic-minority-graduates-differences-degrees).
138 Universities UK, ‘Black, Asian and minority ethnic student attainment at UK universities: #closingthegap’, May 2019 (available at https://www.universitiesuk.ac.uk/policy-and-analysis/reports/Pages/bame-student-attainment-uk-universities-closing-the-gap.aspx), p ii.
139 Deloitte, ‘Deloitte becomes largest British business to adopt contextualised recruitment’, 2015 (https://www2.deloitte.com/uk/en/pages/press-releases/articles/largest-british-business-to-adopt-contextualised-recruitment.html).
140 Bachan Ray, ‘Grade inflation in UK higher education’, 17 March 2015 (available at https://srhe.tandfonline.com/doi/full/10.1080/03075079.2015.1019450); Reform, ‘A degree of uncertainty: an investigation into grade inflation in universities’, June 2018 (available at https://reform.uk/research/degree-uncertainty-investigation-grade-inflation-universities); Elton Lewis, ‘Are UK degree standards going up, down or sideways?’, 5 August 2006 (available at https://www.tandfonline.com/doi/abs/10.1080/03075079812331380472).
141 Universities UK, ‘Degree classification: Transparent, consistent and fair academic standards’, November 2018 (available at https://www.universitiesuk.ac.uk/policy-and-analysis/reports/Pages/degree-classification.aspx); UK Standing Committee for Quality Assessment, ‘Higher education sector announces new initiatives to protect value of UK degrees’ (https://ukscqa.org.uk/2019/10/10/higher-education-sector-announces-new-initiatives-to-protect-value-of-uk-degrees/).
142 UK Standing Committee for Quality Assessment, ‘Higher education sector announces new initiatives to protect value of UK degrees’.
Describe your experience of using this website