Maintaining the credibility of degrees
Analysis shows a steady growth in the awarding of higher degree classifications, especially first class degrees, at universities and colleges. This effect was established before the onset of the COVID-19 pandemic, and has led to concerns that degrees have lost their value over time. This Insight brief looks at the evidence for this, and at what universities and the Office for Students are doing and plan to do to address the implications for future cohorts of students. The brief does not constitute regulatory advice, but summarises the issue and the actions related to it.
- Date:
- 20 July 2022
Read the brief
Download the Insight brief as a PDF
Get the data
Download the Insight brief data (XLSX)
Read the Insight brief online
- Introduction
- How degrees are classified
- Our regulatory approach
- Changes in degree classifications
- Perceptions
- What the OfS is doing
- Conclusion
Introduction
The reputation of English higher education depends in part on public confidence that the degrees that universities and colleges award, and the classifications they give to these awards, are reliable and consistent.1 This means, for instance, that a graduate awarded a first class (1st) or upper second class (2:1) degree in maths in 2020 should have demonstrated broadly the same achievement as someone else with the equivalent qualification, whether they graduated in 2020, 2000 or 1980.
One aspect of the Office for Students’ (OfS’s) role is to ensure that graduates continue to benefit from their higher education, and this means ensuring that they can trust that their 1st or 2:1 continues to hold its value when compared with degrees awarded to the students who follow them. Studies show that there has been a significant increase over the past decade in the numbers of these higher grades awarded by English universities and colleges, and it is essential that graduates, employers and the public have confidence that this reflects genuinely improved performance by a large proportion of students, rather than reductions in the validity and reliability of assessment, or other changes in how classifications are calculated.
In itself, an increase in the numbers of students gaining higher grades is not necessarily a cause for concern. For example, if a university’s teaching improves for any reason, and its requirements for awarding a 1st or 2:1 remain constant, then more students are likely to earn these grades. In this case it is right for their achievement to be recognised in the class of degree awarded. However, it would be wrong if a university’s requirements were to be lowered so that more candidates were awarded a 1st or 2:1 without improvement in performance. The term ‘grade inflation’ is used to describe a situation where an increase in the awarding of higher grades does not reflect an actual increase in student achievement.
Our latest analysis of changes in degree classifications found that, between the academic years 2010-11 and 2020-21, the proportion of 1sts awarded in England has more than doubled, from 15.7 per cent in 2010-11 to 37.9 per cent in 2020-21.2 It is possible that some of this growth arises for positive reasons, such as improvements in teaching quality, or greater effort on the part of students. However, without further explanation it is not clear whether, and in which cases, the cause may instead be a relaxing of requirements for achieving these degrees.
As the then Minister of State for Universities, Michelle Donelan, observed in response to our analysis, ‘Unjustifiable increases in the proportion of top degrees being awarded’ are detrimental.3 Our task is to identify where increases are likely to be a result of unjustifiable practices, and to respond accordingly through our regulation.
How degrees are classified
For the past century, British universities and colleges have generally categorised the undergraduate degrees they award into first, upper second, lower second and third classes. Students who do not meet the requirements for one of these may still be able to earn a pass degree or other form of recognition. While one institution will sometimes validate or franchise courses that are delivered by another, for the most part larger institutions act as their own independent degree awarding bodies. In England, degree awarding powers are conferred by the OfS.4 They are separate from university status.
There is no single unifying system of the kind seen in schools – whereby, for instance, the Office of Qualifications and Examinations Regulation (Ofqual) bases its expectation for GCSE outcomes on a standard cohort, mitigated by measurements of actual performance in the form of the National Reference Test in maths and English.5 Rather, in higher education, each degree awarding body is autonomous, deciding how to assess its own students and calculate the classifications for the degrees they are awarded.
Students are assessed against criteria that are linked to the curriculum of their specific course, developed according to the judgement of the academic staff who teach that subject. All institutions are responsible for ensuring that the awards they make properly reflect student achievement now, and that they retain credibility over time.6
Our regulatory approach
The OfS aims to ensure that every student, whatever their background, has a fulfilling experience of higher education that enriches their life and career. For this reason we regulate to ensure the quality of higher education, along with equality of opportunity.
To this end we set minimum requirements for quality, and expect that universities and colleges will meet or exceed them. This baseline represents the performance that students and taxpayers are entitled to expect. If universities or other higher education providers fail to meet it, then we will intervene. Meanwhile, we use influence and incentives to persuade them to exceed it. Our focus is on addressing cases where higher education in England falls short, precisely because we consider that much of it is of high quality and requires no such intervention.
Our strategy for 2022 to 2025 includes the objective that ‘All students, from all backgrounds, can progress into employment, further study, and lead fulfilling lives, in which their qualifications hold their value over time.’ In pursuit of this, one of our goals is that ‘Students are rigorously assessed, and the qualifications they are awarded are credible and comparable to those granted previously.’7 In our recent update to the OfS’s regulatory framework, published on 1 May 2022, degree classification is included under ‘Condition B4: Assessments and awards’.8 This includes requirements that all institutions ensure that students are assessed effectively through valid and reliable assessments, and that academic regulations are designed such that awards made to students are credible.
Among other things, this means that students must be assessed in an appropriately comprehensive and challenging way, and that the qualifications awarded to students reflect their knowledge and skills. The factors we may take into account in considering the latter point include changes in the numbers and proportions of classifications, both over time and compared with other universities and colleges.
What universities have done
In 2019, the OfS called for universities in England to tackle grade inflation, and, with other members of the UK Standing Committee for Quality Assessment (UKSCQA), asked Universities UK to work with GuildHE on a UK-wide project to look at the comparability of degrees and the complex issues in this area.9 We also signalled that we expected to include measures intended to maintain the credibility of degrees in our updated regulatory framework.10
Following this, higher education representative bodies have been working with UKSCQA to protect public confidence in the value of degrees.11 This includes a statement of intent calling on universities and colleges to:
- ensure their assessments continue to stretch and challenge students
- review and explain how final degree classifications are calculated
- support and strengthen the existing system of oversight by external examiners
- review and publish data on and analysis of students’ degree outcomes.
Universities UK has been monitoring progress in this area, and concluded in January 2022 that there had been significant developments in protecting the credibility of degrees, such that universities are:
- publishing publicly available degree outcome statements
- reviewing the algorithms they use to calculate degree classifications based on UKSCQA principles
- sharing descriptors of degree classification that summarise the requirements for students
- strengthening the external examining system.12
In July 2022, Universities UK’s members in England committed to returning by 2023 to the levels of 1sts and 2:1s awarded prior to the pandemic. This will be accomplished by:
- publishing revised outcomes statements, including details of how the pandemic affected outcomes and targets, and commitments to continue previous actions and initiate further ones as necessary
- annual reviews of the statement of intent and associated commitments
- work with governing bodies to support understanding and scrutiny.13
Changes in degree classifications
In the mid-1990s, there was a general move in English universities from a norm-referenced classification system, which measured students’ performance relative to others on the same course, to the current criteria-based system.14 The norm-referenced system meant that, at only 7.3 per cent, the proportion of graduates in England gaining 1sts in 1995-95 had hardly changed since the 1960s.15 In contrast, by 2020-21 this figure had become 37.7 per cent.16
As Figure 1 shows, this proportion grew steadily from 15.7 per cent in 2010-11 until 2017-18, when it stood at 28.9 per cent. During the same period, the proportion gaining 2:2s and below had fallen by 11 percentage points, while the rate of 2:1s decreased much less sharply, by around two percentage points.17 While this growth was steady on average across the higher education sector in England, at individual universities and colleges it has sometimes been substantially more abrupt, sometimes involving growth of well over five percentage points in a single year.18
Figure 1: Degree classifications over time
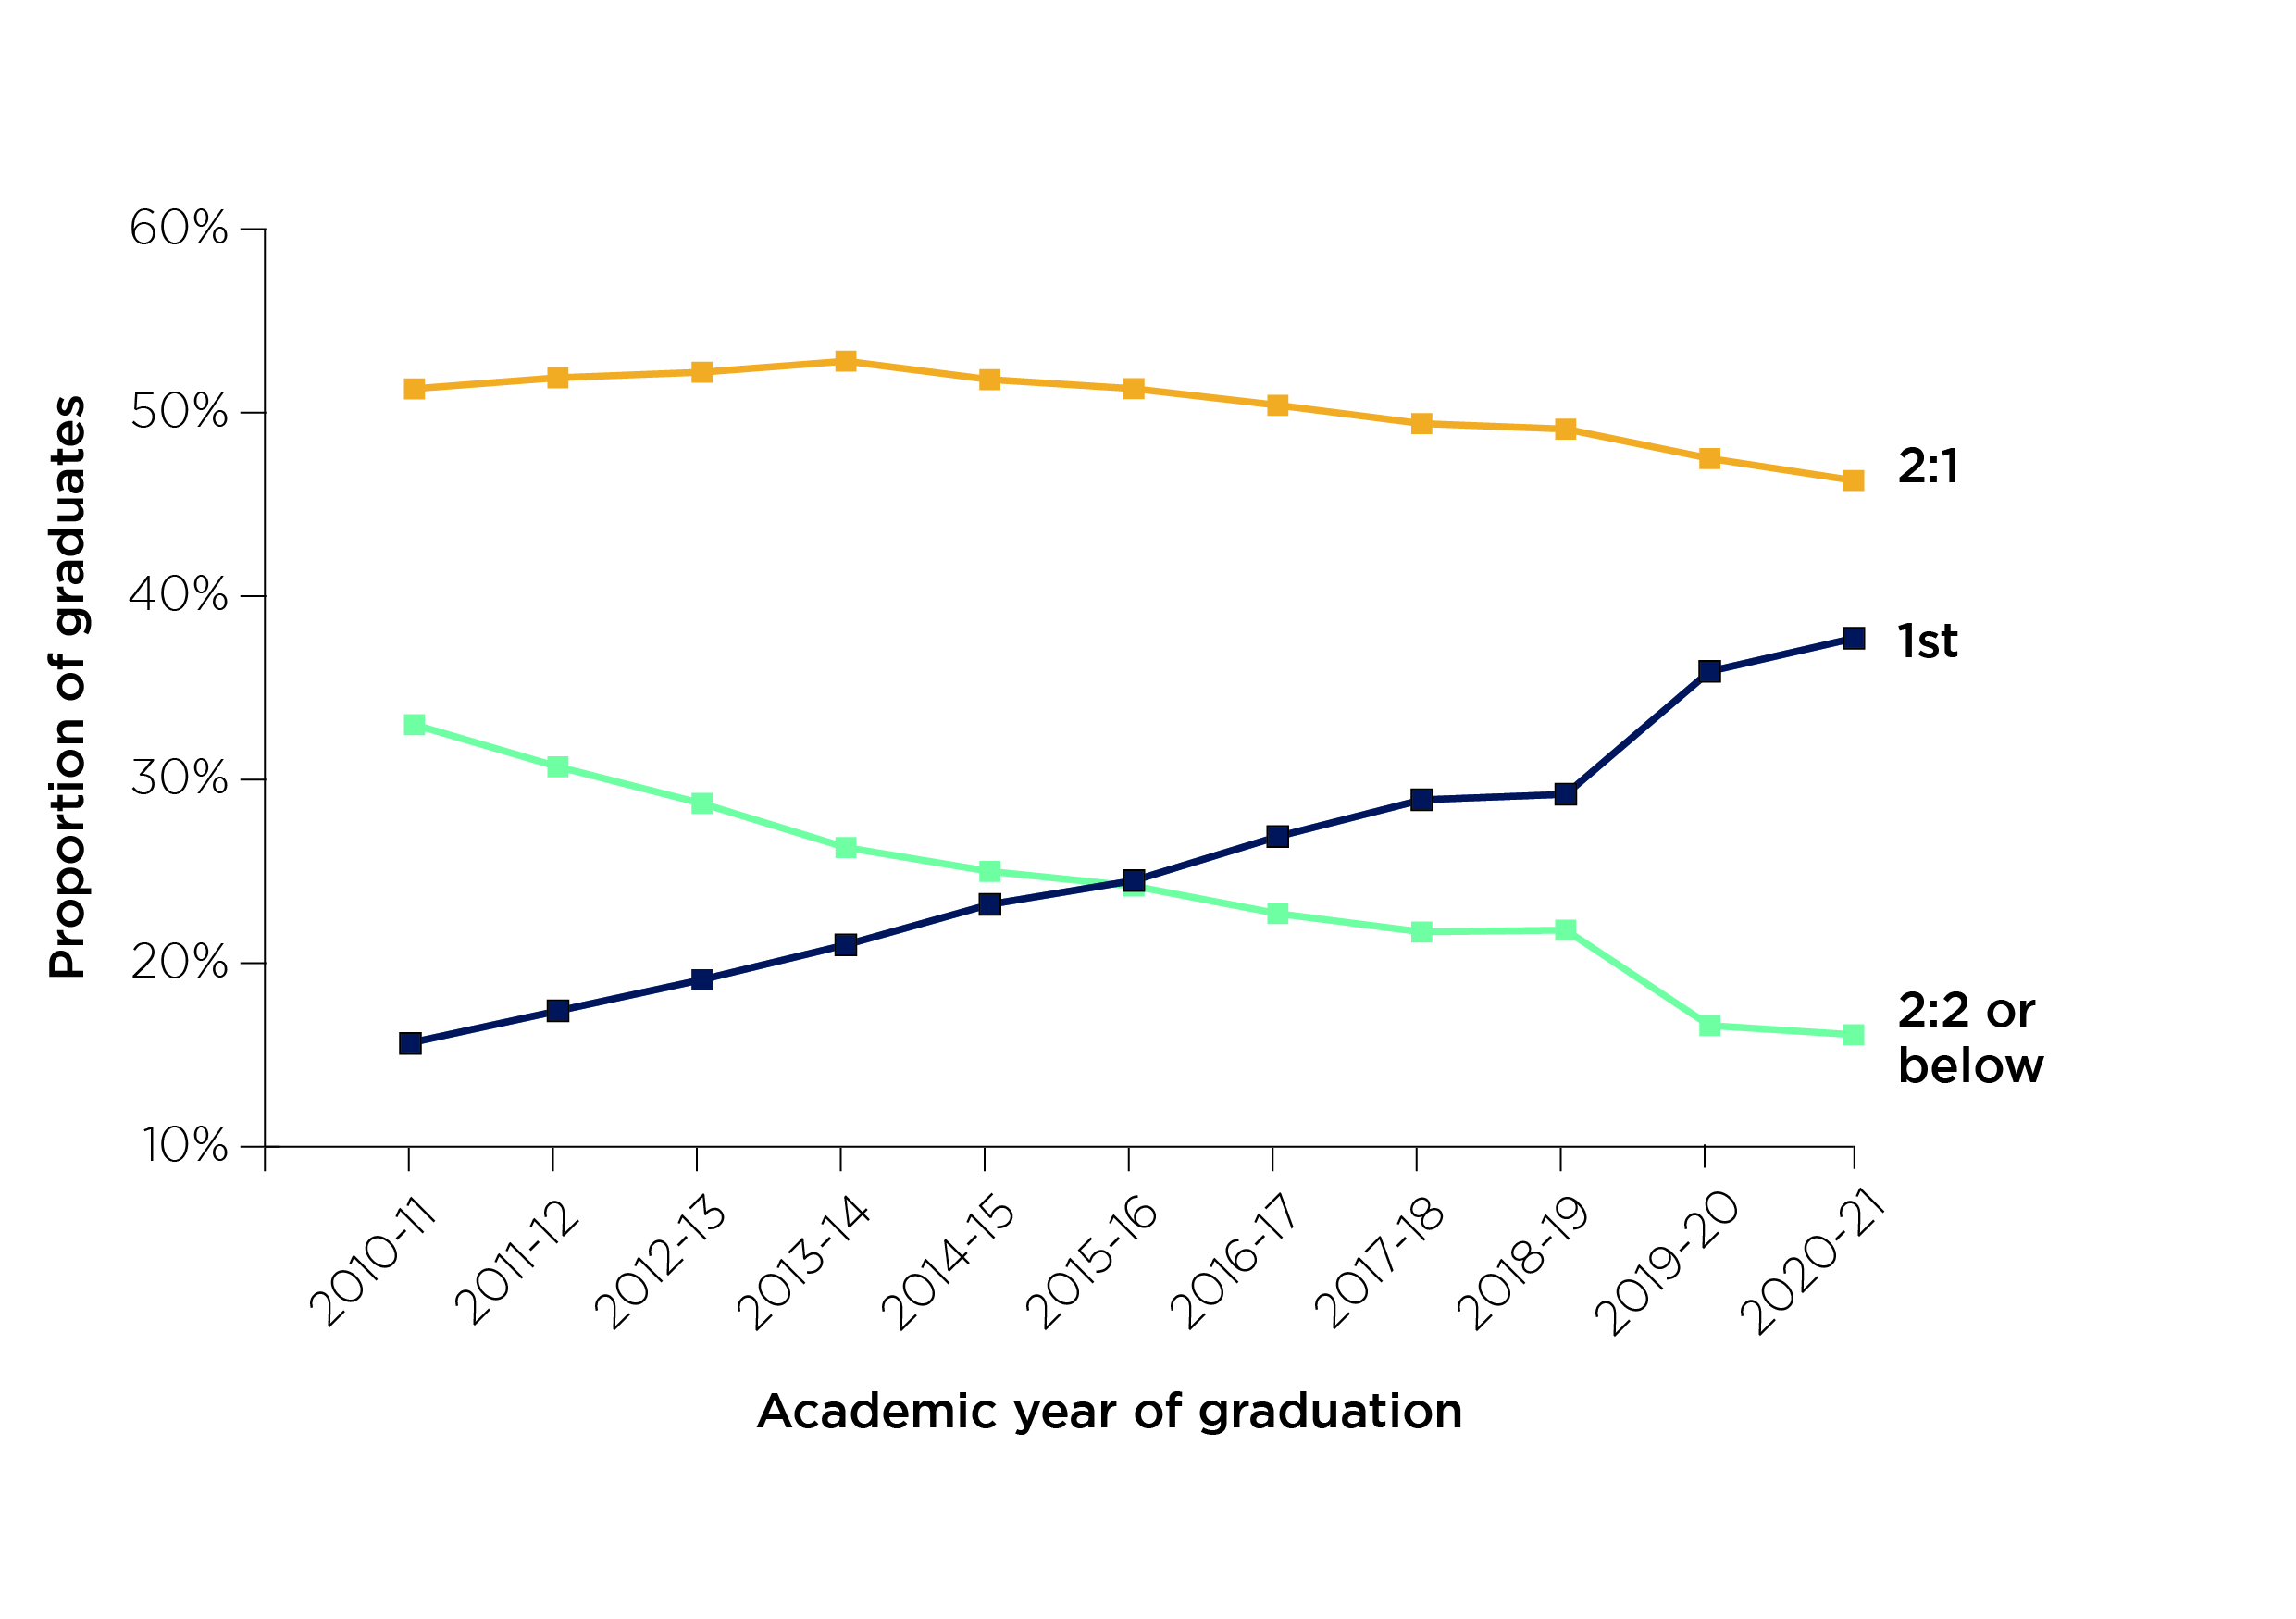
Population: Full-time UK-domiciled undergraduates with classified degrees from higher education providers in England. Source: Higher Education Statistics Agency (HESA) student data, Education and Skills Funding Council Individualised Learner Record (ILR).19 Note: The y-axis does not start at zero.
Figure 1 is a line graph with three lines tracking the respective proportions of graduates with degree classes 1st, 2:1 and 2:2 or below between 2010-11 to 2020-21. It shows a steady growth in 1sts and decrease in 2:2s and below between 2010-11 and 2017-18, with a marginal decline in 2:1s over the same period. In 2018-19 all rates hold largely constant, but in 2019-20 there is a large increase in 1sts accompanied again by a substantial decrease in 2:2s and below, and a more moderate decrease in 2:1s. The latest year of data, 2020-21, shows a more restrained increase in 1sts accompanied by moderate decreases in 2:1s and 2:2s and below.
The figure shows that:
- In 2010-11, 15.7 per cent of students gained 1sts, 51.3 per cent gained 2:1s, and 33.0 per cent gained 2:2s or below.
- In 2011-12, 17.4 per cent of students gained 1sts, 51.9 per cent gained 2:1s, and 30.7 per cent gained 2:2s or below.
- In 2012-13, 19.1 per cent of students gained 1sts, 52.2 per cent gained 2:1s, and 28.7 per cent gained 2:2s or below.
- In 2013-14, 21.0 per cent of students gained 1sts, 52.8 per cent gained 2:1s, and 26.3 per cent gained 2:2s or below.
- In 2014-15, 23.2 per cent of students gained 1sts, 51.8 per cent gained 2:1s, and 25.0 per cent gained 2:2s or below.
- In 2015-16, 24.5 per cent of students gained 1sts, 51.3 per cent gained 2:1s, and 24.2 per cent gained 2:2s or below.
- In 2016-17, 26.9 per cent of students gained 1sts, 50.4 per cent gained 2:1s, and 22.7 per cent gained 2:2s or below.
- In 2017-18, 28.9 per cent of students gained 1sts, 49.4 per cent gained 2:1s, and 21.7 per cent gained 2:2s or below.
- In 2018-19, 29.2 per cent of students gained 1sts, 49.1 per cent gained 2:1s, and 21.8 per cent gained 2:2s or below.
- In 2019-20, 35.9 per cent of students gained 1sts, 47.5 per cent gained 2:1s, and 16.6 per cent gained 2:2s or below.
- In 2020-21, 37.7 per cent of students gained 1sts, 46.3 per cent gained 2:1s, and 16.1 per cent gained 2:2s or below.
In the following year, 2018-19, following our publication of earlier analysis and expressions of concern, the annual increases stalled, with very little change in any of the overall rates.20 However, in 2019-20 there was a large increase in the rate of 1sts to 35.9 per cent, accompanied by a slight decrease in 2:1s and a sharp fall of over five percentage points in 2:2s and below. The extent to which this unprecedented change can be ascribed to the onset of the COVID-19 pandemic is discussed below. Following this, 2020-21 saw a further smaller increase in the proportion of 1sts, with an accompanying decrease in the proportions of other grades.21
While the exact proportions differ, the broad pattern of change in England in recent years reflects those recorded in the other nations of the UK.22
Differential effects
The historical data shows differences in the classifications awarded to different groups of students. For example, as Figure 2 shows, in 2010-11, 44 per cent of black students gained 1sts or 2:1s, compared with 71 per cent of white students – a gap of 27 percentage points. By 2017-18 both figures had risen, to 58.9 per cent and 82.0 per cent respectively, but the gap in attainment had reduced by only a fifth, to 23.1 percentage points.
Figure 2: Gap in degree outcomes (1sts or 2:1s) between white and black students
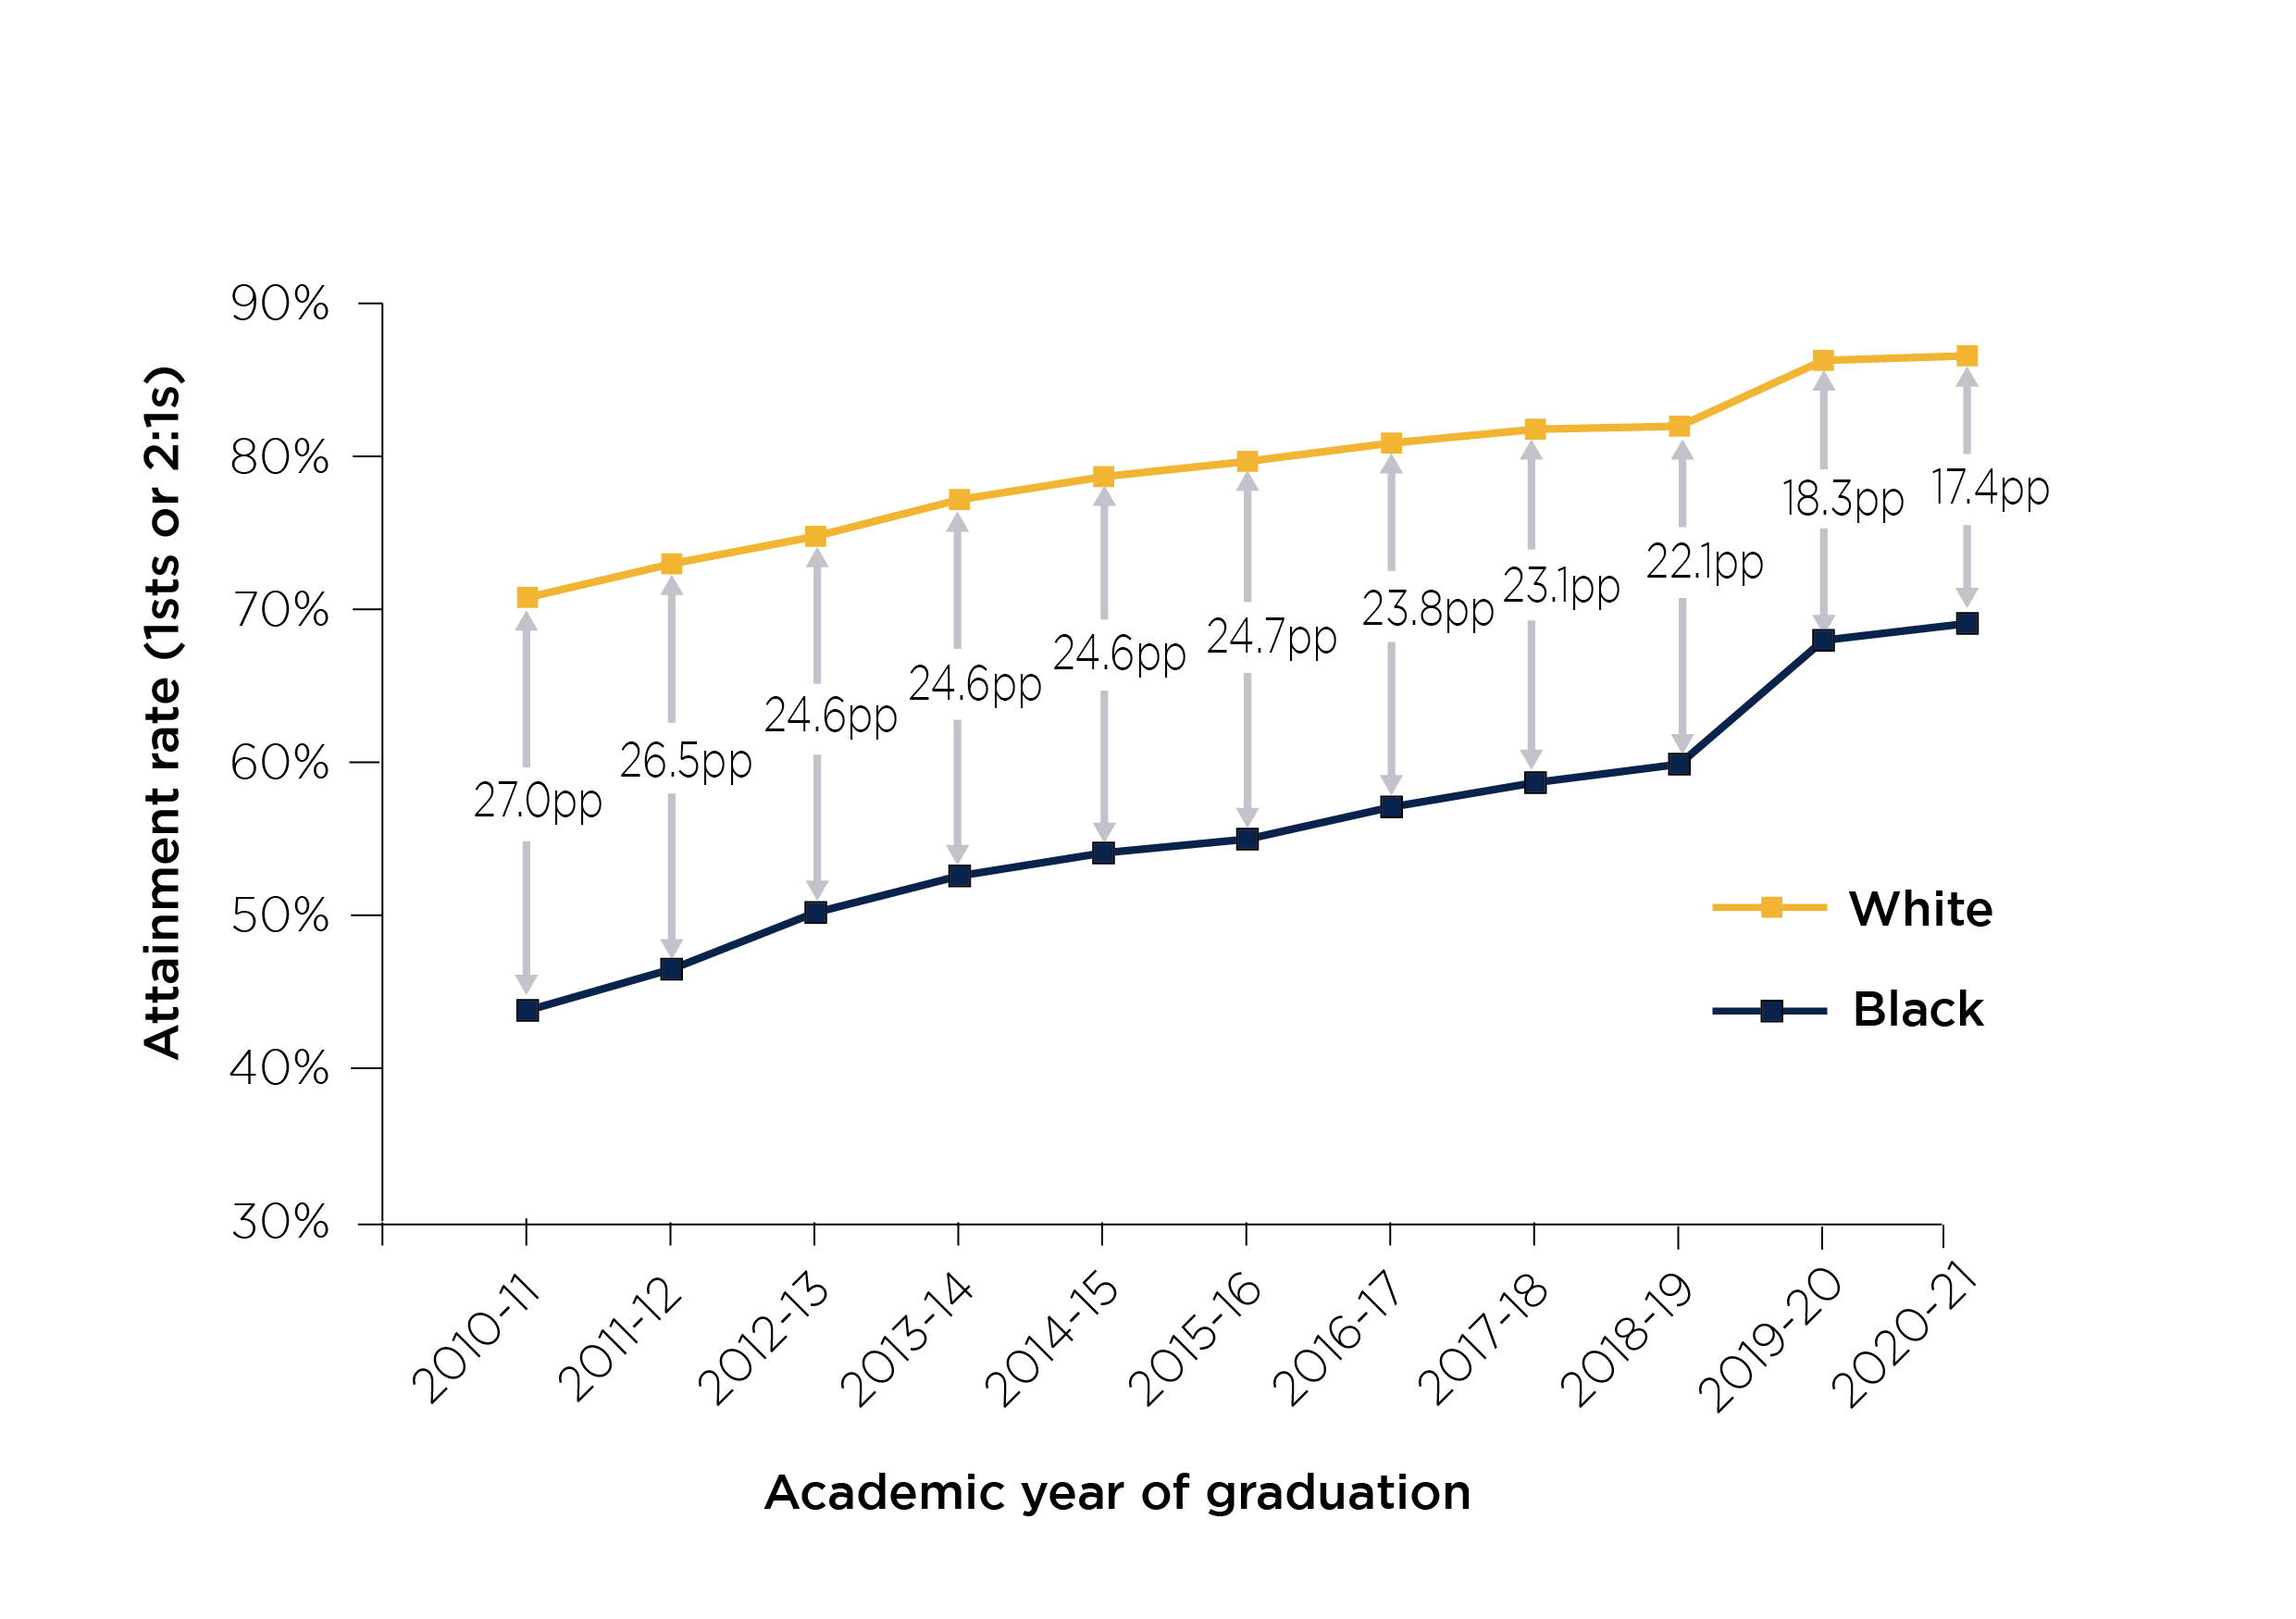
Population: Full-time UK-domiciled undergraduates with classified degrees from higher education providers in England registered as white or black. This figure excludes students of other ethnicities. Source: HESA student data, ILR.23 Note: The y-axis does not start at zero.
Figure 2 is a double line graph showing the proportion of, respectively, white and black students gaining 1sts or 2:1s from 2010-11 to 2020-21. As with the overall figures for 1sts, each line shows a steady growth from 2010-11 to 2017-18, a largely steady state in 2018-19, a substantial increase in 2019-20, and a more moderate increase in 2020-21. Though the rates for black students are considerably lower throughout, they are rising faster than those for white students, and 2019-20 saw a particularly large respective increase. The percentage point difference between the two groups’ attainment rates has been reducing accordingly throughout the time series.
The figure shows that:
- In 2010-11, 44.0 per cent of black and 71.0 per cent of white students gained 1sts or 2:1s, a difference of 27.0 percentage points.
- In 2011-12, 46.7 per cent of black and 73.2 per cent of white students gained 1sts or 2:1s, a difference of 26.5 percentage points.
- In 2012-13, 50.4 per cent of black and 75.0 per cent of white students gained 1sts or 2:1s, a difference of 24.6 percentage points.
- In 2013-14, 52.8 per cent of black and 77.4 per cent of white students gained 1sts or 2:1s, a difference of 24.6 percentage points.
- In 2014-15, 54.3 per cent of black and 78.9 per cent of white students gained 1sts or 2:1s, a difference of 24.6 percentage points.
- In 2015-16, 55.2 per cent of black and 79.9 per cent of white students gained 1sts or 2:1s, a difference of 24.7 percentage points.
- In 2016-17, 57.3 per cent of black and 81.1 per cent of white students gained 1sts or 2:1s, a difference of 23.8 percentage points.
- In 2017-18, 58.9 per cent of black and 82.0 per cent of white students gained 1sts or 2:1s, a difference of 23.1 percentage points.
- In 2018-19, 60.1 per cent of black and 82.2 per cent of white students gained 1sts or 2:1s, a difference of 22.1 percentage points.
- In 2019-20, 68.2 per cent of black and 86.5 per cent of white students gained 1sts or 2:1s, a difference of 18.3 percentage points.
- In 2020-21, 69.3 per cent of black and 86.8 per cent of white students gained 1sts or 2:1s, a difference of 17.4 percentage points.
Meanwhile, as shown in Figure 3, between 2010-11 and 2017-18 the percentage of students with a declared disability achieving 1sts or 2:1s rose from 62.9 to 75.9 per cent, while that for students without a declared disability rose from 67.4 per cent to 78.7 per cent. This attainment gap, though always smaller than that between black and white students, reduced more substantially from 4.5 to 2.8 percentage points.
Figure 3: Gap in degree outcomes (1sts or 2:1s) between disabled and non-disabled students
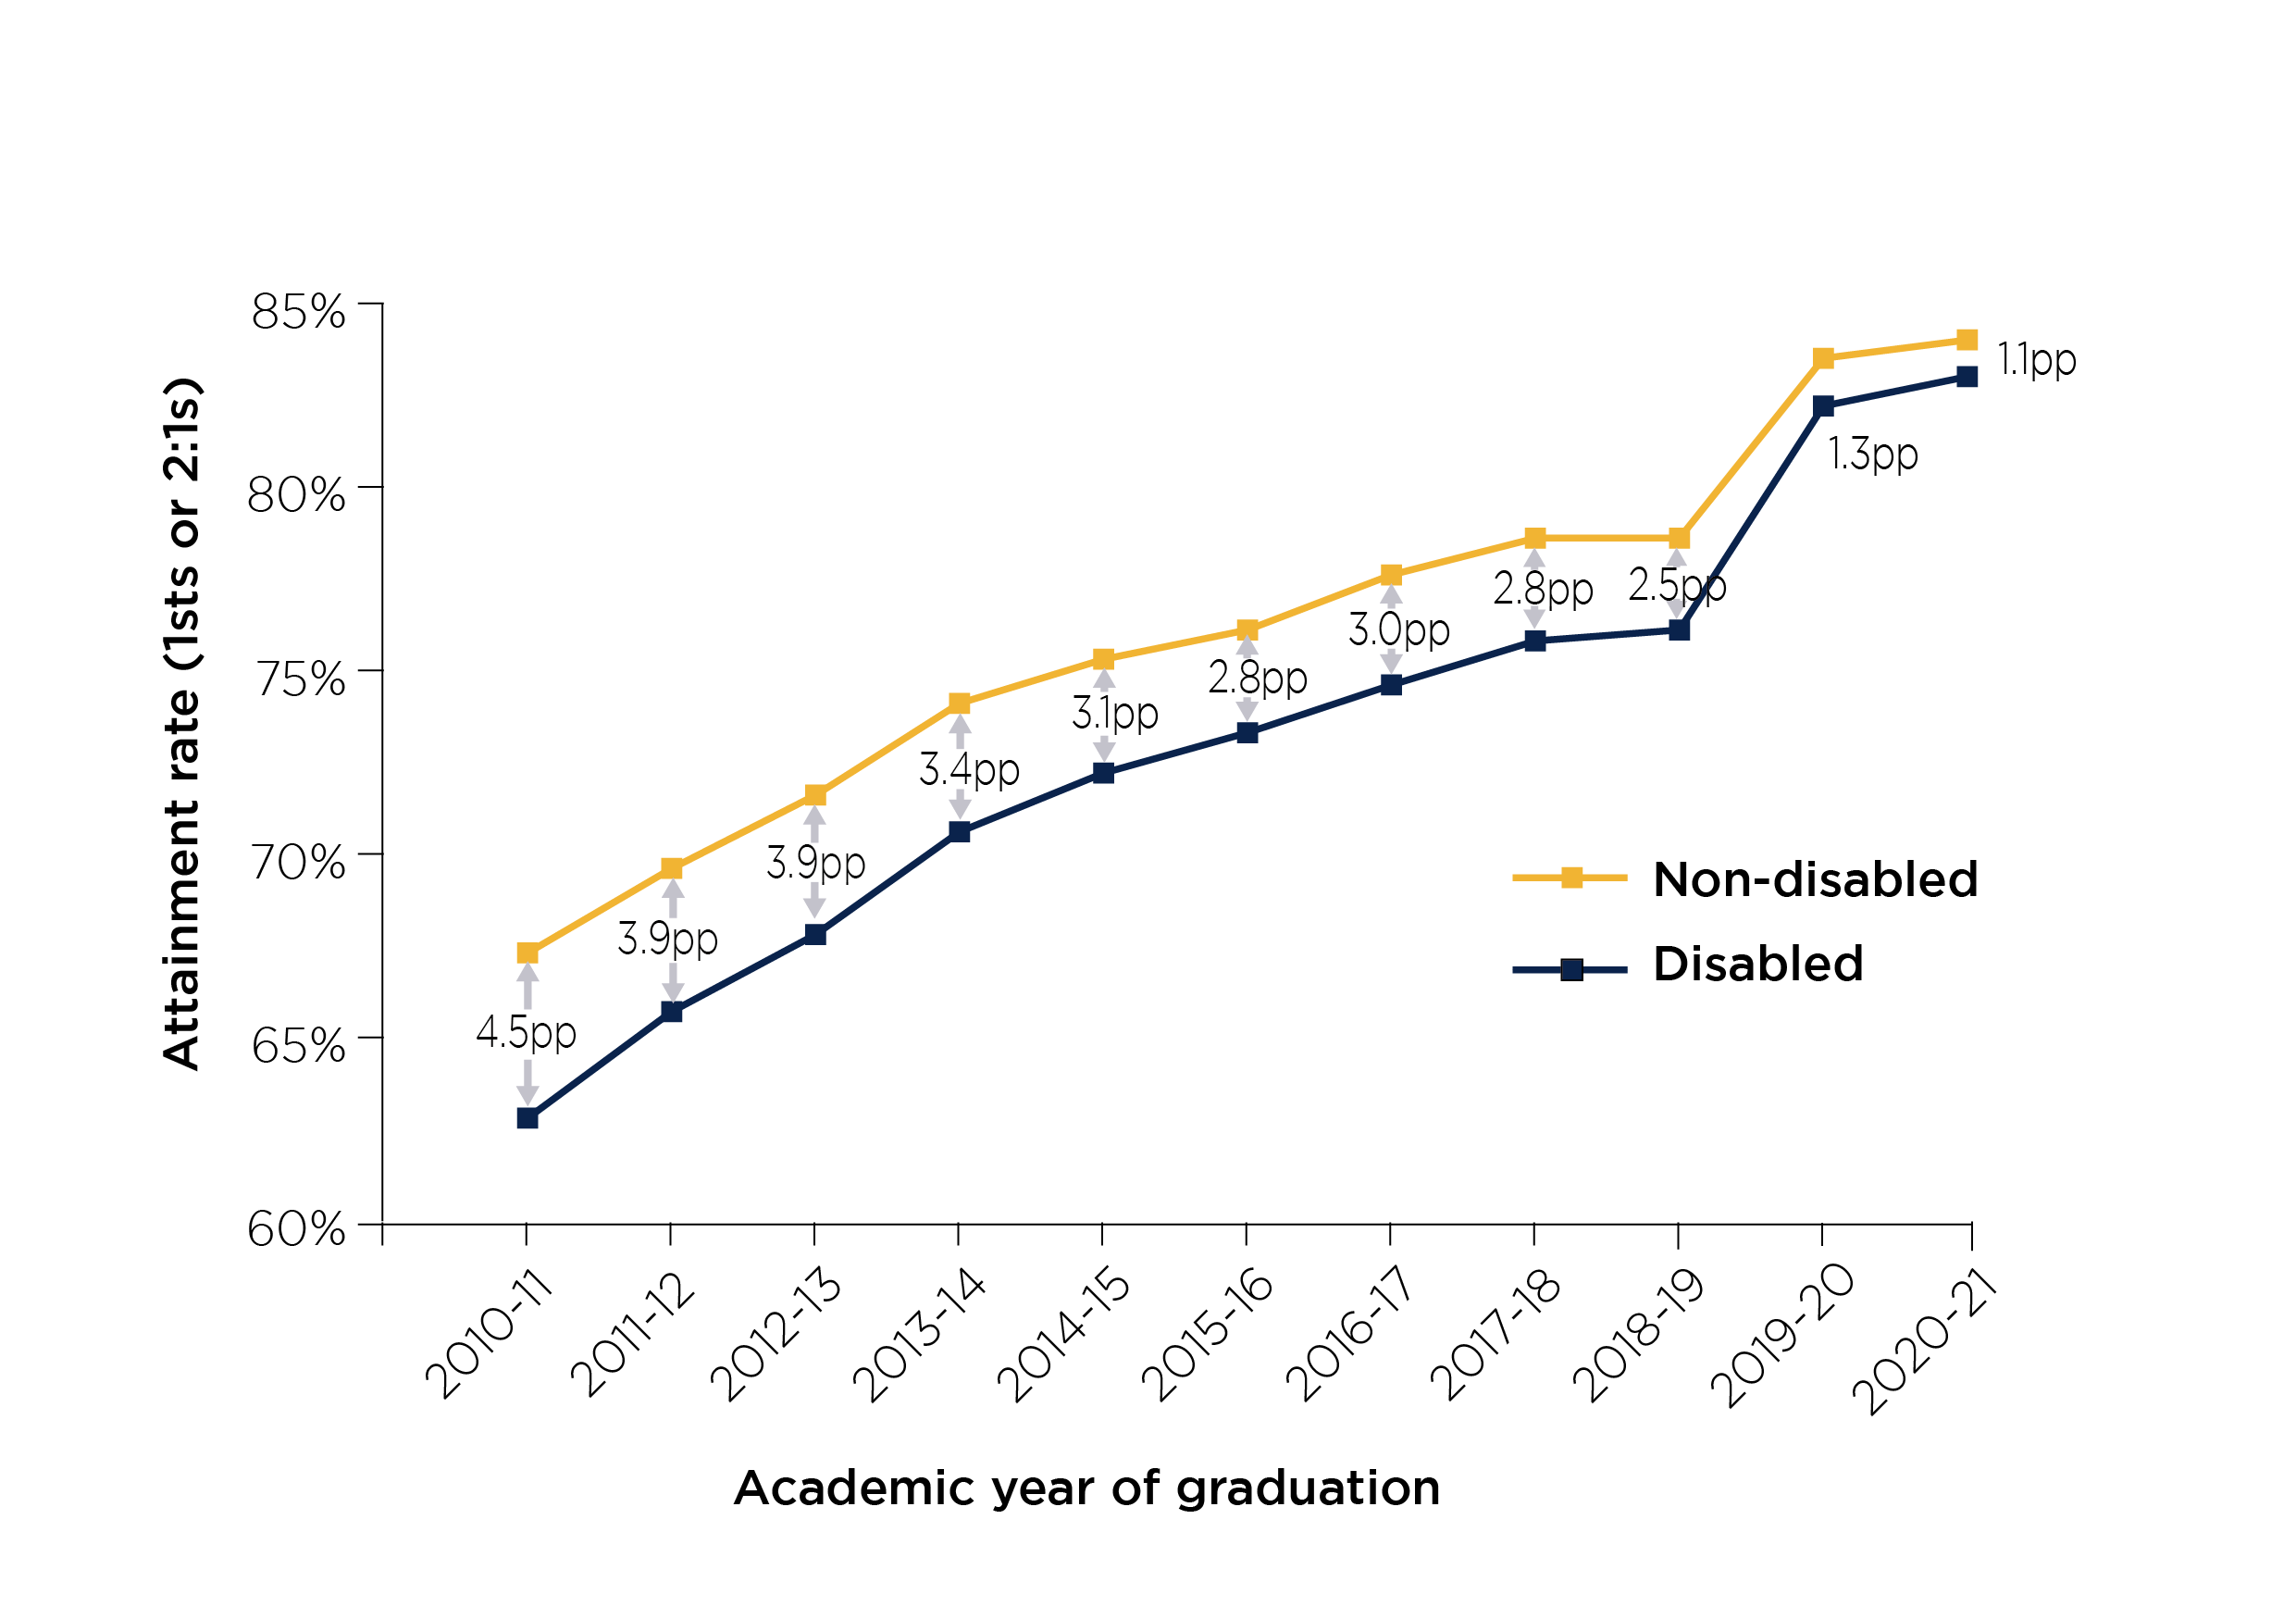
Population: Full-time UK-domiciled undergraduates with classified degrees from higher education providers in England. Source: HESA student data, ILR.24 Note: The y-axis does not start at zero.
Figure 3 is a double line graph showing the proportion of, respectively, disabled and non-disabled students gaining 1sts or 2:1s from 2010-11 to 2020-21. As with the overall figures for 1sts, each line shows a steady growth from 2010-11 to 2017-18, a largely steady state in 2018-19, a substantial increase in 2019-20, and a more moderate increase in 2020-21. Though the rates for disabled students are considerably lower throughout, they are rising faster than those for non-disabled students, and 2019-20 saw a particularly large respective increase. The percentage point difference between the two groups’ attainment rates has been reducing accordingly throughout the time series.
The figure shows that:
- In 2010-11, 62.9 per cent of non-disabled and 67.4 per cent of disabled students gained 1sts or 2:1s, a difference of 4.5 percentage points.
- In 2011-12, 65.8 per cent of disabled and 69.7 per cent of non-disabled students gained 1sts or 2:1s, a difference of 3.9 percentage points.
- In 2012-13, 67.9 per cent of disabled and 71.7 per cent of non-disabled students gained 1sts or 2:1s, a difference of 3.9 percentage points.
- In 2013-14, 70.7 per cent of disabled and 74.2 per cent of non-disabled students gained 1sts or 2:1s, a difference of 3.4 percentage points.
- In 2014-15, 72.3 per cent of disabled and 75.4 per cent of non-disabled students gained 1sts or 2:1s, a difference of 3.1 percentage points.
- In 2015-16, 73.4 per cent of disabled and 76.2 per cent of non-disabled students gained 1sts or 2:1s, a difference of 2.8 percentage points.
- In 2016-17, 74.7 per cent of disabled and 77.7 per cent of non-disabled students gained 1sts or 2:1s, a difference of 3.0 percentage points.
- In 2017-18, 75.9 per cent of disabled and 78.7 per cent of non-disabled students gained 1sts or 2:1s, a difference of 2.8 percentage points.
- In 2018-19, 76.2 per cent of disabled and 78.7 per cent of non-disabled students gained 1sts or 2:1s, a difference of 2.5 percentage points.
- In 2019-20, 82.3 per cent of disabled and 83.6 per cent of non-disabled students gained 1sts or 2:1s, a difference of 1.3 percentage points.
- In 2020-21, 83.1 per cent of disabled and 84.1 per cent of non-disabled students gained 1sts or 2:1s, a difference of 1.1 percentage points.
These differences in respective attainment rates held largely steady in 2018-19, but the most recent changes affected them in different ways. Thus, the increase in 2019-20 was even higher among black students than among white students. The proportion of white students gaining a 1st or 2:1 increased by 4.3 percentage points from 2018-19 to 2019-20, while for black students the increase was 8.1 percentage points.25
The same pattern is visible in the attainment of disabled students, though as stated the attainment gap before the pandemic was narrower. The proportion of disabled students who gained a 1st or 2:1 rose by 6.1 percentage points between 2018-19 and 2019-20, while that for non-disabled students rose by 4.9 percentage points.26
The effect of the recent changes has thus been to reduce, though not eliminate, these differences.27 It cannot be right that the chances of achieving a 1st or 2:1 are determined in part by a student’s personal characteristics, and the OfS has consistently sought to ensure that universities and colleges are working to close these longstanding gaps. As things stand, however, they have been reduced by increasing the proportion of higher classifications for black and disabled students, rather than addressing any historical grade inflation for white or non-disabled students, or for students overall.
These changes may nevertheless be a welcome sign of improvement in the sector. However, to be credible to the public, sudden substantial changes to previously intractable attainment gaps need to be explained. Here as elsewhere, it is essential that the classifications awarded are a genuine reflection of student achievement.
By contrast, the gap in attainment of 1sts and 2:1s between mature and younger learners, which at around 10 percentage points in 2018-19 was comparable in size with that between white and black students, narrowed by only 0.2 percentage points in 2019-20.28
As Figure 4 shows, another striking difference applies across the range of students entering higher education with different grades in their A-levels or equivalent qualifications. Long-term increases in 1sts and 2:1s are visible across all sets of qualifications. The differences for certain groupings, predominantly those with the weakest A-level scores, are prominent across the decade.29
Figure 4: Degree attainment by entry qualifications for academic years 2010-11 and 2018-19 to 2020-21
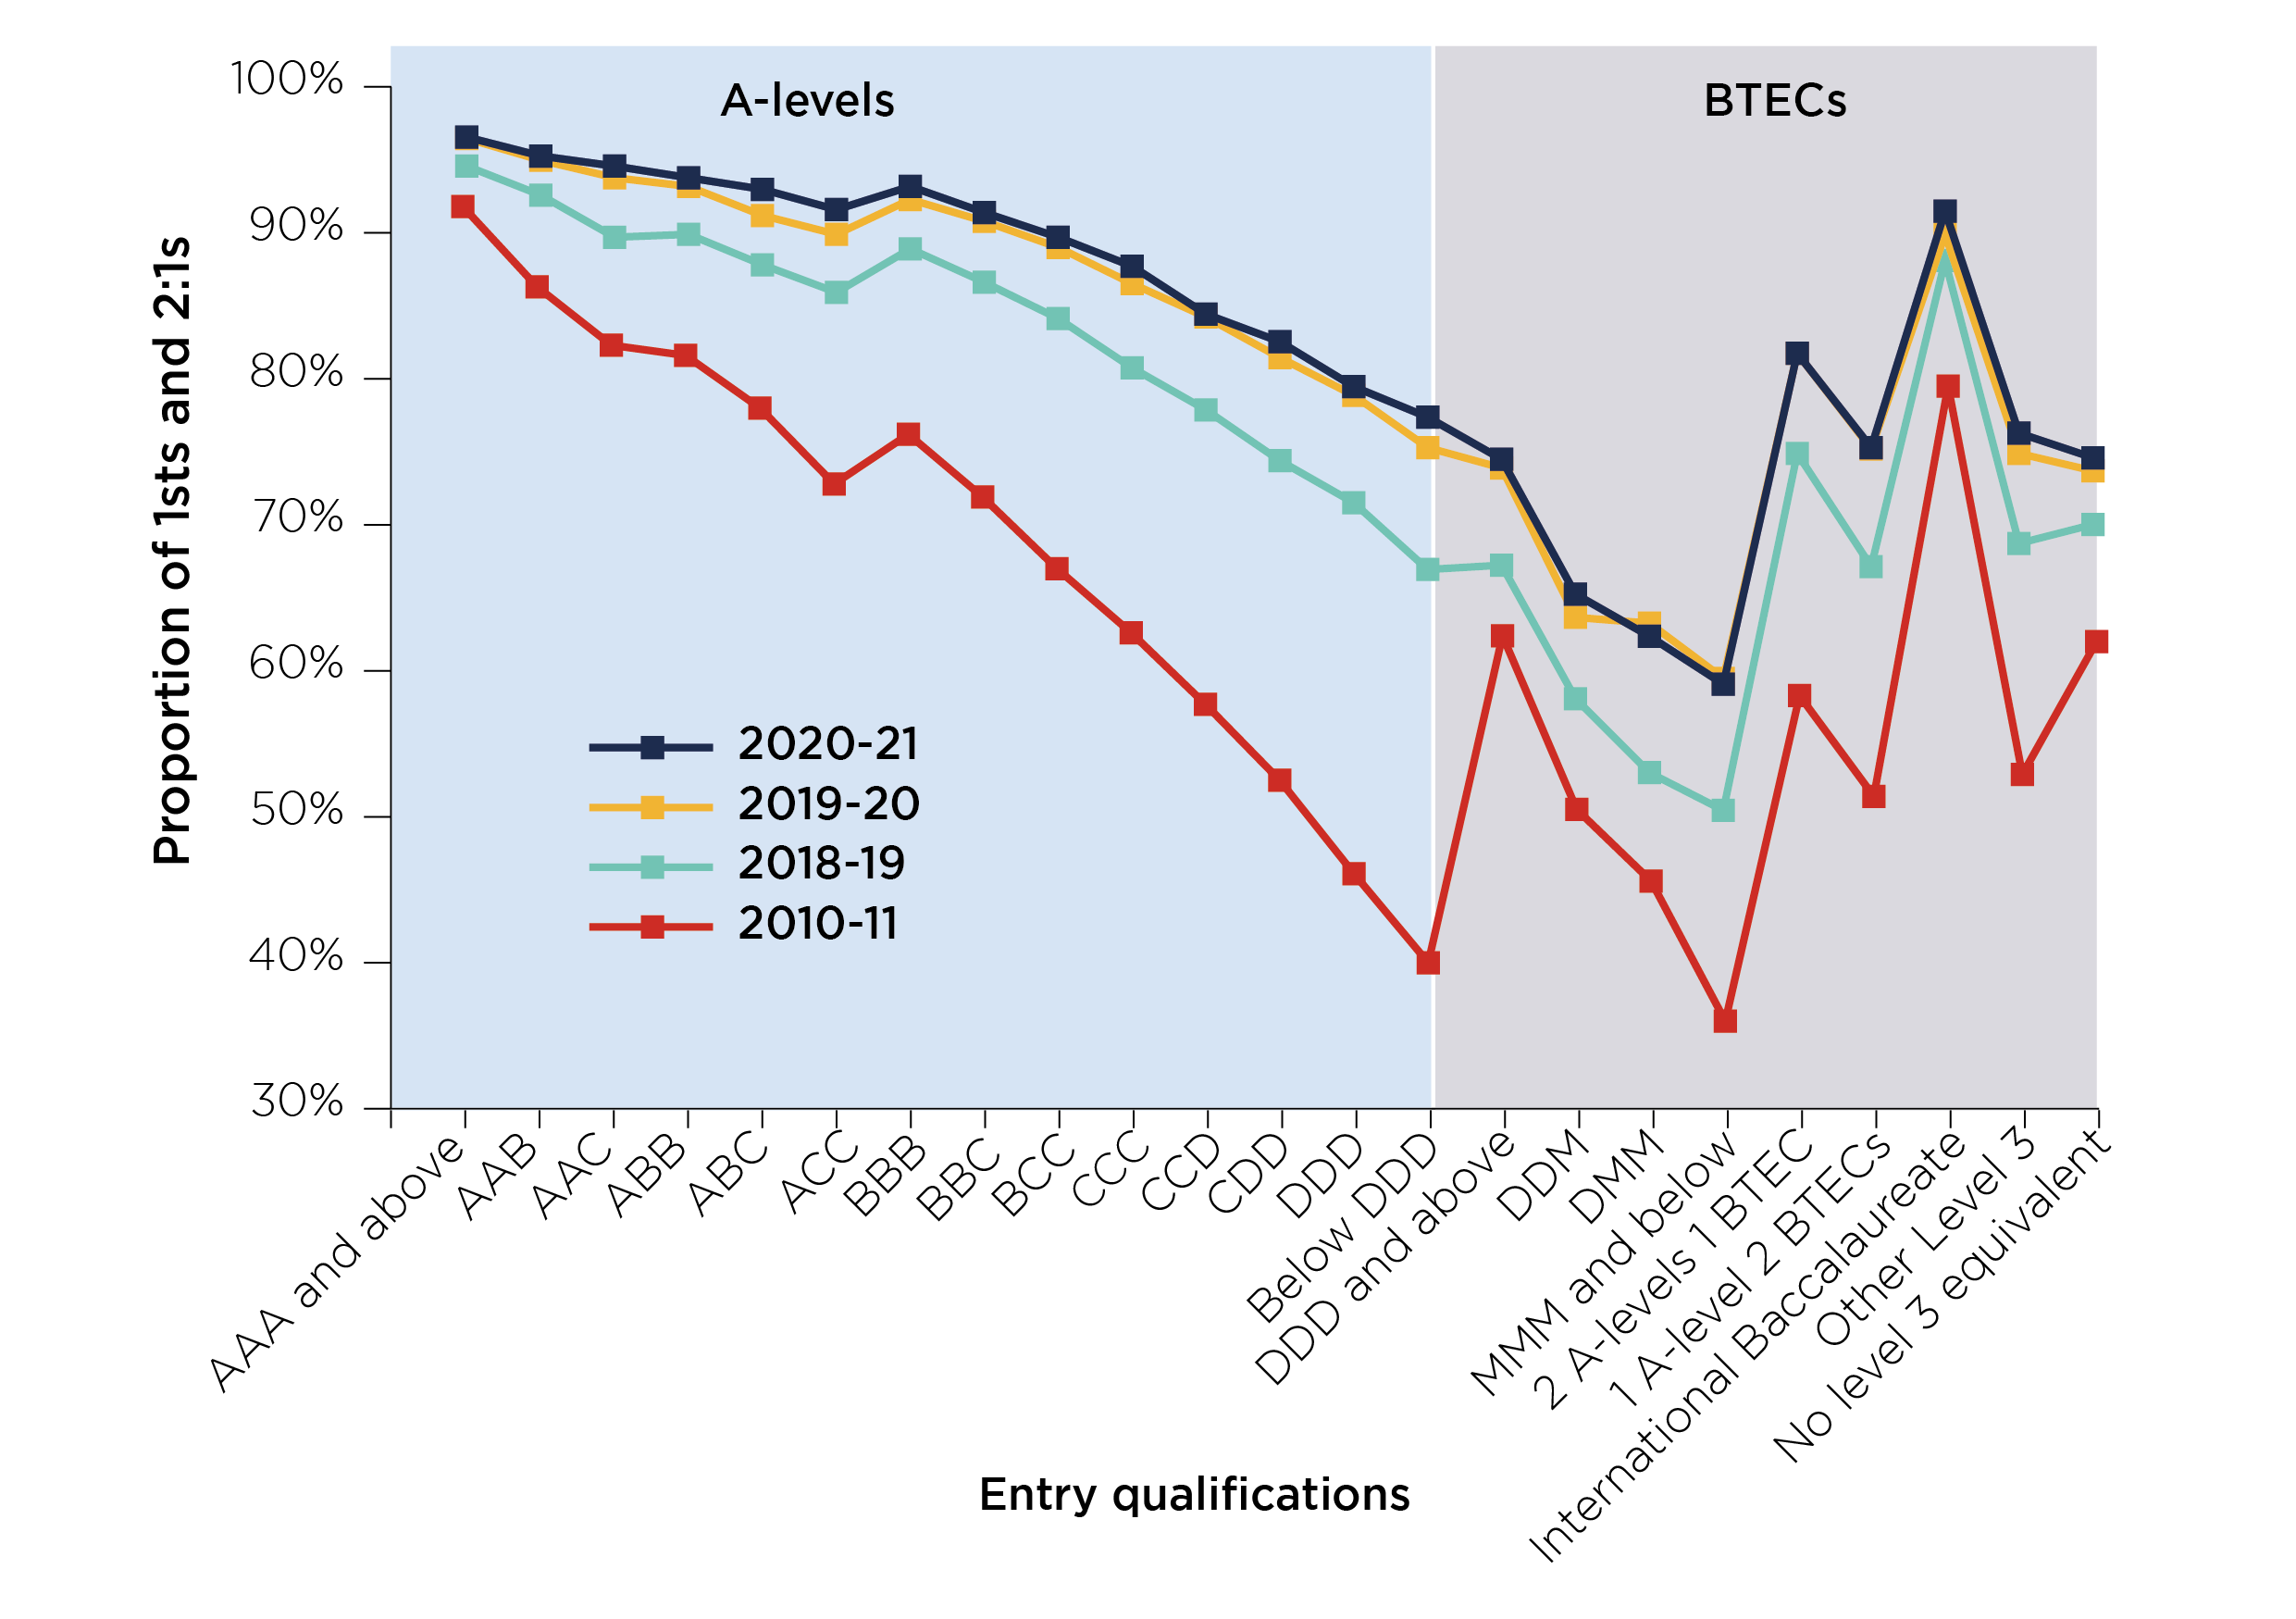
Population: Full-time UK-domiciled undergraduates with classified degrees with the entry qualifications shown, from higher education providers in England with sufficient data for all the years considered. Source: OfS, ‘Analysis of degree classifications over time: Changes in graduate attainment from 2010-11 to 2020-21’, based on HESA student data, ILR.30 Note: The y-axis does not start at zero.
Figure 4 shows the rates of attainment of 1sts and 2:1s by students with various qualifications on entry to higher education in 2020-11, 2018-19, 2019-20 and 2020-21. With rare exceptions, the rates for each group increase over time, sometimes very strikingly. On the whole, the increase in attainment of these grades is considerably higher among students with lower entry qualifications.
For students with A-levels, the figure shows that:
- 8 per cent of those with grades of AAA and above gained 1sts or 2:1s in 2010-11, 94.8 per cent in 2018-19, 96.7 per cent in 2019-20 and 96.8 per cent in 2020-21.
- 3 per cent of those with grades of AAB gained 1sts or 2:1s in 2010-11, 92.8 per cent in 2018-19, 95.2 per cent in 2019-20 and 95.5 per cent in 2020-21.
- 3 per cent of those with grades of AAC gained 1sts or 2:1s in 2010-11, 89.9 per cent in 2018-19, 94.0 per cent in 2019-20 and 94.8 per cent in 2020-21.
- 6 per cent of those with grades of ABB gained 1sts or 2:1s in 2010-11, 90.1 per cent in 2018-19, 93.4 per cent in 2019-20 and 94.0 per cent in 2020-21.
- 0 per cent of those with grades of ABC gained 1sts or 2:1s in 2010-11, 88.0 per cent in 2018-19, 91.4 per cent in 2019-20 and 93.2 per cent in 2020-21.
- 8 per cent of those with grades of ACC gained 1sts or 2:1s in 2010-11, 86.1 per cent in 2018-19, 90.1 per cent in 2019-20 and 91.8 per cent in 2020-21.
- 2 per cent of those with grades of BBB gained 1sts or 2:1s in 2010-11, 89.1 per cent in 2018-19, 92.5 per cent in 2019-20 and 93.4 per cent in 2020-21.
- 9 per cent of those with grades of BBC gained 1sts or 2:1s in 2010-11, 86.8 per cent in 2018-19, 91.0 per cent in 2019-20 and 91.6 per cent in 2020-21.
- 0 per cent of those with grades of BCC gained 1sts or 2:1s in 2010-11, 84.3 per cent in 2018-19, 89.2 per cent in 2019-20 and 89.9 per cent in 2020-21.
- 6 per cent of those with grades of CCC gained 1sts or 2:1s in 2010-11, 80.9 per cent in 2018-19, 86.7 per cent in 2019-20 and 87.9 per cent in 2020-21.
- 7 per cent of those with grades of CCD gained 1sts or 2:1s in 2010-11, 78.0 per cent in 2018-19, 84.4 per cent in 2019-20 and 84.6 per cent in 2020-21.
- 5 per cent of those with grades of CDD gained 1sts or 2:1s in 2010-11, 74.5 per cent in 2018-19, 81.6 per cent in 2019-20 and 82.7 per cent in 2020-21.
- 1 per cent of those with grades of DDD gained 1sts or 2:1s in 2010-11, 71.6 per cent in 2018-19, 79.0 per cent in 2019-20 and 79.6 per cent in 2020-21.
- 0 per cent of those with grades of below DDD gained 1sts or 2:1s in 2010-11, 67.0 per cent in 2018-19, 75.4 per cent in 2019-20 and 77.5 per cent in 2020-21.
For those with BTECs, it shows that:
- 4 per cent of those with grades of DDD and above gained 1sts or 2:1s in 2010-11, 67.3 per cent in 2018-19, 74.0 per cent in 2019-20 and 74.6 per cent in 2020-21.
- 5 per cent of those with grades of DDM gained 1sts or 2:1s in 2010-11, 58.1 per cent in 2018-19, 63.7 per cent in 2019-20 and 65.3 per cent in 2020-21.
- 6 per cent of those with grades of DMM gained 1sts or 2:1s in 2010-11, 53.0 per cent in 2018-19, 63.3 per cent in 2019-20 and 62.4 per cent in 2020-21.
- 0 per cent of those with grades of MMM and below gained 1sts or 2:1s in 2010-11, 50.4 per cent in 2018-19, 59.5 per cent in 2019-20 and 59.1 per cent in 2020-21.
For those with mixed A-levels and BTECs, it shows that:
- 3 per cent of those with two A-levels and one BTEC gained 1sts or 2:1s in 2010-11, 75.0 per cent in 2018-19, 81.9 per cent in 2019-20 and 81.9 per cent in 2020-21.
- 4 per cent of those with one A-level and two BTECs gained 1sts or 2:1s in 2010-11, 67.2 per cent in 2018-19, 75.3 per cent in 2019-20 and 75.4 per cent in 2020-21.
For other students, it shows that:
- 5 per cent of those with International Baccalaureates gained 1sts or 2:1s in 2010-11, 88.3 per cent in 2018-19, 90.1 per cent in 2019-20 and 91.7 per cent in 2020-21.
- 9 per cent of those with other Level 3 qualifications gained 1sts or 2:1s in 2010-11, 68.8 per cent in 2018-19, 75.0 per cent in 2019-20 and 76.4 per cent in 2020-21.
- 0 per cent of those with no Level 3 qualifications gained 1sts or 2:1s in 2010-11, 70.1 per cent in 2018-19, 73.8 per cent in 2019-20 and 74.7 per cent in 2020-21.
Effects of the pandemic
As noted, the largest overall increase in 1sts took place in the year of onset of the COVID-19 pandemic, when many universities changed aspects of their assessment methods to respond to the exceptional circumstances. However, the lack of change in 2018-19 relative to 2017-18 already represented a departure from previous trends, making it difficult to envisage how attainment might have looked in 2019-20 in the absence of the pandemic.
Not all universities and colleges responded in the same way to the pandemic, and we cannot provide a definitive reason for this increase from the information we currently have. Notably, though, many universities’ pandemic strategies included ‘no detriment’ and ‘safety net’ policies, designed to protect students’ results on the basis of their past assessments and to take into account the impact of the pandemic on the multiple personal factors underlying performance. Universities and colleges also expanded online student support, in many cases moving to entirely online delivery of courses and assessment.31
Some of these universities have argued that that, rather than reducing rigour, these policies improved their students’ confidence and reduced their anxiety, leading to a real improvement in achievement and a deserved increase in the degree classifications awarded.32 These arguments have not yet been tested.
The pandemic and its associated lockdowns may have had other indirect effects. For instance, it is not difficult to imagine that the move to wholly online teaching, without the need for physical attendance, could have helped bridge the attainment gap between disabled and non-disabled students; or that mature students, who are more likely to have families and whose caring responsibilities would thus have increased during school and nursery closures, would have seen no comparable jump in attainment.
The most recent growth in higher degree classifications coincides with the pandemic, and we need to avoid any grade inflation arising from those exceptional circumstances becoming a permanent feature of the future classification system. However, the longer-term trend also requires further investigation and explanation.
Explaining the increases
The OfS analysis of the overall increases at 143 registered higher education providers from 2010-11 to 2020-21 used a statistical model to predict the outcomes from 2011-12 onwards, based on the changes in the characteristics of graduates during these years.33 This model is not intended to be prescriptive and does not represent an ‘expectation’, in the sense of what we would wish to see happen. Rather, it is a description of the state of affairs we would expect to play out based on certain assumptions, including that there were no changes in the proportions of particular classifications awarded to students with different characteristics.
Comparing the actual results with those predicted based on the shifts in demographic proportions reveals the changes that can be regarded as ‘unexplained’ by the model. In calculating the predictions, an assumption is made for the sake of argument that the outcomes for specific demographic groups will remain the same over time. The analysis says nothing about whether or why these might in fact change, and does not imply that historical differences in performance between student groups are acceptable.
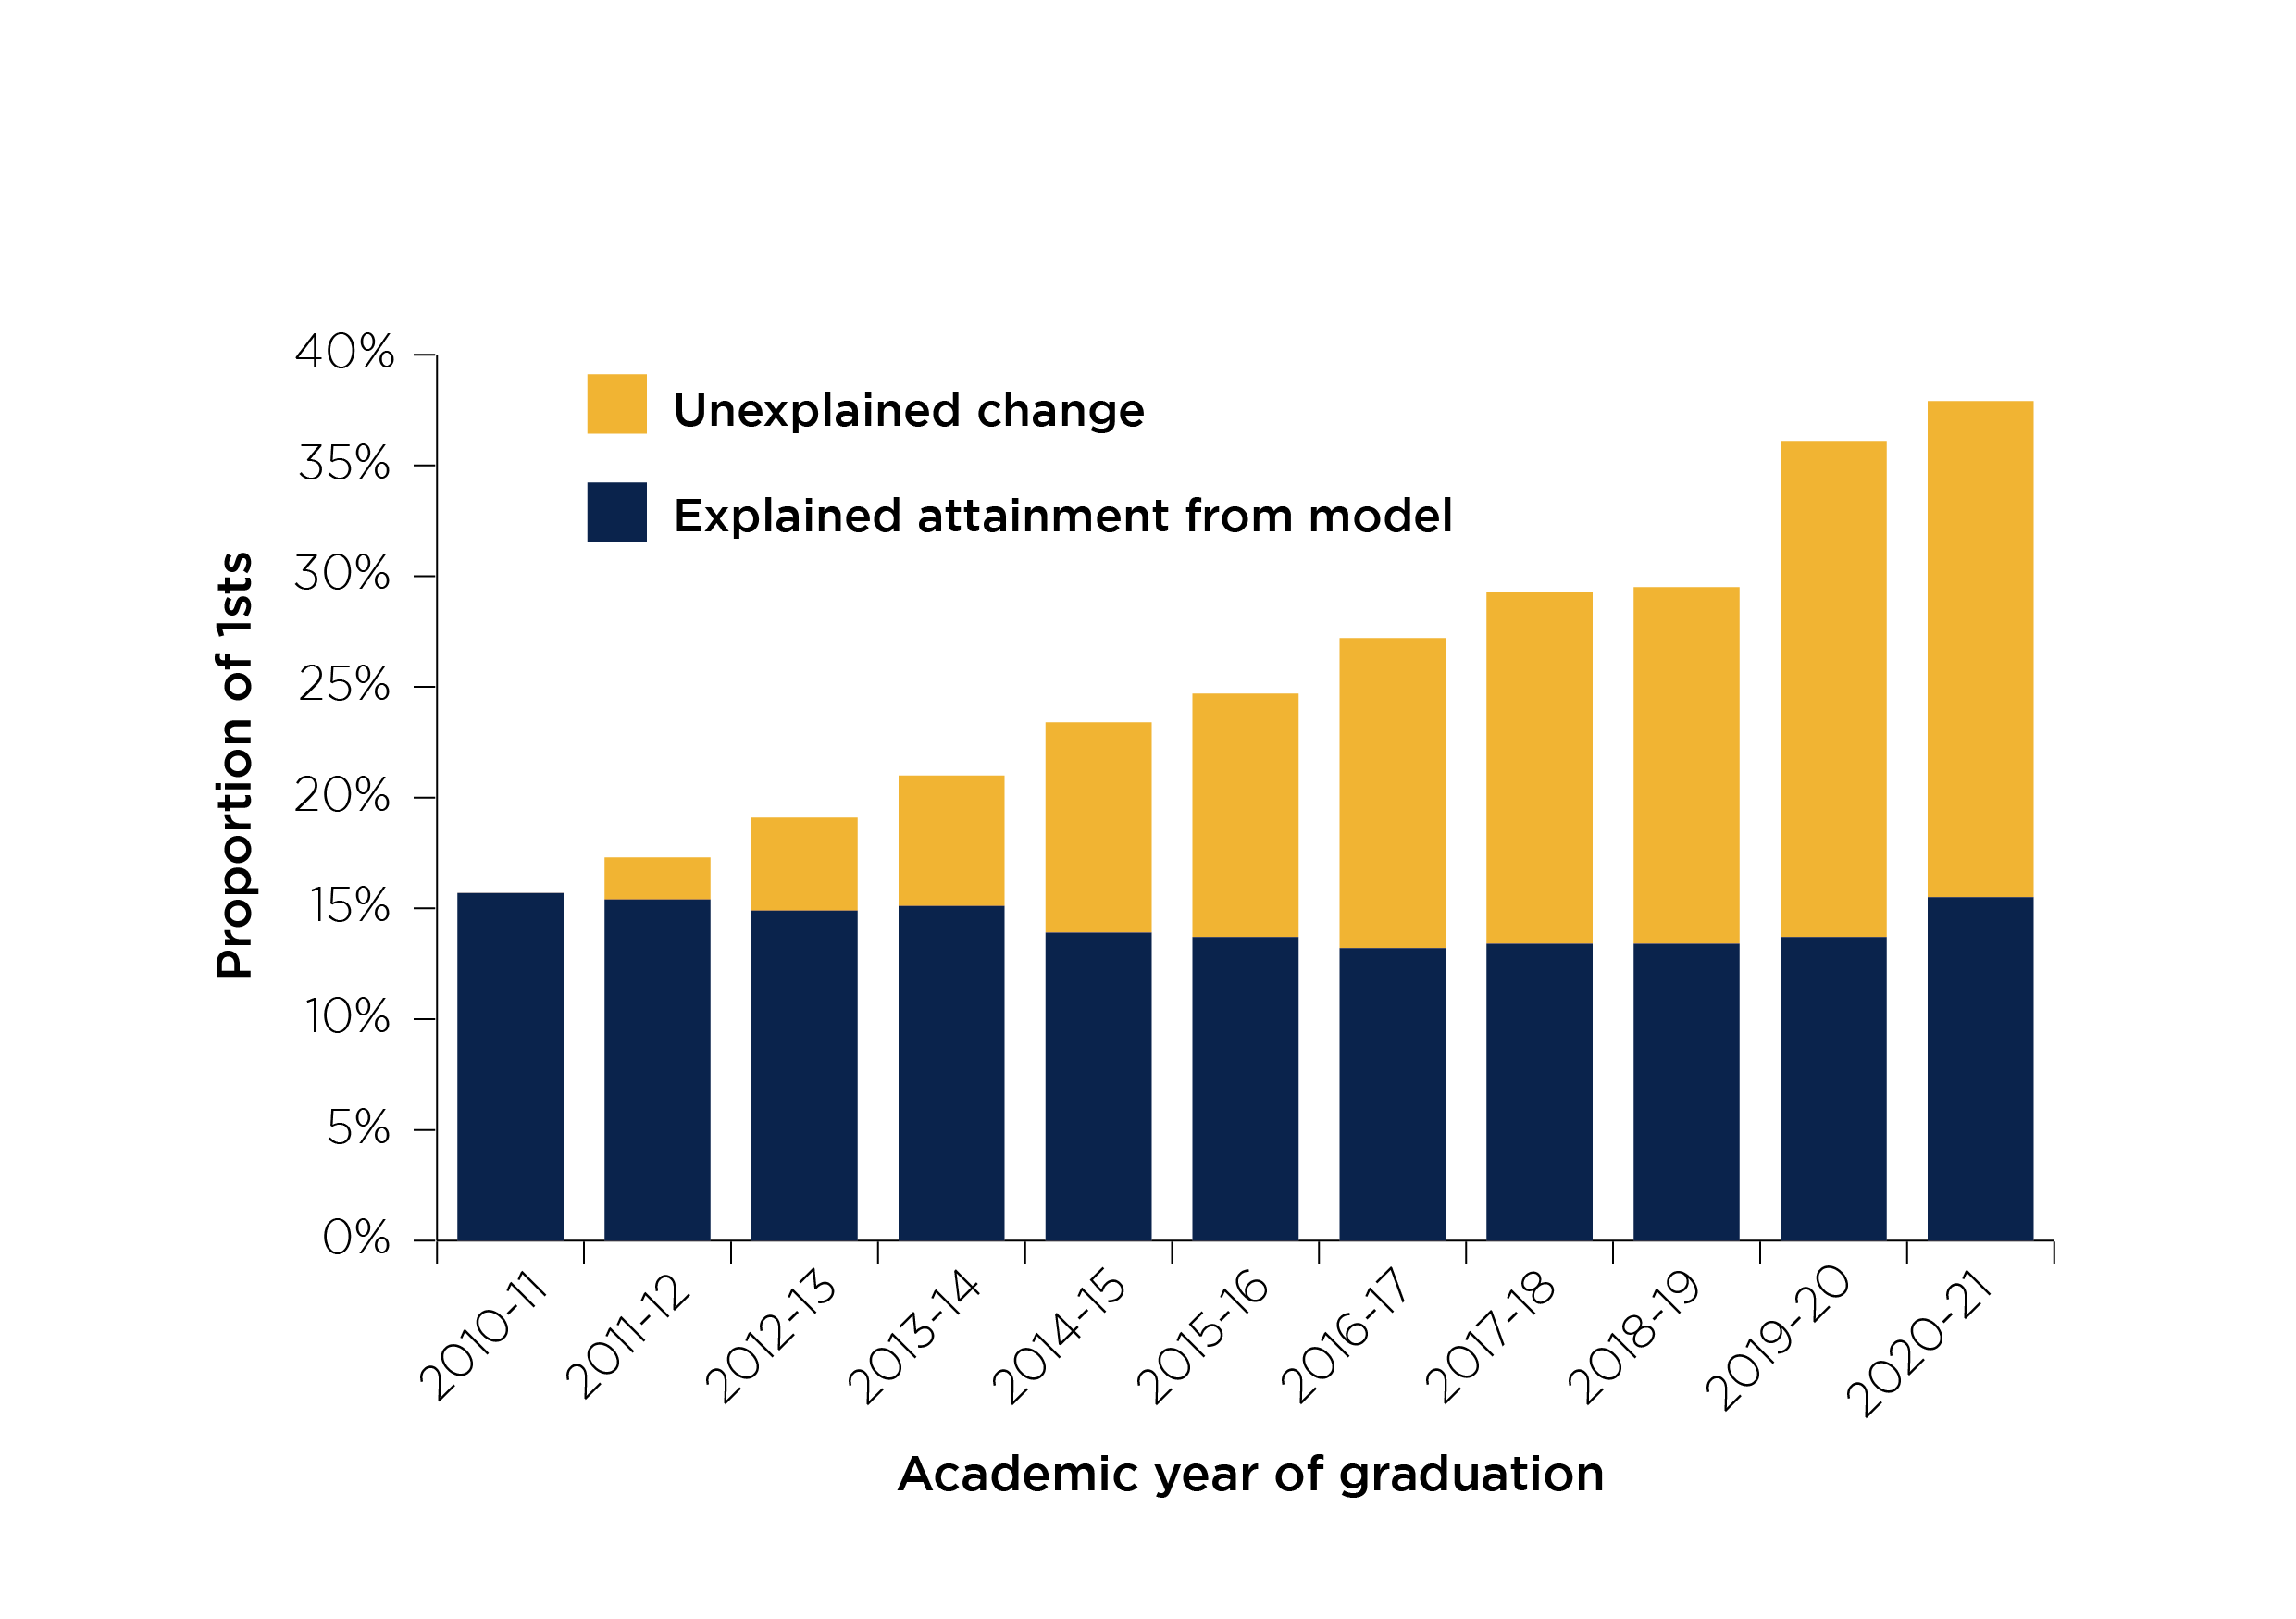
The prediction shows the proportion of 1sts falling between 2010-11 and 2018-19, by 2.3 percentage points, whereas in reality it increased by 13.8 percentage points. This means that, according to the model, 16.1 percentage points of the 29.7 per cent obtaining 1sts in 2018-19 represent unexplained change from the outcomes in 2010-11.34 Following the additional changes seen during the pandemic, the figure for 2020-21 shows 22.4 percentage points of 37.9 per cent representing unexplained change. The annual progression is illustrated in Figure 5.
Figure 5: Observed and unexplained sector-level changes in first class degree attainment
Population: Full-time UK-domiciled undergraduates with classified degrees, from higher education providers in England with sufficient data for all the years considered. Source: OfS, ‘Analysis of degree classifications over time: Changes in graduate attainment from 2010-11 to 2020-21’, based on HESA student data, ILR.35
Figure 5 is a stacked bar graph showing explained attainment in 1sts based on our statistical model, and the accompanying unexplained change, for the years 2010-11 to 2020-21. It shows a slight overall decrease in explained attainment, and a large increase in unexplained change, over the period.
It shows that:
- In 2010-11, the base year for the model, 15.7 per cent of students gained 1sts.
- In 2011-12, the explained attainment from the model was 15.4 percentage points, with unexplained change of 1.9 percentage points.
- In 2012-13, the explained attainment from the model was 14.9 percentage points, with unexplained change of 4.2 percentage points.
- In 2013-14, the explained attainment from the model was 15.1 percentage points, with unexplained change of 5.9 percentage points.
- In 2014-15, the explained attainment from the model was 13.9 percentage points, with unexplained change of 9.5 percentage points.
- In 2015-16, the explained attainment from the model was 13.7 percentage points, with unexplained change of 11.0 percentage points.
- In 2016-17, the explained attainment from the model was 13.2 percentage points, with unexplained change of 14.0 percentage points.
- In 2017-18, the explained attainment from the model was 13.4 percentage points, with unexplained change of 15.9 percentage points.
- In 2018-19, the explained attainment from the model was 13.4 percentage points, with unexplained change of 16.1 percentage points.
- In 2019-20, the explained attainment from the model was 13.7 percentage points, with unexplained change of 22.4 percentage points.
- In 2020-21, the explained attainment from the model was 15.5 percentage points, with unexplained change of 22.4 percentage points.
The OfS has been clear that those universities that consistently recruit students from underrepresented groups, whose performance has historically been lower, should improve outcomes for these students rather than tolerating lower ones.36 It may therefore seem anomalous that our analysis applies a methodology that assumes such students’ performances remain constant, and treats improvement in their outcomes as ‘unexplained’. However, even an unprecedented improvement in such performance could only account for a fraction of the unexplained achievement.
A second set of predictions, based on the same statistical model, shows how we would expect the outcomes to look in 2020-21 if attainment gaps had completely closed between students of different sex, ethnicity and disability and area-based disadvantage.37 This shows that, even assuming all graduates attained at the highest levels predicted by the model, some 17.4 percentage points of the 37.9 per cent obtaining 1sts in 2020-21 represent unexplained change.38 While lower than 22.4 percentage points, this proportion is clearly high. Previous analysis confirms that this finding also holds for 2018-19 graduates.39
These results are in line with those of earlier OfS reports carrying out similar analysis, which also found unexplained changes for the years prior to 2020-21.40 The analysis concludes that over the period, nearly all the universities and colleges included had significant increases in both the absolute and the unexplained awarding of 1sts, based on a comparison with the higher education sector as a whole in 2010-11.41
This considerable divergence of the actual results from what would have been expected, even in a best-case scenario, requires explanation. To explain the change convincingly, there would have to be good reasons why all students, of all demographics, had undergone unprecedented improvements in their actual performance up to 2017-18, and again in 2019-20.
In the absence of specific accounts of how this can have happened, the understandable assumption of employers and the public will be that these increases are due to grade inflation in the current system. To maintain confidence in the current degree classification system, and the awards made to students, universities must convincingly demonstrate that students are assessed effectively, that assessment is valid and reliable, and that the qualifications awarded properly reflect students’ knowledge and skills.
Perceptions
As noted, the issue of grade inflation is significant for the reputation of English higher education, if members of the public do not perceive the increases seen since 2010-11 to be credible. And as recent media coverage (and the coverage of our past reports on degree classification) has shown, the opinions it evokes can diverge strongly. Some commentators believe that students’ status as consumers has caused universities to remove rigour from assessment and so driven up degree classifications, making it impossible to discriminate between excellent graduates and those who are merely adequate.42 Others have suggested that the OfS risks penalising institutions for genuine improvements in the quality of teaching.43
Some media reports of our recent analysis highlighted the striking fact that, while the rate of achievement of 1sts nearly doubled between 2010-11 and 2020-21 among students entering with grades AAA or above at A-level, for those who entered with grades DDD or below the rate more than quintupled.44 However, the latter group represents a very small proportion of the overall student population, between 1 and 2 per cent of the total number of qualifiers. Whether this change represents grade inflation, real improvement or a statistical fluke will bear investigation, but it has little impact on the overall number of 1sts, and thus on the question of their credibility.
Studies before the pandemic suggested that increases in higher classifications since the late 20th century were not confined to the UK, but were observable in, for instance, the USA, Canada and Germany. This was attributed to causes including the commodification of higher education, competition between universities and the linkage of academic tenure for staff to good outcomes. There was less evidence of it in Australia, where there was no common grading system and little public dissemination of grades.45
During the pandemic British schools also saw significant increases in grades, after procedures were changed so that GCSE and A-level outcomes relied on teacher assessments rather than externally validated exams. Ofqual has already announced plans to return GCSE and A-level grades to their proportions before the pandemic in 2023, with 2022 representing a transitional year.46 The public expectation that universities should do likewise is understandable, and Universities UK has rightly committed to achieving this.
Unwinding the impact of the changes made during the pandemic does not, however, explain or resolve the longer-term trend. The question of credibility therefore remains, entangled perhaps with more fundamental questions about whether the classification system is fit for purpose.
What the OfS is doing
The OfS’s view is that grade inflation is bad for students, graduates and employers, and damages the reputation of English higher education.47 This does not mean that we assume all unexplained improvements in degree classification are unmerited, and we understand that different factors were in play during the pandemic.
However, the most disruptive aspects of the pandemic will now no longer be placing pressure on university assessment practices. We therefore expect universities’ requirements for 1sts and 2:1s, and the proportions of students attaining these classifications, to revert to their pre-pandemic levels as Universities UK has agreed. At the same time, we are interested in establishing the causes of the steady growth in higher degree classifications over the years preceding the pandemic.
We will continue to use the data and other information available to us to identify courses and universities that may not be meeting our regulatory requirements relating to assessment and awarding practices. This will include considering how far these longer-term changes in degree classifications can be explained, statistically or otherwise, and thus whether the qualifications awarded to students are credible.48
We know that a range of factors might underlie such changes, some of which could be positive and would probably not affect compliance with our conditions. In line with our general regulatory approach, we will focus our investigation and enforcement activity on cases where substantial increases cannot be explained, either by our data analysis or by other evidence, or where the explanations raise concerns.49
Our risk-based approach means that we will not investigate every higher education provider where there may be a cause for concern. Instead we will investigate in a targeted way, based on the information available to us. We are willing to intervene to protect the credibility of awards, and would expect to report on the findings of our investigations.
Our expectation is that this approach will encourage all universities and colleges to ensure that their assessment and awarding practices remain rigorous and credible.
Conclusion
In 2019-20, English universities made significant changes to their assessment policies and practices, which coincided with a significant increase in the classifications awarded to students whose lives and circumstances had themselves changed radically. It is right that the sector now takes steps to reverse those pandemic-related increases. However, these changes followed a decade in which the proportions of 1sts awarded had grown considerably, and mostly steadily, and that too requires further exploration and explanation.
Public trust in the consistent value of degrees is essential to ensure that employers can continue to have confidence in the abilities of the graduates they employ. Large increases in higher classifications inevitably erode such confidence, unless they can be explained with evidence showing that they reflect genuine improvement in the achievement of graduates.
There is a clear need for this debate to be informed by further research and inquiry, whose outcomes must be disseminated in a manner accessible to the public at large. We intend, through our investigations, to increase the information available about these trends and the explanations for them, and through our regulation to work to correct them where this is appropriate. This approach is designed to stabilise the public perception of degrees, and to re-establish trust in the credibility of qualifications awarded to students, to the benefit of future graduates, employers and taxpayers alike.
- In this brief, for the sake of readability, we have used ‘universities and colleges’, or sometimes simply ‘universities’, to refer to what our regulatory framework and other more formal documents call ‘higher education providers’.
- OfS, ‘Analysis of degree classifications over time: Changes in graduate attainment from 2010-11 to 2020-21’, 12 May 2022 (OfS 2022.22, available at www.officeforstudents.org.uk/publications/analysis-of-degree-classifications-over-time-changes-in-graduate-attainment-from-2010-11-to-2020-21/).
- Shearing, Hazel, ‘First-class degrees more than double in a decade’, BBC, 12 May 2022 (https://www.bbc.co.uk/news/education-61422305).
- Degree awarding powers - Office for Students.
- Ofqual, ‘National Reference Test 2021: Contextual information’ (https://www.gov.uk/government/publications/the-national-reference-test-in-2021/national-reference-test-2021-contextual-information).
- UK Standing Committee for Quality Assessment (UKSCQA), ‘Degree classification: Transparent, consistent and fair academic standards’ (available at Degree classification: transparent, consistent and fair academic standards), pp9-10.
- OfS, ‘Office for Students strategy 2022 to 2025’, 23 March 2022 (OfS 2022.15, available at www.officeforstudents.org.uk/publications/office-for-students-strategy-2022-to-2025/).
- For the precise legal wording of Condition B, see the 1 May 2022 amendment to OfS, ‘Securing student success: Regulatory framework for higher education in England’ (OfS 2018.01, available at www.officeforstudents.org.uk/publications/securing-student-success-regulatory-framework-for-higher-education-in-england/).
- OfS, ‘OfS response to Reform grade inflation report’, 21 June 2018 (www.officeforstudents.org.uk/news-blog-and-events/press-and-media/ofs-response-to-reform-grade-inflation-report/).
- OfS, ‘Getting to grips with grade inflation’, 11 June 2019 (www.officeforstudents.org.uk/news-blog-and-events/blog/getting-to-grips-with-grade-inflation/).
- Universities UK, ‘How are universities protecting degree standards?’, 21 January 2022 (available at https://www.universitiesuk.ac.uk/what-we-do/policy-and-research/publications/how-are-universities-protecting-degree).
- Universities UK, ‘How are universities protecting degree standards?’, 21 January 2022 (available at https://www.universitiesuk.ac.uk/what-we-do/policy-and-research/publications/how-are-universities-protecting-degree).
- Universities UK, ‘After the pandemic: Our commitment to degree classifications’, 5 July 2022 (https://www.universitiesuk.ac.uk/what-we-do/policy-and-research/publications/after-pandemic-our-commitment-degree).
- UKSCQA, ‘Degree classification: Transparent, consistent and fair academic standards’ (available at Degree classification: transparent, consistent and fair academic standards), pp10, 22.
- ‘Table 14b, Qualifications obtained in England by mode of study, domicile, gender and subject area 1995-96’, under ‘Students in higher education’ at Higher Education Statistics Agency, ‘Publications archive’ (https://www.hesa.ac.uk/data-and-analysis/publications). In 1965-66, the figure was 7.1 per cent (University Grants Committee, Statistics of education: Universities, 1966, Volume 6, pp90-91). While broadly comparable, these sets of data do not draw on identical populations. The 1995-96 figure applies to UK-domiciled, full-time, first degree qualifiers in England, excluding those at further education colleges and ‘alternative providers’. The 1965-66 statistics cover all students receiving awards from English universities, but excludes awards made by the University of London to private students and students studying at non-university institutions.
- ‘Annex A: Data’, in OfS, ‘Analysis of degree classifications over time: Changes in graduate attainment from 2010-11 to 2020-21’, 12 May 2022 (OfS 2022.22, available at www.officeforstudents.org.uk/publications/analysis-of-degree-classifications-over-time-changes-in-graduate-attainment-from-2010-11-to-2020-21/).
- ‘Annex A: Data’, in OfS, ‘Analysis of degree classifications over time: Changes in graduate attainment from 2010-11 to 2020-21’, 12 May 2022 (OfS 2022.22, available at www.officeforstudents.org.uk/publications/analysis-of-degree-classifications-over-time-changes-in-graduate-attainment-from-2010-11-to-2020-21/).
- ‘Annex A: Data’, in OfS, ‘Analysis of degree classifications over time: Changes in graduate attainment from 2010-11 to 2020-21’, 12 May 2022 (OfS 2022.22, available at www.officeforstudents.org.uk/publications/analysis-of-degree-classifications-over-time-changes-in-graduate-attainment-from-2010-11-to-2020-21/).
- OfS, ‘Key performance measure 18: Students achieving 1sts’, 24 March 2022 (www.officeforstudents.org.uk/about/measures-of-our-success/outcomes-performance-measures/students-achieving-1sts/).
- OfS, ‘Key performance measure 18: Students achieving 1sts’, 24 March 2022 (www.officeforstudents.org.uk/about/measures-of-our-success/outcomes-performance-measures/students-achieving-1sts/).
- OfS, ‘Key performance measure 18: Students achieving 1sts’, 24 March 2022 (www.officeforstudents.org.uk/about/measures-of-our-success/outcomes-performance-measures/students-achieving-1sts/).
- See ‘Figure 16: Percentage of first degree qualifiers obtaining each classification – Academic years 2016-17 to 2020-21’ at HESA, ‘Higher Education Student Statistics: UK, 2020/21 - Qualifications achieved’, 25 January 2022 (https://www.hesa.ac.uk/news/25-01-2022/sb262-higher-education-student-statistics/qualifications).
- OfS, ‘Key performance measure 4: Gap in degree outcomes (1sts or 2:1s) between white students and black students’, 24 March 2022 (www.officeforstudents.org.uk/about/measures-of-our-success/participation-performance-measures/gap-in-degree-outcomes-1sts-or-21s-between-white-students-and-black-students/).
- OfS, ‘Key performance measure 5: Gap in degree outcomes (1sts or 2:1s) between disabled students and non-disabled students’, 24 March 2022 (www.officeforstudents.org.uk/about/measures-of-our-success/participation-performance-measures/gap-in-degree-outcomes-1sts-or-21s-between-disabled-students-and-non-disabled-students/).
- OfS, ‘Key performance measure 4: Gap in degree outcomes (1sts or 2:1s) between white students and black students’, 24 March 2022 (www.officeforstudents.org.uk/about/measures-of-our-success/participation-performance-measures/gap-in-degree-outcomes-1sts-or-21s-between-white-students-and-black-students/).
- OfS, ‘Key performance measure 4: Gap in degree outcomes (1sts or 2:1s) between white students and black students’, 24 March 2022 (www.officeforstudents.org.uk/about/measures-of-our-success/participation-performance-measures/gap-in-degree-outcomes-1sts-or-21s-between-white-students-and-black-students/).
- OfS, ‘Participation performance measures’, 24 March 2022 (www.officeforstudents.org.uk/about/measures-of-our-success/participation-performance-measures/).
- See OfS, ‘Access and participation data dashboard’ 24 March 2022 (www.officeforstudents.org.uk/data-and-analysis/access-and-participation-data-dashboard/). Mature learners are defined as those who are 21 or over on starting higher education.
- OfS, ‘Analysis of degree classifications over time: Changes in graduate attainment from 2010-11 to 2020-21’, 12 May 2022 (OfS 2022.22, available at www.officeforstudents.org.uk/publications/analysis-of-degree-classifications-over-time-changes-in-graduate-attainment-from-2010-11-to-2020-21/).
- OfS, ‘Analysis of degree classifications over time: Changes in graduate attainment from 2010-11 to 2020-21’, 12 May 2022 (OfS 2022.22, available at www.officeforstudents.org.uk/publications/analysis-of-degree-classifications-over-time-changes-in-graduate-attainment-from-2010-11-to-2020-21/). 143 registered higher education providers met the threshold for inclusion.
- Universities UK, ‘Degree classification in 2019-20’, 13 August 2021, available at https://www.universitiesuk.ac.uk/what-we-do/policy-and-research/publications/degree-classification-2019-20.
- See, for instance, University of Exeter, ‘Degree outcomes statement 2021’ (https://www.exeter.ac.uk/about/facts/degree-outcomes-statement/); Universities UK, ‘Degree classification in 2019-20’, 13 August 2021, available at https://www.universitiesuk.ac.uk/what-we-do/policy-and-research/publications/degree-classification-2019-20.
- OfS, ‘Analysis of degree classifications over time: Changes in graduate attainment from 2010-11 to 2020-21’, 12 May 2022 (OfS 2022.22, available at www.officeforstudents.org.uk/publications/analysis-of-degree-classifications-over-time-changes-in-graduate-attainment-from-2010-11-to-2020-21/).
- OfS, ‘Analysis of degree classifications over time: Changes in graduate attainment from 2010-11 to 2020-21’, 12 May 2022 (OfS 2022.22, available at www.officeforstudents.org.uk/publications/analysis-of-degree-classifications-over-time-changes-in-graduate-attainment-from-2010-11-to-2020-21/).
- OfS, ‘Analysis of degree classifications over time: Changes in graduate attainment from 2010-11 to 2020-21’, 12 May 2022 (OfS 2022.22, available at www.officeforstudents.org.uk/publications/analysis-of-degree-classifications-over-time-changes-in-graduate-attainment-from-2010-11-to-2020-21/). 143 registered higher education providers met the threshold for inclusion.
- E.g. OfS, ‘Office for Students strategy 2022 to 2025’, 23 March 2022 (OfS 2022.15, available at www.officeforstudents.org.uk/publications/office-for-students-strategy-2022-to-2025/); OfS, ‘Next steps in access and participation’, 8 February 2022 (www.officeforstudents.org.uk/news-blog-and-events/press-and-media/next-steps-in-access-and-participation/.).
- For area-based disadvantage see OfS, ‘About the TUNDRA area-based measures data’ (www.officeforstudents.org.uk/data-and-analysis/young-participation-by-area/about-tundra/).
- OfS, ‘Analysis of degree classifications over time: Changes in graduate attainment from 2010-11 to 2020-21’, 12 May 2022 OfS 2022.22, (available at www.officeforstudents.org.uk/publications/analysis-of-degree-classifications-over-time-changes-in-graduate-attainment-from-2010-11-to-2020-21/).
- OfS, ‘Analysis of degree classifications over time: Changes in graduate attainment from 2010-11 to 2018-19’ (OfS 2020.52, available at www.officeforstudents.org.uk/publications/analysis-of-degree-classifications-over-time-changes-in-graduate-attainment-from-2010-11-to-2018-19/).
- See OfS, ‘Analysis of degree classifications over time: Changes in graduate attainment’ (OfS 2018.54, available at www.officeforstudents.org.uk/publications/analysis-of-degree-classifications-over-time-changes-in-graduate-attainment/); OfS, ‘Analysis of degree classifications over time: Changes in graduate attainment from 2010-11 to 2017-18’ (OfS 2019.28, available at www.officeforstudents.org.uk/publications/analysis-of-degree-classifications-over-time/); OfS, ‘Analysis of degree classifications over time: Changes in graduate attainment from 2010-11 to 2018-19’ (OfS 2020.52, available at www.officeforstudents.org.uk/publications/analysis-of-degree-classifications-over-time-changes-in-graduate-attainment-from-2010-11-to-2018-19/).
- OfS, ‘Key performance measure 18: Students achieving 1sts’, 24 March 2022 (www.officeforstudents.org.uk/about/measures-of-our-success/outcomes-performance-measures/students-achieving-1sts/).
- E.g. Brown, Roger, ‘Times letters: University grades show a degree of inflation’ The Times, 16 May (https://www.thetimes.co.uk/article/times-letters-university-grades-show-a-degree-of-inflation-7z5m0w2xh; Reid, Ivan W, ‘Readers’ letters: University degrees seem to be turning into first class nonsense’, The Press and Journal, 17 May 2022 (https://www.pressandjournal.co.uk/fp/opinion/letters/4301117/university-degrees-seem-to-be-turning-into-first-class-nonsense/).
- E.g. WonkHE, ‘OfS goes on the attack over “unmerited” grades’, 13 May 2022 (https://wonkhe.com/blogs/degree-classifications/); Swain, Harriet, ‘Working the numbers’, Research Professional, 13 May 2022 (https://www.researchprofessional.com/0/rr/he/government/playbook/2022/5/Working-the-numbers.html).
- E.g. McTaggart, India, ‘First-class degrees double in a decade as warnings mount over Covid grade inflation’, The Telegraph, 12 May 2022 (https://www.telegraph.co.uk/news/2022/05/12/covid-cannot-excuse-grade-inflation-watchdog-says-first-class/); Woolcock, Nicola, ‘“No explanation” for most first-class degrees as grades soar’, The Times, 12 May 2022 (https://www.thetimes.co.uk/article/first-class-degree-inflation-questioned-by-watchdog-mfxxsz889).
- Baker, Simon, ‘Is grade inflation a worldwide trend?’, Times Higher Education, 28 June 2018 (https://www.timeshighereducation.com/features/grade-inflation-worldwide-trend); UKSCQA, ‘Degree classification: Transparent, consistent and fair academic standards’ (available at Degree classification: transparent, consistent and fair academic standards), p8.
- Ofqual, ‘Student guide to exams and formal assessments in 2021 to 2022’, 8 March 2022 (https://www.gov.uk/government/publications/student-guide-to-exams-and-formal-assessments-in-2021-to-2022/student-guide-to-exams-and-formal-assessments-in-2021-to-2022).
- OfS, ‘Universities must not allow a “decade of grade inflation to be baked into the system”’, 12 May 2022 (www.officeforstudents.org.uk/news-blog-and-events/press-and-media/universities-must-not-allow-a-decade-of-grade-inflation-to-be-baked-into-the-system/).
- OfS, ‘Office for Students strategy 2022 to 2025’, 23 March 2022 (OfS 2022.15, available at www.officeforstudents.org.uk/publications/office-for-students-strategy-2022-to-2025/).
- OfS, ‘Office for Students strategy 2022 to 2025’, 23 March 2022 (OfS 2022.15, available at www.officeforstudents.org.uk/publications/office-for-students-strategy-2022-to-2025/).
Describe your experience of using this website