Financial support evaluation toolkit
Statistical tool
This is a guide to help higher education providers to use our statistical tool for financial support evaluation.
What is the statistical tool?
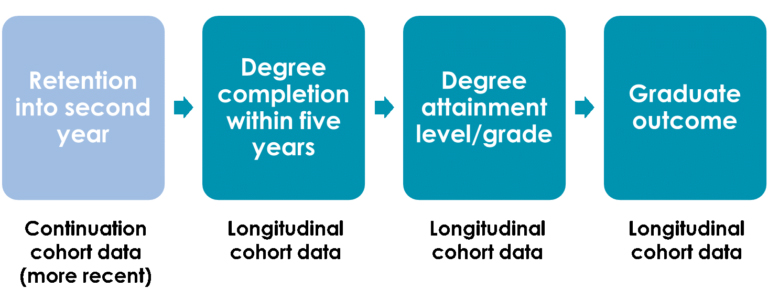
The statistical tool is a framework that uses binary logistic regression analysis to help you evaluate the relationship between financial support and four specific academic student outcomes:
-
retention into second year (continuation)
-
degree completion within five years
-
degree attainment level or grade
-
graduate outcome.
The statistical tool uses information on other variables (for example, gender, age entry qualifications) that may affect student outcomes to analyse the impact of financial support.
Using this tool involves preparing a dataset for your institution that includes pre-defined and coded variables, and then running the statistical analysis using the software package IBM SPSS Statistics (SPSS). It is possible to use other statistics packages, but the advice provided here is based on using SPSS.
The statistical analysis alone will not provide enough information to evaluate your financial support package, as it only tells you whether financial support appears to be effective in equalising outcomes.
You should interpret this data alongside findings from the survey and interview tools which will explore student experiences of how and why financial support affects academic, personal and social outcomes.
The development and piloting of the statistical tool was led by the University of the West of England, to improve the tool’s validity, as part of a research project led by Sheffield Hallam UniversityExternal link (Opens in a new tab or window).
When is the right time to do the statistical analysis?
It is up to you when you choose to do the statistical analysis. Factors you might want to consider:
- The Higher Education Statistics Agency (HESA) data is released around March/April.
- The analysis does not require any student contact.
- Timely evaluation is particularly important where the nature of your financial support changes, or if the environment changes significantly.
- If you have sufficient data, we recommend these evaluations are run annually, timed to feed into your strategic planning cycle for widening participation.
Getting started
What you will need:
- Knowledge of your financial support package details, number of recipients, and any historical changes made to the package during the relevant time period.
- HESA subscription to download the HESA data release (or resources to develop your own internal dataset).
- Access to your student records data.
- Access to your Higher Education Bursaries and Scholarship Scheme (HEBSS) data or other internal data recording financial support given to recipients.
- Access to your institution’s National Student Survey (NSS)External link (Opens in a new tab or window)
- Basic-to-intermediate expertise in data manipulation and statistical analysis. You do not need to be an experienced statistician or data analyst to use this statistical tool, however these roles are likely to have the appropriate expertise to complete the analysis easily and efficiently.
- Access to SPSS (other statistical analysis software packages can be used to run the analysis but are not covered by the technical workbook).
Additionally, you may also benefit from:
- Advanced data manipulation and statistical analysis skills (particularly for running analysis and interpreting results)
- Survey and interview data to help make sense of the findings.
How long will it take?
In the pilot of this tool, institutions found that the first time the analysis was completed, it took around one week. This involved up to two days to combine the HESA data with the other required data, and cleanse the data.
Up to two days were then spent coding the data variables.
Once the data was prepared, running the actual analysis in SPSS (or other package) was a short task of around one hour for an experienced SPSS user (though re-coding may be desired depending on results).
Further analyses took less time when repeating these processes.
You will also need to allow time with different stakeholders to interpret your findings, then decide if and how to make changes in response to what you have learned.
Preparing your dataset
A HESA data release provides subscribing institutions with most of the variables required for a statistical analysis to evaluate the impact of financial support.
On receipt of the HESA data release, you will need to include some additional data (financial support recipient data including household income data – likely to be via HEBSS, student record data, and NSS data), before then using the new dataset within the statistical data model.
Full details on preparing and coding your datasets for the analysis are available in the Technical coding workbook.
Conducting the statistical analysis
Full details on running the binary logistic regression analysis in SPSS are available in the Technical coding workbook.
Interpreting your results – what does it mean?
There are three possible results you can obtain for each outcome from your analysis:
| Result | What this means |
|---|---|
| Result 1: Financial support recipients have significantly better outcomes than the comparison group. | This indicates that financial support is effective at improving outcomes (and possibly unfairly so with respect to the comparison group). |
| Result 2: Financial support recipients have the same outcomes as the comparison group (i.e. no significant differences). | This indicates that financial support is effective (or there is actually no impact of financial disadvantage on educational outcomes). |
| Result 3: Financial support recipients have significantly worse outcomes than the comparison group. | This indicates that financial support is either ineffective or insufficient to overcome the underlying effects of financial disadvantage. |
In the absence of a true control group, establishing causality between bursaries and different outcomes is impossible. The results of the statistical analysis are inevitably tentative due to the complexities of students’ lives.
It is advised that institutions use multiple years’ data to guide decisions around changes to financial support, and continue to evaluate to understand the effects of any changes.
To support a nuanced and critical analysis, you should interpret these findings alongside your survey and interview evaluation research and consider in relation to the context and aims of your institution.
Find out more about how you might interpret your findings and plan your next steps
Describe your experience of using this website