Content warning
This case study discusses issues relating to suicide and mental health. It does not constitute regulatory guidance. If you are affected by any of the issues raised, there is a list of services that can help on the topic briefing.
Suicide prevention and data analytics
Using data analytics to develop an early intervention approach to students who may be at risk.

Data published by the Office for National Statistics in 2018, estimates 4.7 deaths by suicide per 100,000 students each academic year, but attempted suicide, planned suicide, and suicidal thoughts are more prevalent, with estimated rates of 3.2 per cent, 6.1 per cent, and 22.3 per cent respectively (Mortier et al, 2018). Anti-stigma campaigns will empower some students to self-refer to wellbeing and support services. However, not all students will self-refer (Universities UK, 2018), so there is an imperative to develop preventative strategies and personalised interventions that provide support to students at risk of suicidal thoughts and behaviour (STB) before they reach crisis point.
The challenge
Only one in three people who die by suicide are known to mental health services (Universities UK, 2018). Universities, therefore, need to draw evidence from non-self-referral data to identify students potentially at risk. This raises questions regarding the type and nature of the data to be used, and how.
Does access to the data help enable services to provide support? Is the data most indicative of risk collected? Is the quality of the data reliable? Is the data up-to-date? To look at this complex area in more depth, the Office for Students' Mental Health Challenge Competition is funding a collaborative project led by Northumbria University working with higher education providers, charities, technology partners and students’ unions.
The aim of the project is to develop and enable mental health analytics (MHA) to evidence student mental health needs and offer early intervention through ‘nudges’ which are targeted, carefully crafted email communications (approximately 150 words) to students which signpost appropriate support. For example, students at more severe risk may be unaware of out-of-hours NHS-based support; those with less severe risk may not be aware of guided self-help options.
Project objectives are to:
- Determine the appropriate data sources associated with mental health and wellbeing.
- Collect self-reported data on mental wellbeing from students.
- Incorporate relevant data on risk factors and self-reported wellbeing into an analytics system designed to identify risk patterns across student cohorts.
- Deliver crafted nudges to students at possible risk of mental health difficulties, supporting self-reflection, and signposting to appropriate support interventions.
- Evaluate whether nudging students identified as at risk leads to increased self-referrals to support services.
The approach
Educational analytics enables universities to use data to identify students that share commonalities in data trends to students that have previously discontinued from studying (Foster and Francis 2019) to improve student continuation rates.
It is underpinned by a “data stack” populated by ‘pulling’ operationalised data from university systems, putting it through analytic models, and feeding it into dashboards used by professional support staff. By identifying students with greater likelihood of discontinuing, universities can signpost students towards sources of support through tailored ‘nudging’ emails.
In this project, educational analytics have been adapted to identify students who may be experiencing mental health difficulties by:
- Adding new or amended data sources to the data stack that are known to be risk factors for STB (e.g. finance and accommodation data).
- Changing the prediction from whether a student will continue in their academic studies to risk to mental wellbeing.
Suicide cannot be accurately predicted. Circumstances are too varied, unique and – thankfully – relatively rare. However, preventive action can be supported by gathering, collating, and analysing data that may be indicative of risk, to identify students who may benefit from university services reaching out.
To ensure that the additional data sources chosen are evidence based, a series of research activities have underpinned model development:
- A systematic evidence assessment to identify from existing research literature what data is shown to have a robust association with STB
- Auditing referrals to support services to explore commonalities in characteristics of students presenting as high risk
- Interviewing practitioners to determine what data they find useful when providing support.
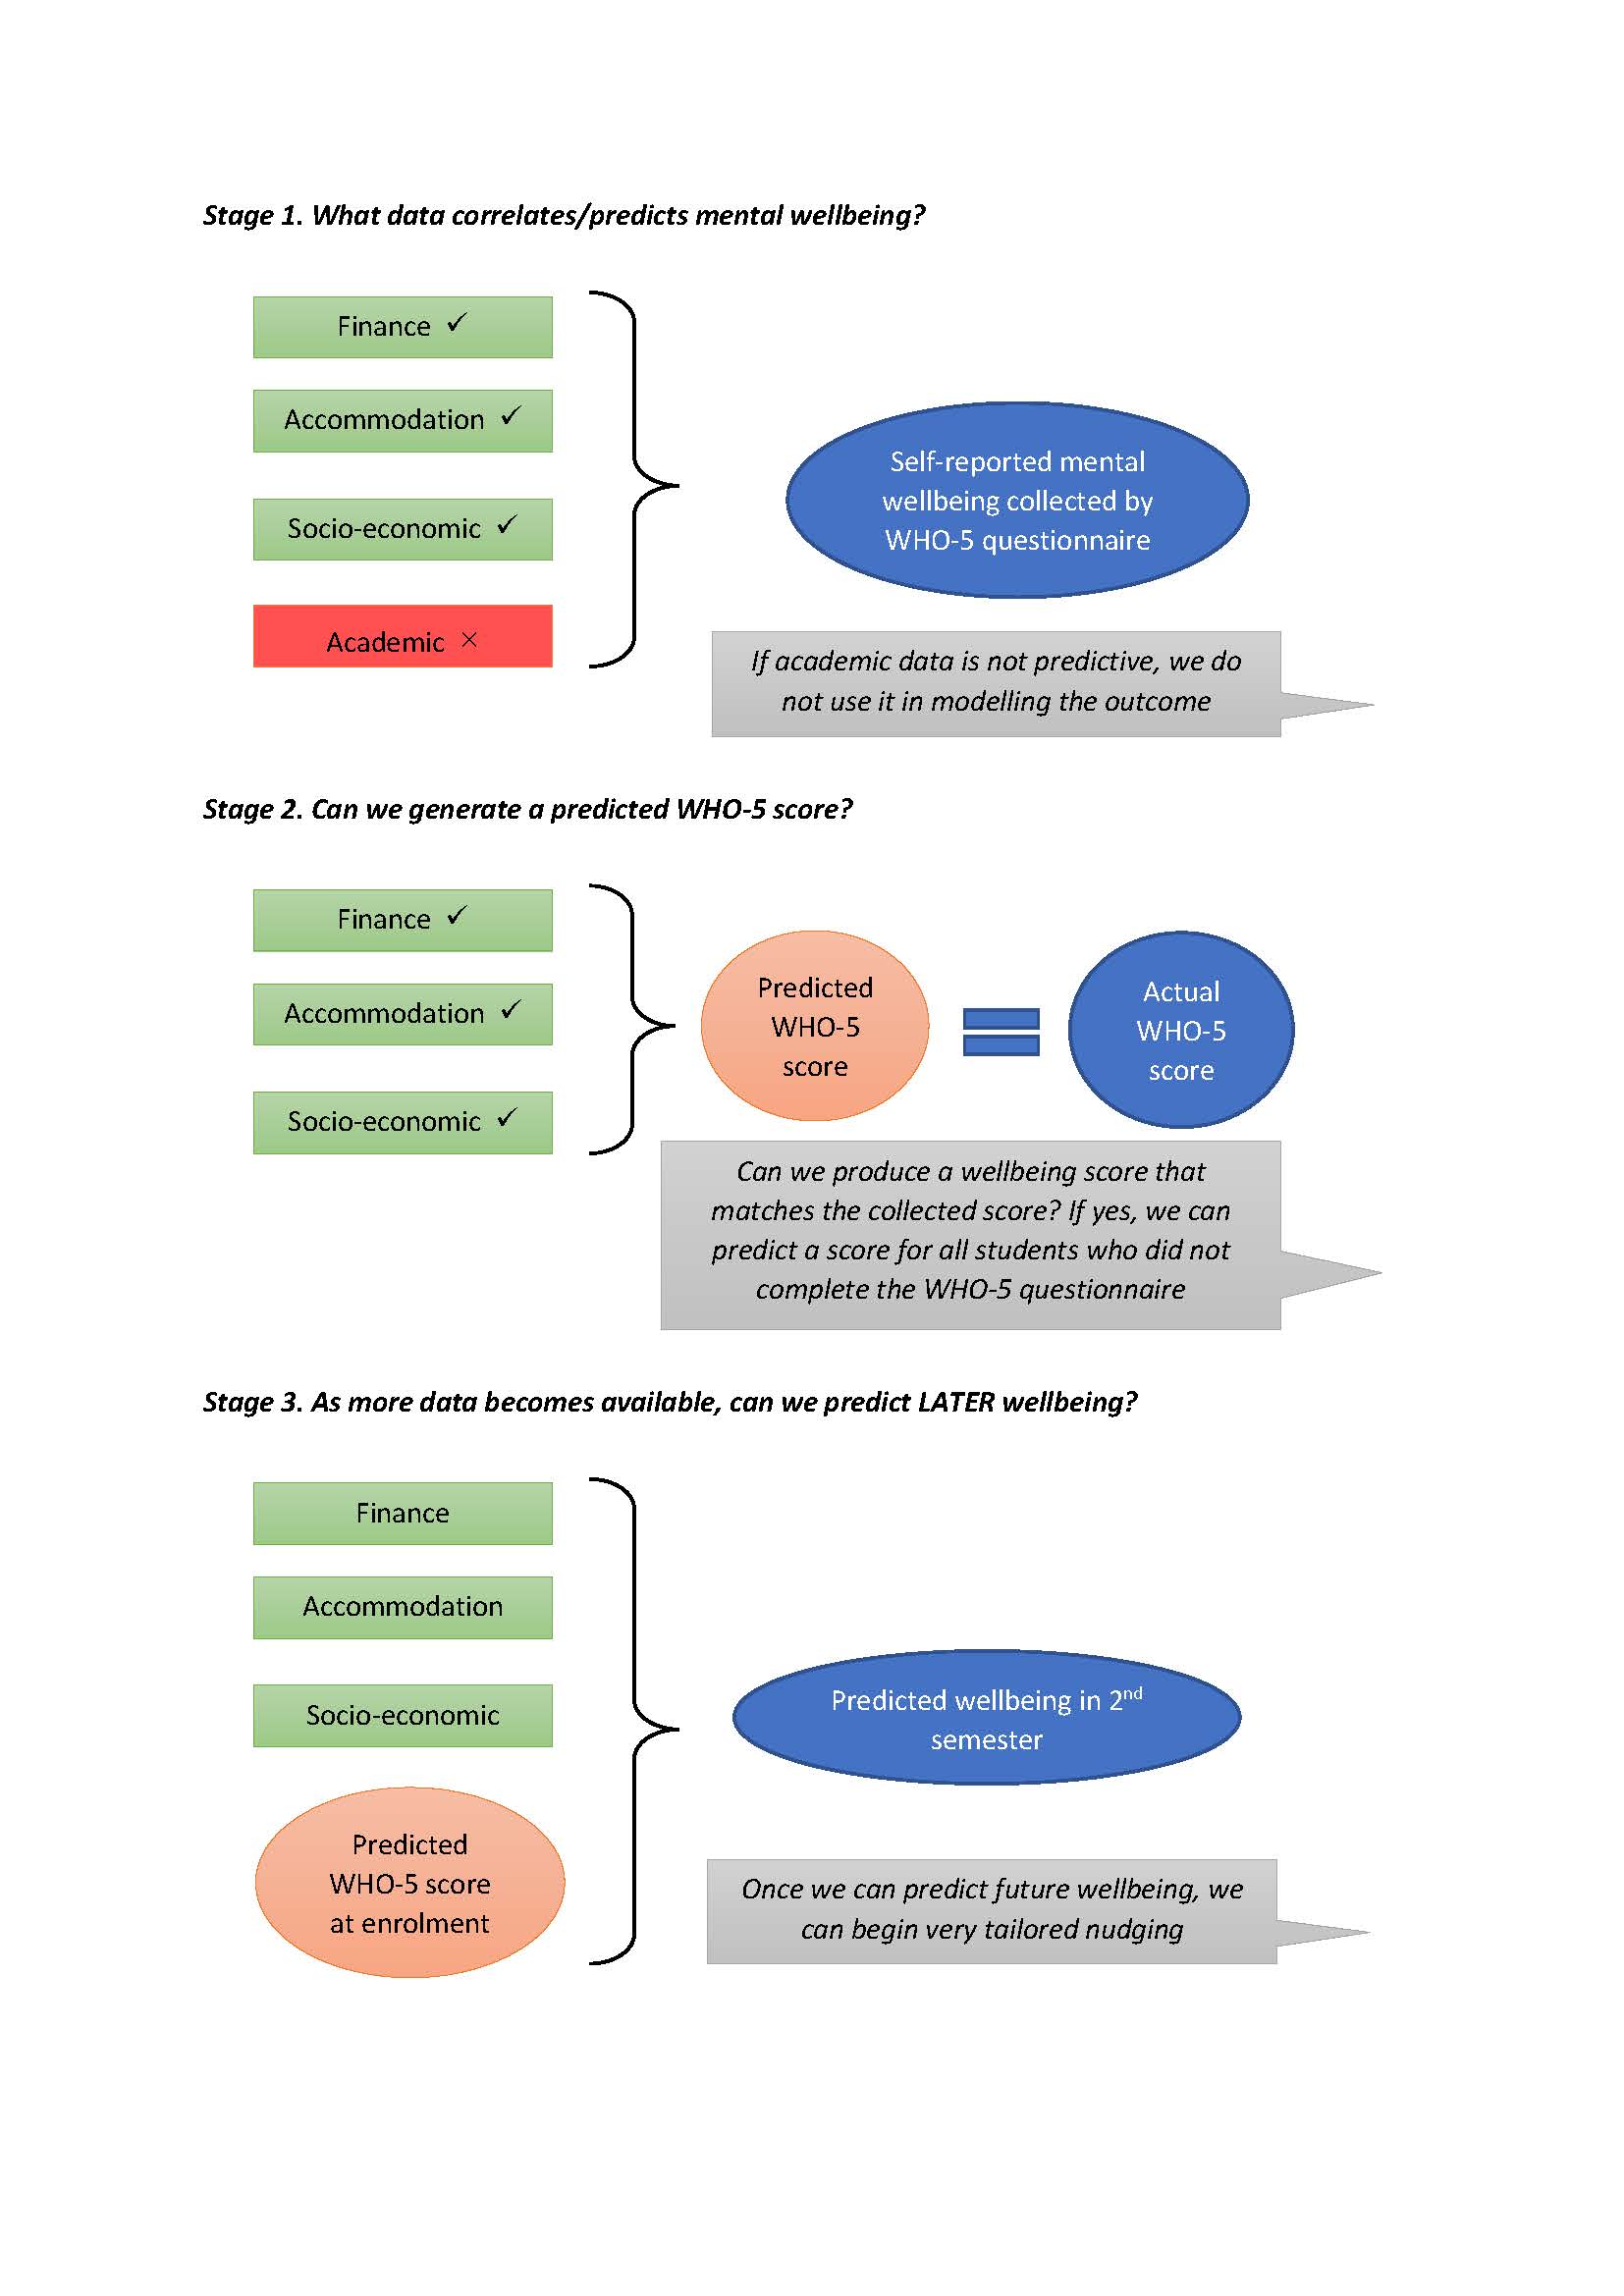
The accompanying project case study, ‘Mental health analytics: An innovative approach to understanding students’ wellbeing’ describes how the project obtained self-reported wellbeing data from students using the WHO-5 questionnaire. The WHO-5 has been shown to validly distinguish between people with and without STB and/or depression (Topp et al, 2015). The WHO-5 data can be used to:
- provide an immediate response and generate nudges for students who may need support. For example, for students with low scores on the WHO-5, nudges can highlight the benefits of practitioner and online support. Non-responders will receive a generic nudge signposting them to the overall service support available if they feel in need of support.
- test whether the data within the stack is predictive of mental wellbeing by modelling the risk factors students have self-reported onto the data for those who have not completed the questionnaire. This enables us to test build a prediction score for all students who consented to the mental health analytics initiative, irrespective of whether they completed the WHO-5 (see Figure 1).
The result
At Northumbria University, the number of self-referrals to support services decreased by 21 per cent between 2019 and 2020. This reduction is most likely to be COVID-19 related – given both the difficulties of students not being on campus who would otherwise be encouraged to access services, and by students perhaps not feeling their mental health difficulties were valid during the pandemic. Since nudging students on WHO-5 score alone has commenced in 2021, the rate of self-referrals has shown an 11 per cent and 27 per cent increase compared with 2019 and 2020 respectively.
Of all self-referrals in the month following nudging, 38 per cent came from ‘nudged’ students and of these, only 17 per cent were known to services. Importantly, 12 per cent of the referrals from ‘nudged’ students reported STB on their self-referral registration compared with 5 per cent in other referrals for the same period. The proportion in ‘nudged students’ reporting STB is also markedly different from the rate of 6 per cent observed at Northumbria pre-nudging. This highlights that students who contacted services after being nudged were more likely to be experiencing distress than standard referrals.
Through the project, nudging based on self-reported wellbeing data has been beneficial for identifying students in significant distress previously unknown to services and encouraging them to access support. Furthermore, nudging can guide students towards appropriate level of interventions.
Next steps
The next steps comprise assessment of whether the additional data in the data stack in combination with the self-reported wellbeing scores can produce an accurate predicted wellbeing score for all students, and which the project can use accurately for ‘nudging’. And to assess the impact of ‘nudging’, and the appropriateness of the service offer against student demand.
The research activities to date have identified additional data sources that can be meaningfully used in the data stack to improve this segmentation (e.g. finance, accommodation data), and which are now being tested against the self-reported wellbeing data we have from the WHO-5 questionnaire. The process has also identified that it is not just about the data itself per se, but about the specificity of data collected. For example, sleep patterns have been shown to be an important indicator, so time-stamped virtual learning environment (VLE) data is being used to identify abnormal night-time use of online resources in the analytics system.
It is acknowledged that student needs are triggered by other elements of student life. With this in mind, and in support of a whole university approach, students with low predicted or actual wellbeing that also have debt issues, for example, will receive tailored messages about where to access financial support that also acknowledge the anxiety that debt can cause. Students with predicted low wellbeing that are shown to be accessing library services at erratic night hours will be messaged about 24-hour support lines and sent guidance about sleep management. In both these examples, students receive appropriate and personalised service support that may address their immediate concerns.
The project is fully aware of balancing demand, and need, and the right service offer. This early data on responses to the nudges gives us useful information for service planning by identifying the likely proportion and severity of responders. As the project is rolled out to larger numbers of students, it will combine WHO-5 scores with other data sources to segment the student population more granularly. This will allow the project team to determine the appropriate ‘nudge’ information to relay to students, and its impact; assess the numbers of students taking up the offer of engagement with services, and the nature of their experiences; evaluate the range of appropriate services, and the nature of personalised support at scale; and to inform another strand of the project – based on creating thriving student cultures through data and its analysis – to engage students as resilient and self-reflective.
It is recognised that not all students in distress will present themselves to services following ‘nudges’ and so, in parallel, the project is developing a ‘monitoring dashboard’ to be used by support services to identify students potentially at risk and to facilitate proactive outreach.
This dashboard will have the same data on risk factors used for ‘nudging’ but in addition will have contextual data that is not suitable for predictive modelling, such as if they are a carer or they have personal extenuating circumstances requests indicating a bereavement. Given the number of ‘red flags’, this will allow a practitioner to contact the student personally to check in and see how they are doing. Part of the testing of this dashboard will be understanding what data is most indicative of risk, how frequently the data feeding into this dashboard would need to be refreshed, and how much staff involvement is required.
Figure 1
Authors
Dr James Newham, Senior Research Fellow, Northumbria University
Professor Peter Francis, Deputy Vice Chancellor, Birmingham City University
Describe your experience of using this website