The National Student Survey: Consistency, controversy and change
For the last 15 years, the National Student Survey has tracked students’ views of their courses and their university or college. This Insight brief explores the themes of consistency, controversy and change that have characterised the survey. Drawing on new analysis, it examines what the survey tells us about the experiences of part-time students, disabled students, and students from minority ethnic backgrounds. Finally, it considers how the NSS can maintain its relevance for the next decade.
- Date:
- 19 February 2020
Read the brief
Download the Insight brief as a PDF
Read the Insight brief online
2019 marked the 15th year of the National Student Survey (NSS). This UK-wide census canvasses the opinions of final year students. Over 4 million people have filled it in; in 2019, it had a response rate of 72 per cent. It is a valuable source of information for prospective students, and has helped put teaching and student experience at the heart of higher education.
The NSS asks for students’ views on their course and wider learning experience. The results are published on the Discover Uni website, and used in the compilation of university league tables. They feed into the Teaching Excellence and Student Outcomes Framework (TEF), helping to determine whether universities or colleges are awarded a Gold, Silver or Bronze award. Individual universities and colleges listen to and act on the feedback their students provide through the survey. It is used by the Office for Students (OfS) to help us understand what is important to students, with the aim of helping to ensure they receive a high-quality education.
The survey’s results are remarkably consistent. Since 2008, the overall satisfaction score has never fallen below 80 per cent. The response rate has remained at 60 per cent or above.
But the NSS has also been a source of controversy. Students have boycotted it, academics have called for it to be ended, and politicians have sought to reform it.1 By pulling apart these two threads of consistency and controversy we can better see where the survey has succeeded, and where there may be room for improvement.
This Insight brief considers what the NSS does well, and where it could do better. It looks at how the survey has changed higher education, and its role in shining a spotlight on students’ needs and driving improvements in learning and teaching. Drawing on new analysis, it shows variations in the responses of different groups of students by mode of study, ethnicity and disability. Finally, it looks at proposals for a more inclusive survey, encompassing all years of study, to help ensure the continued relevance of the NSS.
Background
In 2003, following recommendations from a committee chaired by Ron Cooke, a government white paper proposed an annual national student survey, arguing that such a survey was necessary if students were to ‘become intelligent customers of an increasingly diverse provision, and to meet their own increasing diverse needs’.2 The report highlighted the need for ensuring high-quality teaching and proposed the survey as one way to help ensure this.
The National Student Survey has run annually since 2005. The survey is open to most final year undergraduate students from January to April.3 The results are published in July, when individual higher education providers are also able to access a more detailed breakdown of their results.
The questions, drawing on the Australian student survey as a model, were developed with input from students’ unions, the National Union of Students (NUS), university staff, other sector stakeholders such as Universities UK and GuildHE, and the government. The current survey asks 27 questions on a variety of aspects of the student experience, from teaching and feedback to information technology and library resources. These questions are grouped into eight broad areas (called ‘scales’ in this analysis) covering themes such as course teaching, assessment and feedback, and the student voice.
Figure 1: Students responding positively to the NSS question on overall satisfaction, 2008 to 20194
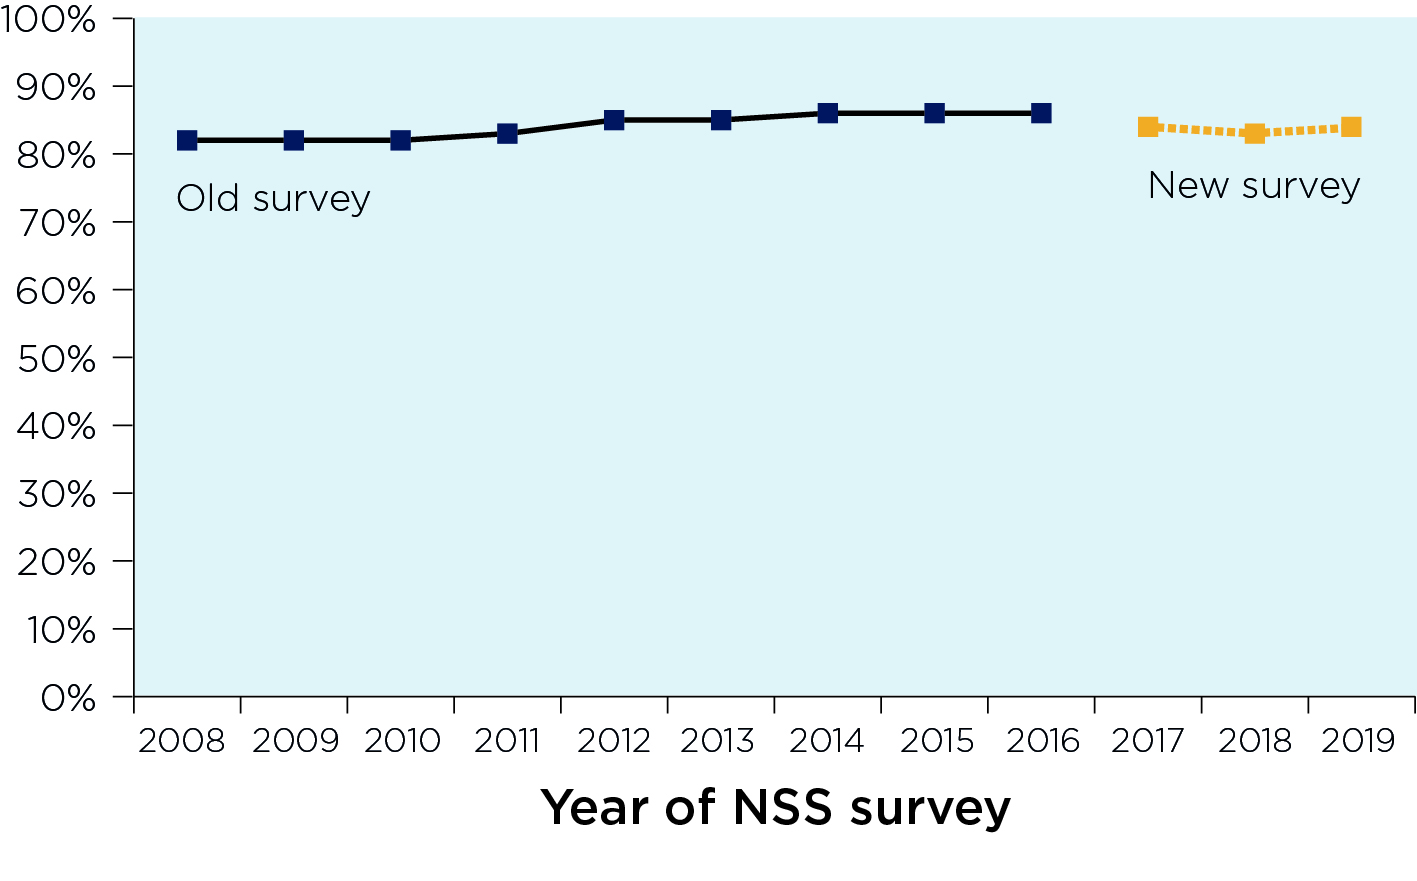
Note: This graph excludes the 2005-2007 NSS results as the population surveyed was not consistent with subsequent years. While the population has changed since 2008, this has not been as significant as the first three years.
Figure 1 is a double line graph which shows the percentage of students responding positively to the NSS question on overall satisfaction, 2008 to 2019. It shows that, for the old survey, overall satisfaction rose from 82 per cent in 2008 to 86 per cent in 2016. For the new survey, overall satisfaction remained largely steady at 84 per cent for both 2017 and 2019.
The graph shows:
- Old survey 2008: Overall satisfaction was 82 per cent.
- Old survey 2009: Overall satisfaction was 82 per cent.
- Old survey 2010: Overall satisfaction was 82 per cent.
- Old survey 2011: Overall satisfaction was 83 per cent.
- Old survey 2012: Overall satisfaction was 85 per cent.
- Old survey 2013: Overall satisfaction was 85 per cent.
- Old survey 2014: Overall satisfaction was 86 per cent.
- Old survey 2015: Overall satisfaction was 86 per cent.
- Old survey 2016: Overall satisfaction was 86 per cent.
- New survey 2017: Overall satisfaction was 84 per cent.
- New survey 2018: Overall satisfaction was 83 per cent.
- New survey 2019: Overall satisfaction was 84 per cent.
There have been two distinct iterations of the survey. For just over a decade after its introduction, the survey remained broadly unchanged. However, there was general consensus that the NSS needed to evolve if it was to continue to meet the needs of current and future students, and a new version of the survey was introduced in 2017 following a pilot with students and a consultation with the higher education sector. As a result, some of the mandatory questions were moved to an ‘optional bank’ (responses to which are not published, but are for use by individual providers) to make space for a group of questions designed to elicit responses regarding the ‘student voice’ and how far students feel they are listened to and part of a learning community.5
Because the order and content of the questions have changed, responses are no longer directly comparable between the old (pre-2017) and the new survey. The only exception is the overall satisfaction question, although even here the distinction should be made clear.
The NSS: a rough guide
Since 2005 the NSS has been coordinated on behalf of the UK funding and regulatory bodies: the OfS (and its predecessor, the Higher Education Funding Council for England), the Department for the Economy (Northern Ireland), the Scottish Funding Council and the Higher Education Funding Council for Wales.
The current survey consists of 27 questions grouped into eight broad areas covering aspects of teaching and learning. Two boxes allow students to make open-ended comments on positive and negative aspects of their higher education experience. These are anonymised and given to providers to help them identify where their strengths lie and where they can improve students’ experience.
A number of optional questions, for the information of individual universities and colleges only, follow the main questionnaire. There are also six questions for nursing, midwifery and allied health placement students. Similarly, all students in the final year of a degree apprenticeship programme are asked questions about the workplace element of their training.
The survey uses a Likert scale designed to measure collective student responses to a concept – for example, in the sample question in Figure 2, the concept of ‘learning community’. As concepts are multifaceted, multiple questions are asked to measure each concept. Students respond to each question by choosing from five points on the scale, ranging from ‘Definitely agree’ to ‘Definitely disagree’, or by choosing ‘Not applicable’.
The survey can be completed online or over the phone. Before 2015, students were often sent a paper copy, but this practice has been almost entirely discontinued. Now only the small number of people in prison studying for a higher education qualification are sent printed copies.
Promotional activity to encourage students to complete the survey is managed by universities and colleges. There are guidelines to ensure fairness, and official branding to ensure consistency and build trust and awareness. This ensures that accusations of gaming the survey can be reported and investigated.
The NSS is administered by a survey company (currently Ipsos MORI). Eligible students are contacted directly by the company and their provider, initially by email. Follow-up email and text reminders are sent as needed. Students who have still not completed the survey a month or so after the first contact are contacted by phone. This ensures a high response rate.
The survey company sends the raw data to the OfS. The OfS analyses the data and combines it with individual students’ data collected by the Higher Education Statistics Agency and the Education and Skills Funding Agency. This data, and the open text comments from the survey, are disseminated to participating universities and colleges by a data management company (currently Texuna).
Figure 2: Example NSS question
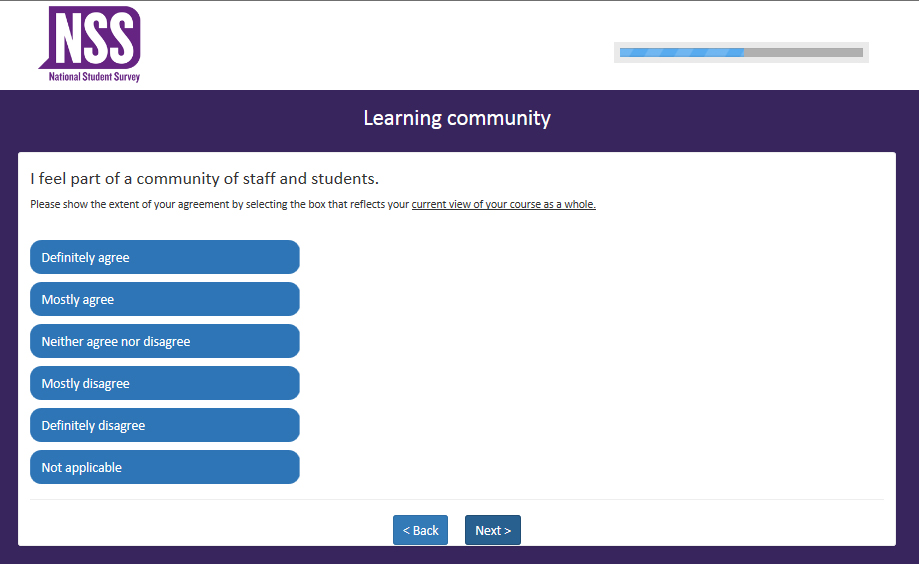
Figure 2 is a screenshot of a sample question from the NSS. It is from the scale on ‘Learning community’. It asks the respondent to rate how far ‘I feel part of a community of staff on students’. It includes the guidance ‘Please show the extent of your agree by selecting the box that reflects your current view of your course as a whole.’ The rating scale, from top to bottom, is ‘Definitely agree’, ‘Mostly agree’, ‘Neither agree nor disagree’, ‘Mostly disagree’, ‘Definitely disagree’, and ‘Not applicable’.
Consistency and continuity
Overall course satisfaction has remained high (see Figure 1), rising from 82 per cent in 2008 to 86 per cent in 2016. In recent years, whether as a real effect or because of the changes to the questions or their order in the new survey, overall satisfaction has fallen slightly, to 84 per cent in 2017. Satisfaction varies only marginally between the four nations: in 2019, England reported overall satisfaction at 83 per cent, Scotland at 84 per cent, and Wales and Northern Ireland both at 85 per cent.6
This consistency is all the more remarkable considering how the higher education landscape has changed in the last 15 years. In England, this includes increases in university tuition fees from £3,290 in 2011 to £9,000 in 2012. This period has also seen the introduction of major research and teaching assessment exercises: the Research Excellence Framework (in 2014) and the TEF (in 2017).
However, the survey also shows considerable variation between individual universities and colleges. As Figure 3 shows, while most providers have an overall satisfaction of more than 81 per cent, over a hundred providers have overall satisfaction of 80 per cent and under. There is a 13 percentage point difference between the providers in the bottom 10 per cent and those in the top 90 per cent.7 This highlights wide variations, with a number of providers producing extremely satisfied students and others falling short.
Figure 3: Percentage of students who agree ‘Overall, I am satisfied with the quality of the course’, by teaching provider, 20198
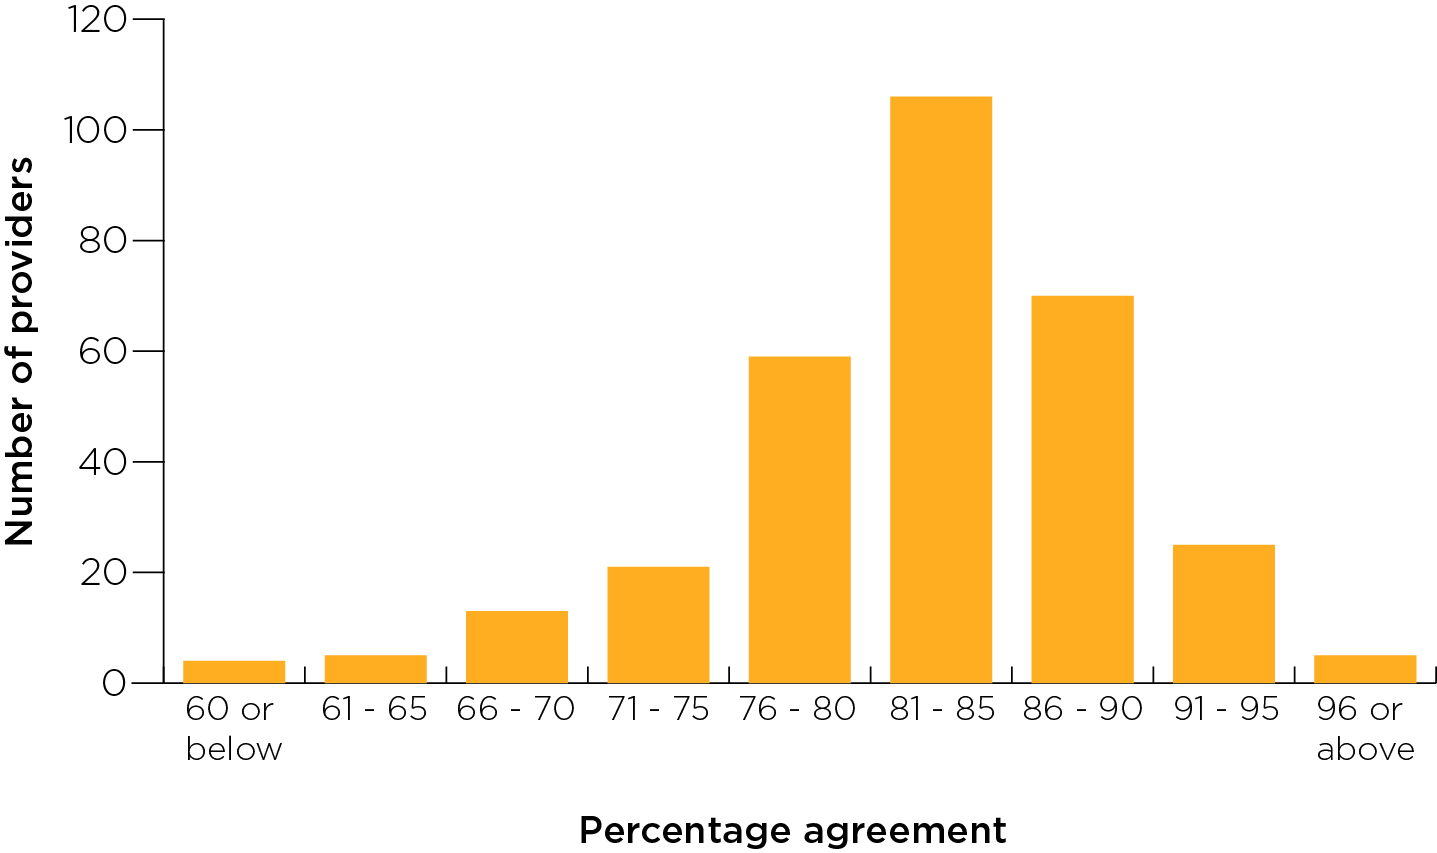
Note: From NSS 2019. Providers with fewer than 50 responses excluded.
Figure 3 is a single bar graph which shows the percentage of students who agree ‘Overall, I am satisfied with the quality of the course’ by provider, 2019.
The graph shows:
- 4 providers had overall satisfaction of 60 per cent or below
- 5 providers had overall satisfaction of 61 to 65 per cent
- 13 providers had overall satisfaction of 66 to 70 per cent
- 21 providers had overall satisfaction of 71 to 75 per cent
- 59 providers had overall satisfaction of 76 to 80 per cent
- 106 providers had overall satisfaction of 81 to 85 per cent
- 70 providers had overall satisfaction of 86 to 90 per cent
- 25 providers had overall satisfaction of 91 to 95 per cent
- 5 providers had overall satisfaction of 96 or above.
NSS data has been used extensively, and for a variety of purposes. Most importantly, it is intended to help inform prospective students’ choice of what and where to study. The data is published on a number of websites including the official information site (formerly Unistats and now Discover Uni), alongside other useful information such as entry qualifications, continuation rates and expected future earnings, allowing the user to compare university courses. Multiple league table compilers use it to rank universities.
For providers, it has helped universities and colleges enhance the courses they offer to students. Even when the problems identified can be fixed quickly, the students who used the survey to highlight these problems are extremely unlikely to still be studying at the university or college. Rather, their comments help those students who follow. In this way, individual students’ views and concerns gain weight and effect change by being part of a national survey.
The story of the NSS is simultaneously one of continuity – consistently high responses and robust results year-on-year – and change, in terms of how the survey has adapted to developments in higher education policy, the sector and technology. The high overall satisfaction rating reflects a broader consensus that, in many respects, UK higher education is world-leading. Simultaneously, the willingness of the sector to make changes in response to NSS results shows that this success has not bred complacency.
Student voice: impact and value
Much of the change and innovation the NSS has brought has been at a provider level. Most notable of all is the use individual universities and colleges make of their results to enhance their courses. Libraries are one part of the higher education landscape which has been changed by the NSS. As a result of student feedback, providers have extended library opening times, bought more ebooks, and created more spaces for group work.9 Taking the 2019 survey results by subject shows that, although there remains considerable variability by subject and provider, most students agree that the library resources have supported their learning.10
The survey has arguably had the greatest impact on assessment and feedback. This part of the survey asks questions about whether marking and assessment have been fair, and whether respondents have received helpful comments on their work. The responses of universities and colleges to low NSS results in these areas are widely recognised as driving improvement.11 The agreement with the scale on assessment and feedback has risen from 64 per cent in 2008 to 74 per cent in 2016.12
At course level, the survey results can highlight effective teaching practices and shine a light on outlying cases where courses are less well regarded by their students.13 As well as enhancing teaching practices at universities and colleges, this information makes the NSS a useful source for prospective students who want to compare teaching and assessment across providers.
Students who do not get to voice their opinions in the NSS remain an issue. The NSS is open to students only from January to April of their final year. Those who have left their courses before this point (and therefore potentially the most likely to be dissatisfied) are usually excluded. This also means that groups of students who are less likely to finish their degrees, such as black students with mental health conditions (of whom only 77.1 per cent starting a degree in 2016-17 continued into their second year), are less likely to have their voices heard through the current NSS.14
Therefore, the effect of the NSS has been in tangible improvements to assessment and feedback, ensuring universities and colleges have opportunities to hear their students, and offering transparent informative to prospective students. The NSS has, therefore, helped effect a shift in interactions between staff and students: higher education not for or about students but rather a form of co-production with them.15 With the new questions on the student voice, the survey will bring this aim into even sharper focus.
Controversy and criticism
The NSS has attracted a degree of controversy since its inception.16 Most recently, in 2017, a national student boycott was instigated with support from the NUS and the University and College Union. The basis for the boycott was an objection to the proposal that the TEF – which uses NSS questions on teaching, assessment and feedback, and academic support to assess providers’ performances – should be used to allow an English university or college to increase tuition fees.17 25 students’ unions supported the boycott and 12 universities subsequently had too few student responses returned to be included in the provider-level results.18 However, the boycott did not have a significant impact on the statistical robustness of the 2017 survey: with a response rate of 68 per cent and including the views of more than 300,000 students across more than 500 universities and colleges, it still provided a valuable and extensive source of information.19
This controversy about tuition fees and their link to NSS scores is part of a wider debate about whether students should be perceived as consumers, and how corporate the modern university or college should be.20 The emphasis on student opinion has led some to argue that the NSS has been instrumental in casting the student as consumer (an explicit intention of the 2003 white paper).21 In a similar vein, some academics argue that the survey places undue pressure on staff, subjecting them to greater and unwarranted surveillance and making competitive but specious comparisons between courses.22
The type and content of the survey’s questions have also been a major discussion point in recent years. The question ‘The students’ union (association or guild) effectively represents students’ academic interests’, introduced in 2017, was intended to invite students to reflect on how their students’ union has supported them during their studies. However, cognitive testing has shown that it is often misunderstood as relating more to the social side of a students’ union’s role (such as putting on sports events and running campus bars), or the respondent’s desire to be involved in its organisation (for instance by running for office). Other respondents, especially part-time students and those studying at further education colleges, did not know what the students’ union was.23
One problem is that the NSS results have been employed somewhat outside of their original remit, often standing in as a barometer of ‘student experience’ in general (as seen use in their use in league tables). Much academic study of the survey has looked at the differences in satisfaction between courses.24 For example, some arts courses (and as a result many art colleges overall) receive lower satisfaction than other courses.25 However, such comparison is not especially useful for their prospective students, who will be more likely to want to compare the same courses at different providers than to make distinctions between different subjects.
Characteristics analysis
Instead of looking at raw differences, it is more informative to compare the overall scores with a benchmark. For the 2018 and 2019 surveys, we have run new experimental analysis to create new benchmarks based on five of the six factors which are most closely correlated with different responses to the NSS. For age, for example, the benchmark is based on the sex, ethnicity, disability status, subject classification and mode of study of respondents. This means that if the agreement rate for an age group is different from the benchmark, this is unlikely to result from any of the other characteristics included: for instance, we can ignore the fact that older students are more likely to study part-time. The difference may instead be due to the age of the students, or to a further unknown factor (such as older students being more likely to study at a specific provider).26
This is the first analysis of this kind since 2014.27 It is pertinent because it allows us to highlight where the percentage of respondents who agree are different, in terms of statistical significance, from the calculated benchmarks. More than the headline data, this sort of analysis highlights where the sector is particularly well regarded and where it continues to fall short in the eyes of students. Leaving aside subject of study, already discussed, three groups particularly stand out: part-time students, students from minority ethnic groups, and disabled students.
Figure 4: Percentage of UK-domiciled students who agree ‘It is clear how students’ feedback has been acted on’, by mode of study, 2018 and 201928
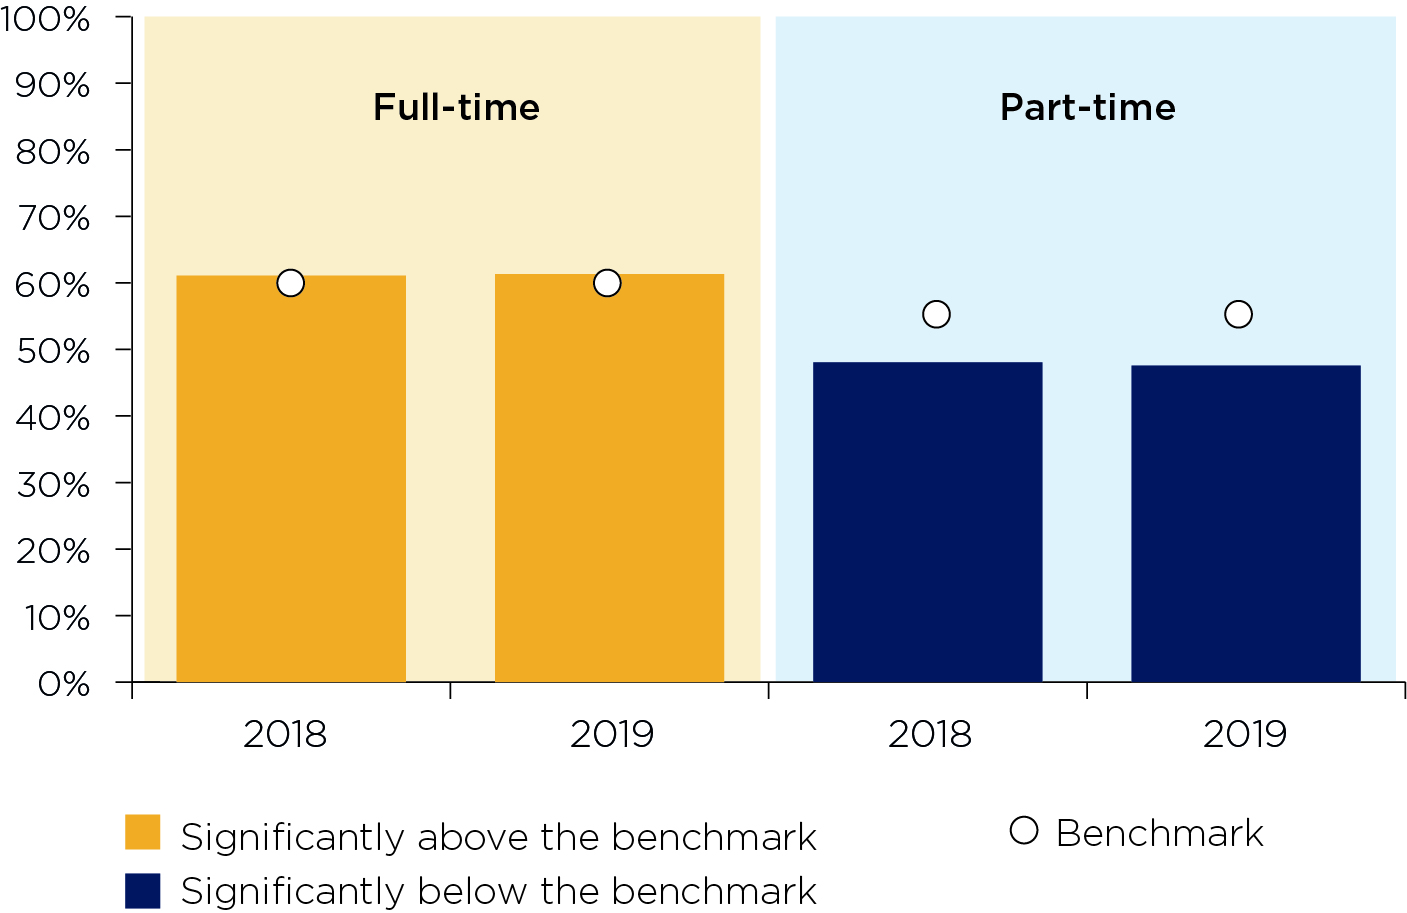
Note: The significance here is at the 99 per cent confidence level.
Figure 4 is a benchmarked double bar graph which shows the percentage of UK-domiciled students who agree ‘It is clear how students’ feedback has been acted on’ by mode of study, 2018 and 2019.
The graph shows that, while full-time students are significantly above their benchmark, part-time students are significantly under their benchmark.
The graph shows:
- Full-time students 2018: 61.1 per cent in agreement against a benchmark of 60.6 per cent, a difference of 0.6 percentage points.
- Full-time students 2019: 61.3 per cent in agreement against a benchmark of 60.7 per cent, a difference of 0.7 percentage points.
- Part-time students 2018: 48.1 per cent in agreement against a benchmark of 54.9 per cent, a difference of -6.9 percentage points.
- Part-time students 2019: 47.6 per cent in agreement against a benchmark of 55.1 per cent, a difference of -7.5 percentage points.
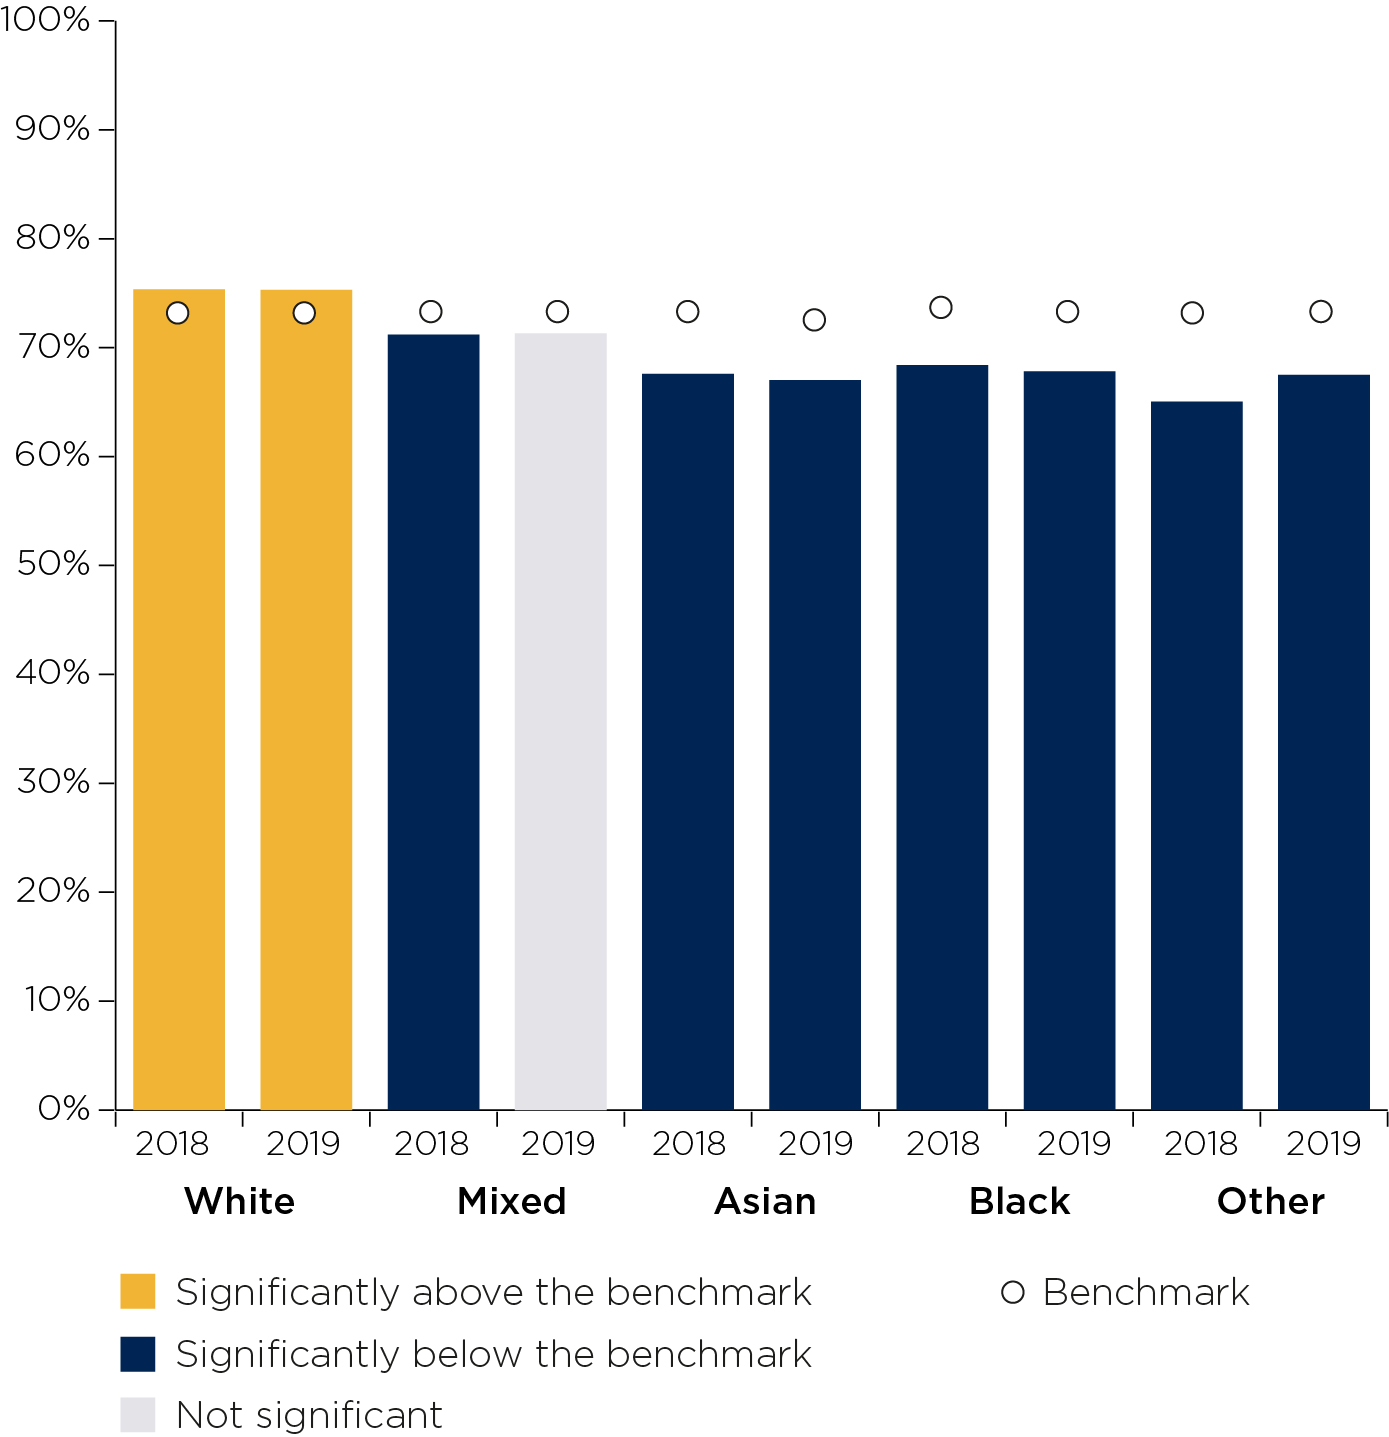
Figure 5: Percentage of UK-domiciled students who agree ‘Marking and assessment has been fair’, by ethnicity, 2018 and 201929
Note: The significance here is at the 99 per cent confidence level.
Figure 5 is a benchmarked double bar graph which shows the percentage of UK-domiciled students who agree ‘Marking and assessment has been fair’ by ethnicity, 2018 and 2019.
The graph shows that, while white students are significantly above their benchmark, Asian, Black and ‘Other’ students are significantly under their benchmark.
The graph shows:
- White students 2018: 75.3 per cent in agreement against a benchmark of 73.8 per cent, a difference of 1.6 percentage points.
- White students 2019: 75.3 per cent in agreement against a benchmark of 73.7 per cent, a difference of 1.6 percentage points.
- Mixed students 2018: 71.2 per cent in agreement against a benchmark of 73.3 per cent, a difference of -2.1 percentage points.
- Mixed students 2019: 71.3 per cent in agreement against a benchmark of 55.1 per cent, a difference of -1.9 percentage points
- Asian students 2018: 67.6 per cent in agreement against a benchmark of 73.1 per cent, a difference of -5.5 percentage points.
- Asian students 2019: 67.0 per cent in agreement against a benchmark of 72.7 per cent, a difference of -5.7 percentage points.
- Black students 2018: 68.4 per cent in agreement against a benchmark of 74.0 per cent, a difference of -5.6 percentage points.
- Black students 2019: 67.8 per cent in agreement against a benchmark of 73.8 per cent, a difference of -6.0 percentage points.
- Other students 2018: 65.1 per cent in agreement against a benchmark of 73.1 per cent, a difference of -8.1 percentage points.
- Other students 2019: 66.2 per cent in agreement against a benchmark of 73.1 per cent, a difference of -6.7 percentage points.
Part-time students: Belonging and community
UK-domiciled part-time students have some of the most significant gaps between their actual agreement levels and the benchmarked levels. These gaps are evident in questions 21 to 26, which are broadly grouped into concerns about learning community and the student voice. Some other groups, such as black students and those from ‘other’ ethnicities, are significantly below the benchmark for their agreement with the statement ‘I feel part of a community of staff and students’. However, only part-time students are significantly below the benchmark for all six of these questions.30
Questions 21 and 22 ask whether the respondent feels part of a community of staff and students, and whether they have the opportunity to work with other students as part of their course. Startlingly, for the former question, in 2019, only 56.6 per cent of part-time students agree, well below the benchmark of 63.7 per cent.31
In the student voice questions, the respondents are asked about their opportunities to provide feedback, whether staff value this feedback, how it has been acted on, and how effectively the students’ union represents students’ academic interests. In 2019, two questions saw less than half of part-time students agree as well as being markedly under the benchmark: 47.6 per cent agreed that their feedback had been acted on (13.8 percentage points behind their full-time peers and 7.5 percentage points below their benchmark) while 47.1 per cent agreed they were represented by their students’ union (8.9 percentage points behind their full-time peers and 3.7 percentage points below their benchmark).32 This stark difference suggests that not all students feel equally listened to or that their views are equally represented.
That part-time students’ agreement is below the benchmark for all these questions suggests that they feel less listened to and less part of the community of their university or college than their full-time counterparts. Because the benchmark takes into account age as a characteristic, we know that the gap is not explained by mature students making up a substantial proportion of part-time students. This gap could be related to a large proportion of part-time students learning through long-distance methods or being clustered at some providers. However, this physical remoteness or uneven distribution should not be an excuse for students suffering from educational isolation.
Creating a sense of ‘belonging’ has long been seen as important for retaining and ensuring a high-quality experience for all students, but especially part-time ones.33 What these responses to the NSS demonstrate is that providers need to work harder to understand the particular needs of part-time students, and respond perceptibly to their feedback. By focusing on the unique needs of part-time students, universities and colleges could also help other groups who may feel at the margins of their learning community, such as mature students and commuter students.
Ethnicity: Interesting courses and fair marking
There is variation between students of different ethnicities by overall satisfaction. When not benchmarked, there is a 4.2 percentage point difference between the highest and the lowest levels recorded for specific ethnic groups domiciled in the UK, white students (84.4 per cent) and students classified as ‘other’ (80.3 per cent). When benchmarked, this difference remains considerable: white students are 0.6 percentage points above their benchmark while students from ‘other’ ethnicities are 3.2 percentage points below theirs.34
There are also notable differences between the experiences of different ethnic groups. Two questions show a significant difference. The first is ‘Staff have made the subject interesting’. In 2019, among those domiciled in the UK, white and black students’ agreement with this statement was benchmarked at roughly the same level (82.8 per cent and 83.0 per cent respectively). Yet white students’ agreement was 1.2 percentage points above the benchmark; for black students it was 3.6 percentage points below the expected level. All ethnicities other than white were significantly under the benchmark.35
The question ‘Marking and assessment has been fair’ also sees divergence (see Figure 5). Asian, black, mixed and other students agree with this statement at a significantly lower level than the benchmark. In 2019, while 75.3 per cent of white students agree with this statement (1.6 percentage points above the benchmark), only 67.0 per cent of Asian students (5.7 percentage points below the benchmark) and 67.8 per cent of black students (6.0 percentage points below the benchmark) agree.
The NSS cannot tell us whether the marking and assessment were actually unfair to black and minority ethnic students, only that these groups of students were less likely to perceive them as fair. However, recent reporting by Universities UK and the NUS highlighted different assessment methods (such as anonymous marking) as one potential way to close the gap in attainment between white students and those of ethnic minority backgrounds.36 In many of the access and participation plans submitted to the OfS, English universities and colleges have set targets to reduce this attainment gap. Underpinning these commitments are measures such as reviewing the curriculum, re-examining methods of assessment, and implementing anonymous marking policies.37
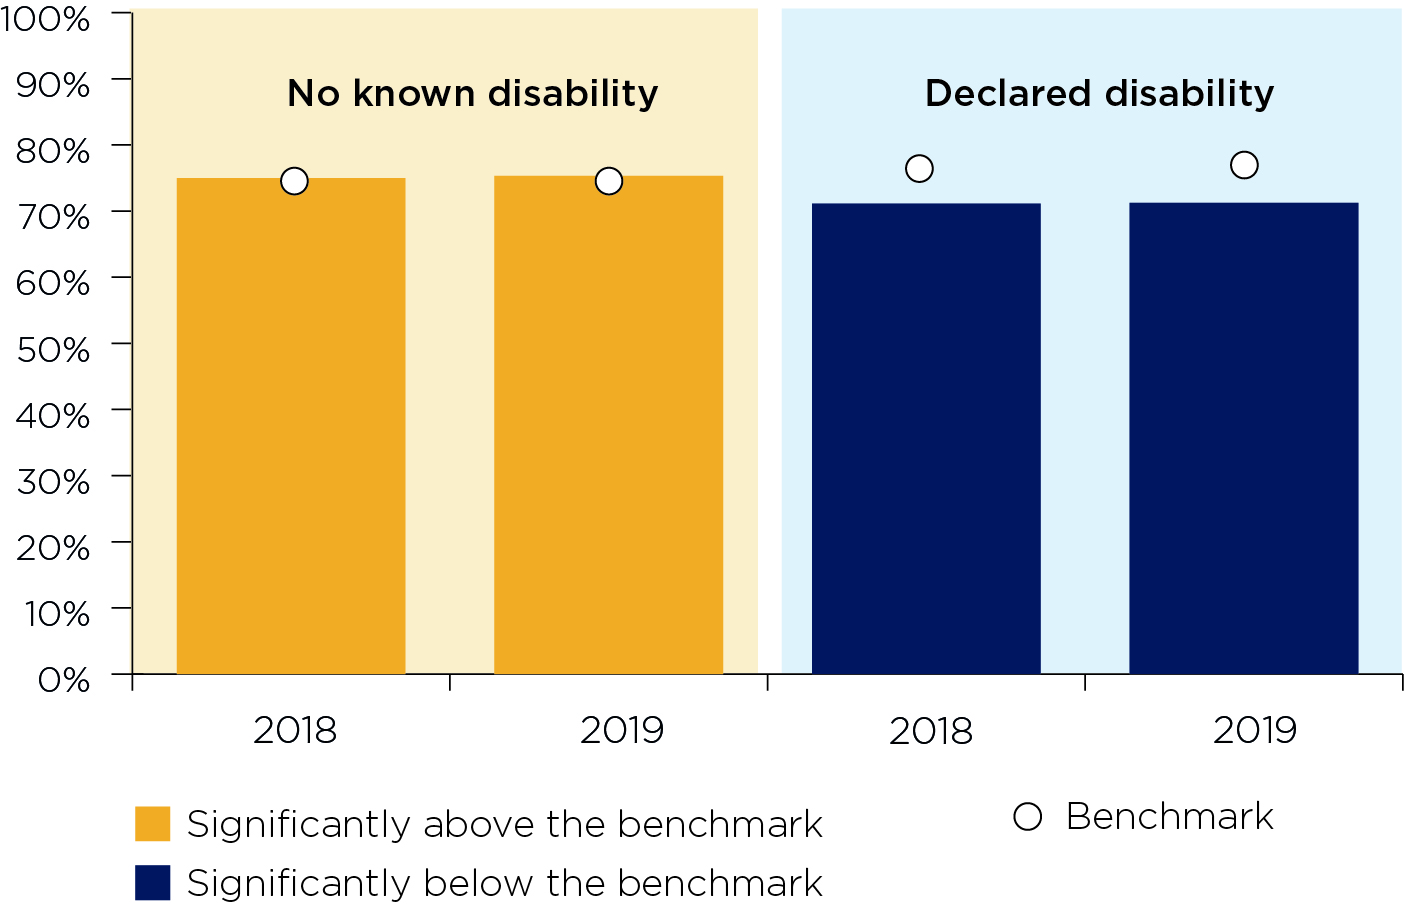
Figure 6: Percentage of UK-domiciled students who agree with all questions in the Organisation and management scale, by disability status, 2018 and 201938
Note: The significance here is at the 99 per cent confidence level.
Figure 6 is a benchmarked double bar graph which shows the percentage of UK-domiciled students who agree with all questions in the Organisation and management scale by disability status, 2018 and 2019.
The graph shows that, while students with no known disability are significantly above their benchmark, students with a declared disability are significantly under their benchmark.
The graph shows:
- Students with no known disability 2018: 75.0 per cent in agreement against a benchmark of 74.5 per cent, a difference of 0.5 percentage points.
- Students with no known disability 2019: 75.3 per cent in agreement against a benchmark of 74.7 per cent, a difference of 0.6 percentage points.
- Students with a declared disability 2018: 71.1 per cent in agreement against a benchmark of 74.1 per cent, a difference of -3.0 percentage points.
- Students with a declared disability 2019: 71.3 per cent in agreement against a benchmark of 74.4 per cent, a difference of -3.1 percentage points.
Disability: Organisation and management
Overall, UK-domiciled disabled students (understood in this context as students who declare a disability) are slightly less satisfied than their non-disabled counterparts (81.4 per cent compared with 84.3 per cent).39 These figures are significant below and above their benchmarks respectively. The questions linked to course organisation and management show some of the largest differences between the two groups.
In 2019, 66.2 per cent of disabled students agreed that their ‘course is well organised and is running smoothly’, 3.0 percentage points below the benchmark. Students who do not declare a disability agree at 0.6 percentage points above their benchmark, at 70.4 percent. 72.4 per cent of disabled students agreed that ‘any changes in the course or teaching have been communicated effectively’, again below the benchmark by 3.5 percentage points. Similarly, students who do not declare a disability are above the benchmark, this time by 0.7 percentage points.40
A 2019 survey of 67 providers showed that only 53.3 per cent compared their NSS results for disabled and non-disabled students.41 The characteristics analysis shows the shortcomings of this approach, as it points to specific concerns about courses that disabled students hold. Such comparison could, if supplemented by relevant text comments, help universities and colleges to respond more effectively to these marginalised students.
As shown in a previous Insight brief, while disabled students have comparable outcomes to non-disabled students, their experience while at college or university can often be worse.42 Through the Disabled Students’ Commission, the OfS is bringing together a range of experts and educators, including a student representative, to highlight the barriers which remain and explore ways to dismantle them. Although beyond the scope of this analysis, in future it would be useful to look at differences by type of disability to explore whether students who declare a mental health condition (for example) have different experiences from those who declare a learning difficulty.
Where the NSS is going
While overall satisfaction is extremely high, looking at the breakdown of questions by student characteristics allows us to see that some students feel more listened to than others. As with any discussion of the ‘student voice’, who exactly gets to speak is critical. As such, the OfS is seeking to better align the survey to the changing concerns of students and to incorporate the views of those who are not currently surveyed.
On behalf of the UK higher education funding and regulatory bodies, the OfS is preparing to consult with students and the sector on a project to pilot the introduction of questions for non-final-year students and changes in process and survey design.
For example, more students than ever report having a mental health condition. Many providers are working on practical steps to support student wellbeing and provide support when mental ill health arises.43 However, students report concerns about long waiting times for counselling on campus, and the adequacy of the adjustments made for the teaching and examination of students with mental health conditions. We will ask if questions about how satisfied students are with the support they are offered by their provider are appropriate for the NSS. This form of questioning could minimise the risk of inadvertently prompting a negative response by asking about support services rather than the student’s own wellbeing.
These changes could have multiple benefits and offer solutions to some of the omissions of the current survey, including:
- capturing the perspectives of students who withdraw from their studies before they reach the final year of their course
- potentially allowing respondents to see and benefit from the improvements they suggest in the survey
- offering additional information and incentives to providers to improve the student experience throughout the duration of the course.
Taken as a whole, these changes could provide a richer source of information for students making choices about where to study; offer a voice to students who are not currently represented by the survey; and grant providers insight into where their course can be enhanced.
Conclusion
The NSS is testament to a higher education sector which is generally well regarded by the students who pass through it. That overall satisfaction is consistently over 80 per cent shows that, for most, the sector is providing a high-quality education. The NSS has helped drive a number of improvements, such as universities and colleges becoming more responsive to student needs, and increasing the importance placed on high-quality teaching and pedagogy.
This is not to argue that there are no remaining areas where the sector or the survey can improve. There remain variations at provider level, with some universities and colleges seeing far lower scores than the headline figure of 83 per cent. Digging beneath the headline figure unearths concerns about the experience of underrepresented groups –students from minority ethnic backgrounds being less sure that marking and assessment is fair, disabled students who are less satisfied with the way their course is managed, and part-time students feeling isolated from the learning community. These concerns need to be addressed.
The survey has also failed, thus far, to include the views of those students who do not complete their courses. An all-years survey might allow greater understanding of why students drop out, and potentially see students benefit from improvements introduced by providers in response to the survey. This change will ensure the continued relevance and usefulness of the NSS in the 2020s.
1 Kells, Becky, ‘Why boycott the NSS?’, 27 January 2017; Frank, Jefferson, Gowar, Norman, and Naef, Michael, English universities in crisis: Markets without competition, 2019, pp158-159; Department for Business, Innovation and Skills, ‘Higher education white paper: Students at the heart of the system’, 2011, pp29-30, 36.
2 Note that this predates the introduction of tuition fees. Harvey, Lee, ‘Getting student satisfaction’, the Guardian, 27 November 2001; Department for Education and Skills, ‘White paper: The future of higher education’, 2003, p47.
3 For the specifics see The National Student Survey: FAQs for students.
4 OfS, ‘2009-2019 NSS summary data’ (available at 'National Student Survey - get the data')
5 For a full list of questions, see ‘NSS questionnaire’, 2020 (available at 'National Student Survey')
6 OfS, ‘2019 NSS summary data’ (available at 'National Student Survey - get the data')
7 OfS, ‘2019 NSS summary data’.
8 OfS, ‘2019 NSS results by teaching provider for all providers' (available at 'National Student Survey - get the data')
9 Stanley, Tracey, ‘The National Student Survey: Pain or gain?’, SCONUL Focus, 2009, pp144-147; Lewis, Martin, and Little, Alison, ‘The National Student Survey: The University of Sheffield Library’, in Jeremy Atkinson (ed.), Quality and the academic library: Reviewing, assessing and enhancing service provision, 2016, pp101-110; Young, Dilys, ‘Student expectations and the NSS: Action planning at Northumbria University Library – A case study’, SCONUL Focus, 2011, pp9-10.
10 OfS, ‘NSS sector-level characteristic analysis’, 2020.
11 Buckley, A, ‘Making it count: Reflecting on the National Student Survey in the process of enhancement’, 2012, pp33-34; Brown, Sally, ‘Bringing about positive change in the higher education student experience: A case study’, Quality Assurance in Education, 2011, pp195-207.
12 Higher Education Funding Council for England (HEFCE), ‘National Student Survey results, 2009’; HEFCE, ‘National Student Survey results 2016’.
13 Tuck, Jackie, ‘Academics engaging with student writing: Working at the higher education textface’, 2017, p102.
14 This figure is for UK-domiciled, full-time students. OfS, ‘Mental health: Are all students being properly supported?’, Insight brief #5, November 2019, p5.
15 Oxley, A, and Flint, A, ‘Placing student voices at the heart of institutional dialogue’, Educational developments, 2008, pp14-16; Brown, ‘Bringing about positive change in the higher education student experience’; Flint, Abbi, Oxley, Anne, Helm, Paul, and Bradley, Sally, ‘Preparing for success: One institution’s aspirational and student-focused response to the National Student Survey’, Teaching in Higher Education, 2009, pp607-618.
16 BBC, ‘Oxbridge urged to support survey’, 21 February 2007.
17 At present having a TEF award allows English providers to increase their fees by up to £250.
18 Grove, Jack, ‘National Student Survey 2017: Campuses omitted after NUS boycott’, 9 August 2019, THE.
19 Benton, Davina, ‘Five myths about the NSS’, 23 April 2018.
20 Brown, Roger, and Carasso, Helen, Everything for sale? The marketisation of UK higher education, 2013; McCaig, Colin, The marketisation of English higher education: A policy analysis of a risk-based system, 2018.
21 Langan, A Mark, and Harris, W Edwin, ‘National student survey metrics: Where is the room for improvement?’, Higher Education, 2019, pp1075-1089; Barefoot, Helen, Oliver, Martin, and Mellar, Harvey, ‘Informed choice? How the United Kingdom’s key information set fails to represent pedagogy to potential students’, Quality in Higher Education, 2016, pp3-19.
22 Sabri, Duna, ‘Student evaluations of teaching as “fact-totems”: The case of the UK National Student Survey’, Sociological Research Online, 2013, pp148-157; Thiel, Jonas, ‘The UK National Student Survey: An amalgam of discipline and neo-liberal governmentality’, British Educational Research Journal, 2019, pp538-553.
23 ‘UK review of information about higher education: Cognitively testing questions for the National Student Survey’, 2015, p72.
24 Lenton, Pamela, ‘Determining student satisfaction: An economic analysis of the National Student Survey’, Economics of Education Review, 2015, pp118-127; Cheng, Jacqueline HS, and Marsh, Herbert W, ‘National Student Survey: Are differences between universities and courses reliable and meaningful?’, Oxford Review of Education, 2010, pp693-712.
25 HEFCE, ‘UK review of the provision of information about higher education: National Student Survey results and trends analysis 2005-2013’, p35.
26 For all the differences highlighted, significance is at the 99 per cent confidence level.
28 OfS, ‘NSS sector-level characteristic analysis’.
29 OfS, ‘NSS sector-level characteristic analysis’.
30 OfS, ‘NSS sector-level characteristic analysis’.
31 OfS, ‘NSS sector-level characteristic analysis’.
32 OfS, ‘NSS sector-level characteristic analysis’.
33 Thomas, Liz, ‘Building student engagement and belonging in higher education at a time of change: final report from the What works? Student retention and success programme’, July 2012, pp91-92.
34 OfS, ‘NSS sector-level characteristic analysis’.
35 OfS, ‘NSS sector-level characteristic analysis’.
36 Universities UK and NUS, ‘Black, Asian and minority ethnic student attainment at UK universities: #closingthegap’, May 2019, pp68-69.
37 OfS, ‘Transforming opportunity in higher education: An analysis of 2020-21 to 2024-25 access and participation plans’, January 2020, p29.
38 OfS, ‘NSS sector-level characteristic analysis’.
39 OfS, ‘NSS sector-level characteristic analysis’.
40 OfS, ‘NSS sector-level characteristic analysis’.
41 Institute for Employment Studies, ‘Review of support for disabled students in higher education in England’, October 2019 (available at 'Beyond the bare minimum: Are universities and colleges doing enough for disabled students?'), p110.
42 OfS, ‘Beyond the bare minimum: Are universities and colleges doing enough for disabled students?’, Insight brief #4, October 2019.
43 OfS, ‘Mental health: Are all students being properly supported?’, p4.
Related content
National Student Survey sector-level characteristic analysis
Less than half of part-timers feel feedback is acted on by staff, but overall student satisfaction consistently high
Describe your experience of using this website