Schools, attainment and the role of higher education
Disparities between the attainment of pupils start in primary school, but their effects are complex and lasting. They can affect individuals’ participation and performance in higher education and their prospects in later life. Universities and colleges are working with schools and other organisations to improve the attainment of disadvantaged pupils and thus improve their chances of going on to higher education, a good degree and a graduate-level job. But there is more that they can do, and our regulation will continue to actively encourage this.
- Date:
- 7 April 2022
Read the brief
Download the Insight brief as a PDF
Get the data
Download the Insight brief data (XLSX)
Read the analysis note
Download the analysis note accompanying the Insight brief (PDF)
Download the analysis note data
Download the data for the analysis note (XLSX)
Introduction
English universities and colleges have a long established history of engaging with schools to help prepare their pupils for higher education.1 Such engagement can range from traditional outreach visits to helping run multi-academy trusts. It often includes such activities as providing information, advice and guidance, and running summer schools and masterclasses for school pupils.
Part of the rationale for this work is to raise the attainment of pupils to a level where university application and attendance are realistic prospects for them. We know of persistent gaps in attainment between learners from advantaged and disadvantaged backgrounds, which start early in life and continue through school and into their later education and employment careers. Low levels of literacy and numeracy reduce participation in tertiary education, limit employment options and mean that salary expectations remain low.
The work universities and colleges do with schools can help to ameliorate this disparity, benefitting not just the pupils who go on to higher education but the institutions themselves, and society in general. Universities are major local institutions with substantial influence, and their mission should include improving the prospects of their nearby populations, and of pupils from disadvantaged backgrounds further afield. Raising school attainment is a critical way of achieving this.
It also enables the universities to recruit and support better prepared students, who are equipped to participate successfully, thus reducing attrition, improving degree outcomes and leading to more successful graduates. A more skilled workforce then helps to generate a stronger, more productive economy, once again benefiting the local area.2
With all these ends in mind, progress has been made to reduce attainment gaps over the last decade.3 However, those gaps continue to affect lives, from primary school through secondary and tertiary education and into adult careers. Moreover, the pandemic has represented a substantial setback to this progress, which had already begun to slow down prior to its arrival.
This Insight brief looks at the history and prospects of these long-term disparities, and at how they can be addressed. It outlines what universities and colleges can do, and what the Office for Students (OfS) will encourage them to do, by building on their existing work with schools to develop strategic partnerships focused on raising attainment.
Jargon buster
- Free school meals (FSM): Free lunches (and sometimes milk, breakfast or fruit) provided at state schools for children of parents on specific state benefits.
- Selective university: Used here to refer to high-tariff universities. Universities are grouped into higher, medium and lower tariffs based on analysis of the qualifications of their entrants.4
- Type 2 approach: In the OfS standards of evidence, an empirical evaluation that collects data on the impact of an intervention in schools, and reports any evidence that those receiving an intervention have better outcomes, without establishing a direct causal effect.5
- Uni Connect: An OfS-funded programme bringing together partnerships of universities, colleges and other local partners to offer activities, advice and information on the benefits and realities of going to university or college.
The attainment gap
Most families want a university education for their children, and that aspiration is shared by most young people.6 But there have been significant barriers to access to higher education, including the impacts of socioeconomic disadvantage, geography and available guidance about the options. At the core of many of these problems is the attainment gap – young people from disadvantaged backgrounds, even those who want to attend higher education, have been unable to acquire and demonstrate the same levels of knowledge and skill as their more advantaged peers in relevant areas of learning. This is not a failing with the pupils, but a result of accumulated impacts that schools, appropriately supported, can do a great deal to ameliorate.7
The gaps in development and attainment between advantaged and disadvantaged children are evident from the early years and widen throughout school. Poverty, special educational needs and ethnicity have been among the most important factors in this educational disparity.8 In the latest year of published data, for example, young people who were not eligible for free school meals (FSM) at age 15 were 70 per cent more likely to enter higher education by age 19 than those who were.9
As Figure 1 shows, between 2012-13 and 2016-17 (when many students now at university were taking their GCSEs), 23 per cent of pupils eligible for FSM were awarded no higher grade GCSEs, whereas only 8 per cent of those not eligible faced this outcome. Meanwhile, 18 per cent of pupils not eligible for FSM attained 11 or more higher grade GCSEs, compared with only 6 per cent of those eligible.10
Figure 1: GCSE attainment at Key Stage 4 by free school meal status between 2012-13 and 2016-17
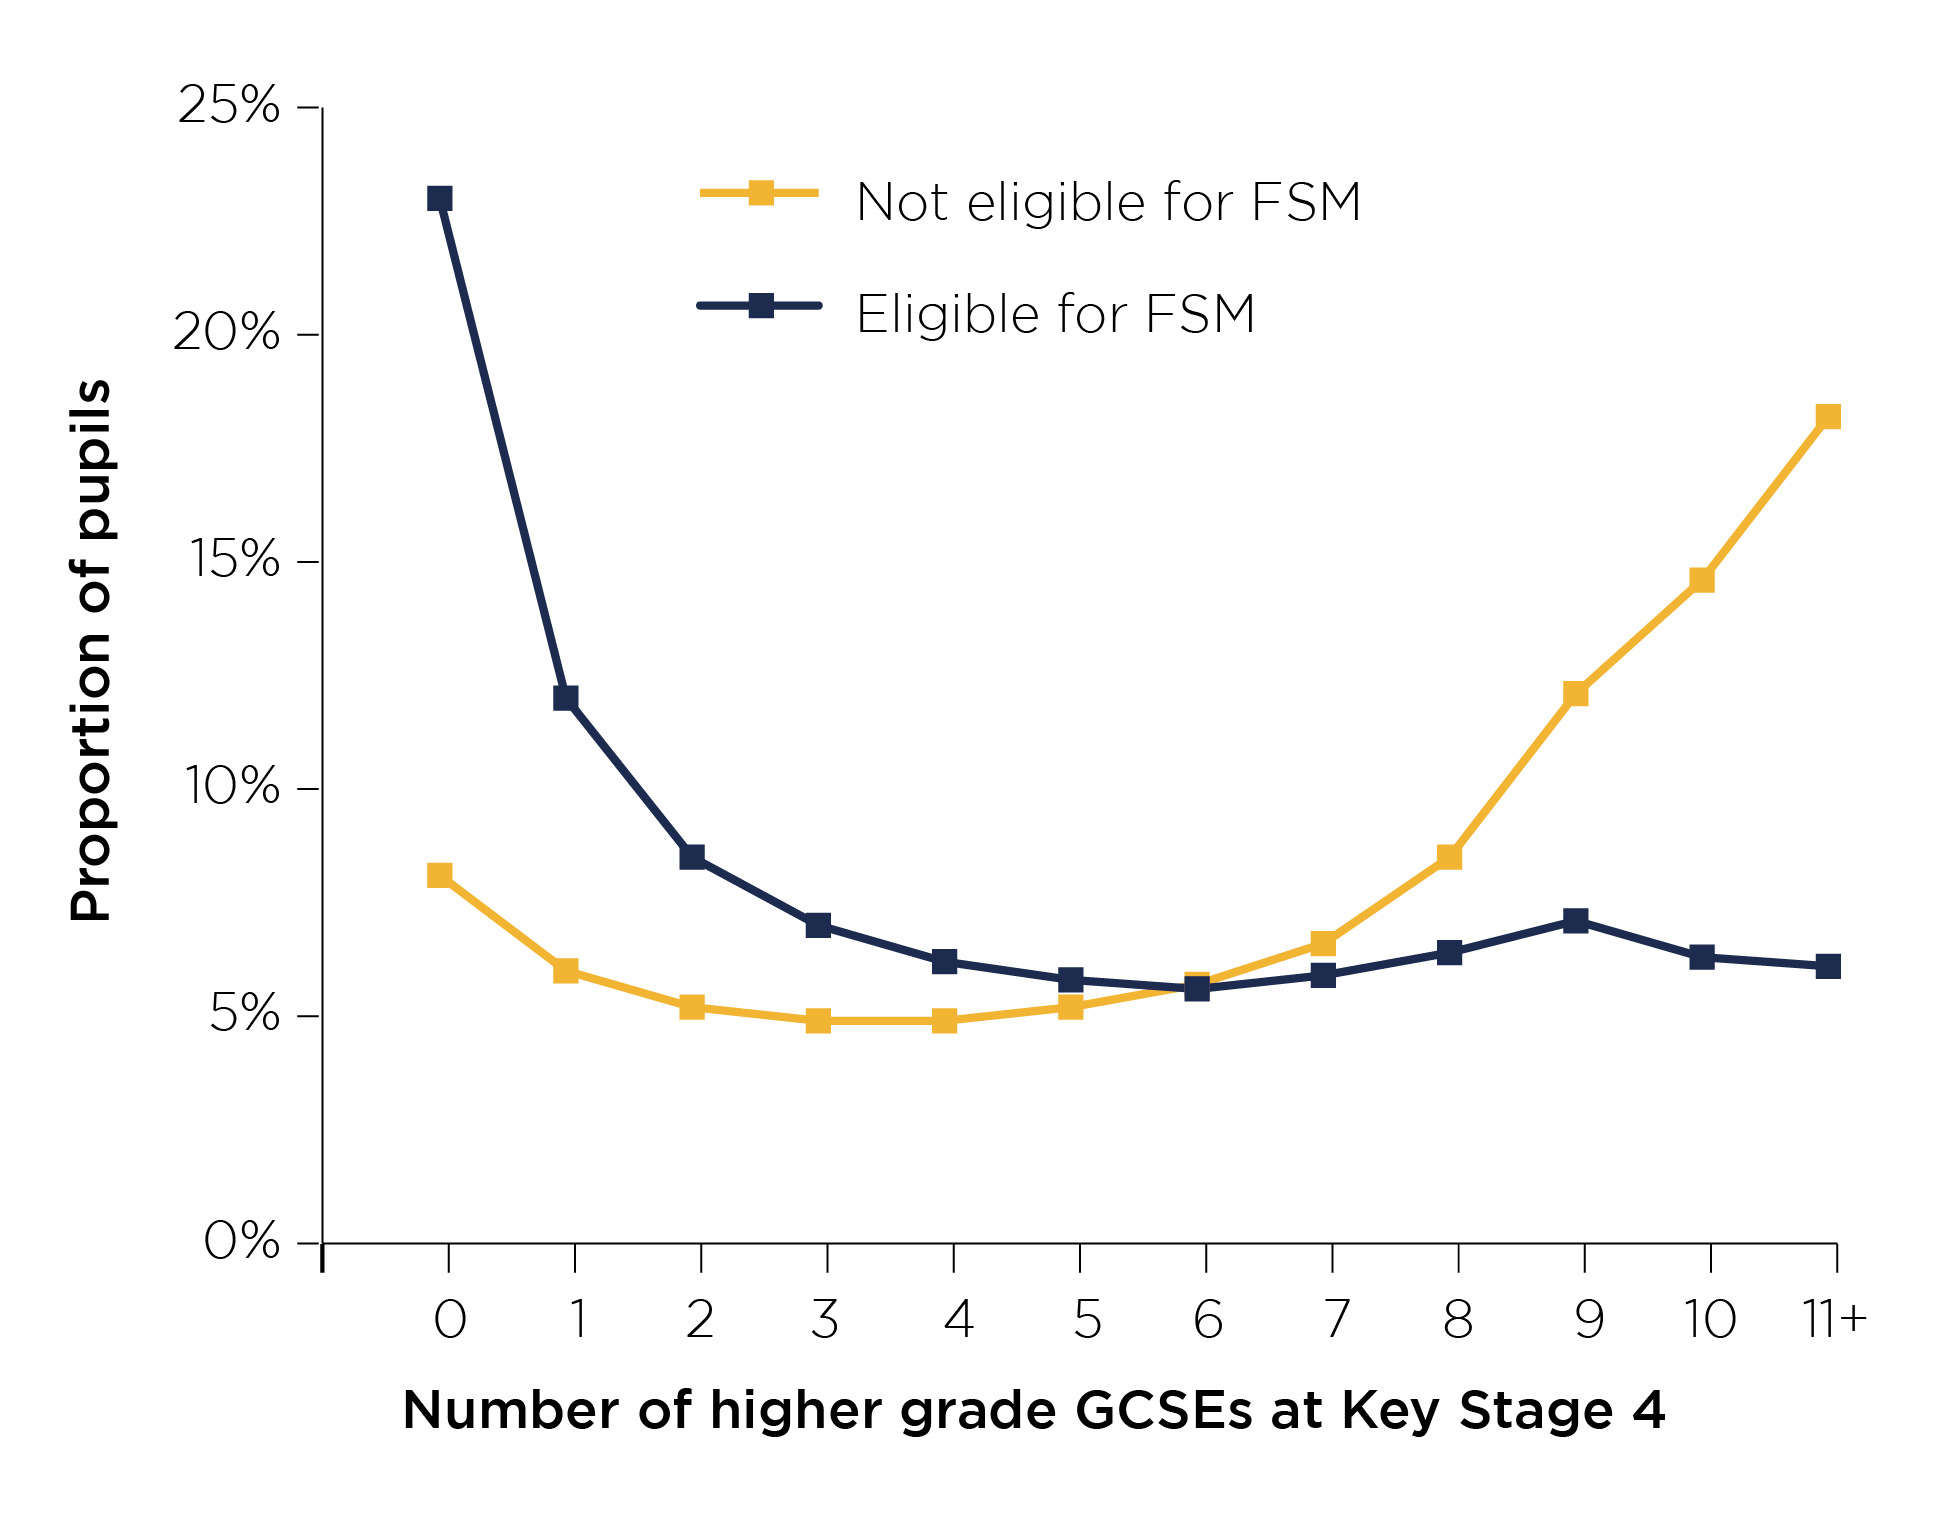
Figure 1 is a double line chart showing GCSE attainment at Key Stage 4 between 2012-13 and 2016-17, by free school meal (FSM) status. It shows that attaining a higher number of high GCSE grades (i.e. grades C or 4 and above) at Key Stage 4 was more common among pupils not eligible for FSM, and attaining a lower number was more common among those eligible for FSM.
It shows that:
- 0 per cent of pupils eligible for FSM, and 8.1 per cent of pupils not eligible for FSM, gained no higher grade GCSEs.
- 0 per cent of pupils eligible for FSM, and 6.0 per cent of pupils not eligible for FSM, gained one higher grade GCSE.
- 5 per cent of pupils eligible for FSM, and 5.2 per cent of pupils not eligible for FSM, gained two higher grade GCSEs.
- 0 per cent of pupils eligible for FSM, and 4.9 per cent of pupils not eligible for FSM, gained three higher grade GCSEs.
- 2 per cent of pupils eligible for FSM, and 4.9 per cent of pupils not eligible for FSM, gained four higher grade GCSEs.
- 8 per cent of pupils eligible for FSM, and 5.2 per cent of pupils not eligible for FSM, gained five higher grade GCSEs.
- 6 per cent of pupils eligible for FSM, and 5.7 per cent of pupils not eligible for FSM, gained six higher grade GCSEs.
- 9 per cent of pupils eligible for FSM, and 6.6 per cent of pupils not eligible for FSM, gained seven higher grade GCSEs.
- 4 per cent of pupils eligible for FSM, and 8.5 per cent of pupils not eligible for FSM, gained eight higher grade GCSEs.
- 1 per cent of pupils eligible for FSM, and 12.1 per cent of pupils not eligible for FSM, gained nine higher grade GCSEs.
- 3 per cent of pupils eligible for FSM, and 14.6 per cent of pupils not eligible for FSM, gained 10 higher grade GCSEs.
- 1 per cent of pupils eligible for FSM, and 18.2 per cent of pupils not eligible for FSM, gained 11 or more higher grade GCSEs.
Achievement at GCSE is an important indicator of future participation in higher education. In the most recent published data, just 27 per cent of pupils eligible for FSM went on to university, compared with 46 per cent of pupils not in this group.11 For pupils awarded the same number of higher grade GCSEs, the chance of entering higher education is pretty much the same whether they were eligible for FSM or not, as seen in Figure 2. So, the participation gap between these two groups can be almost entirely explained by their prior attainment at this stage of their education.
Figure 2: Proportion of pupils entering higher education by 19, by GCSE attainment and free school meal status between 2012-13 and 2016-17
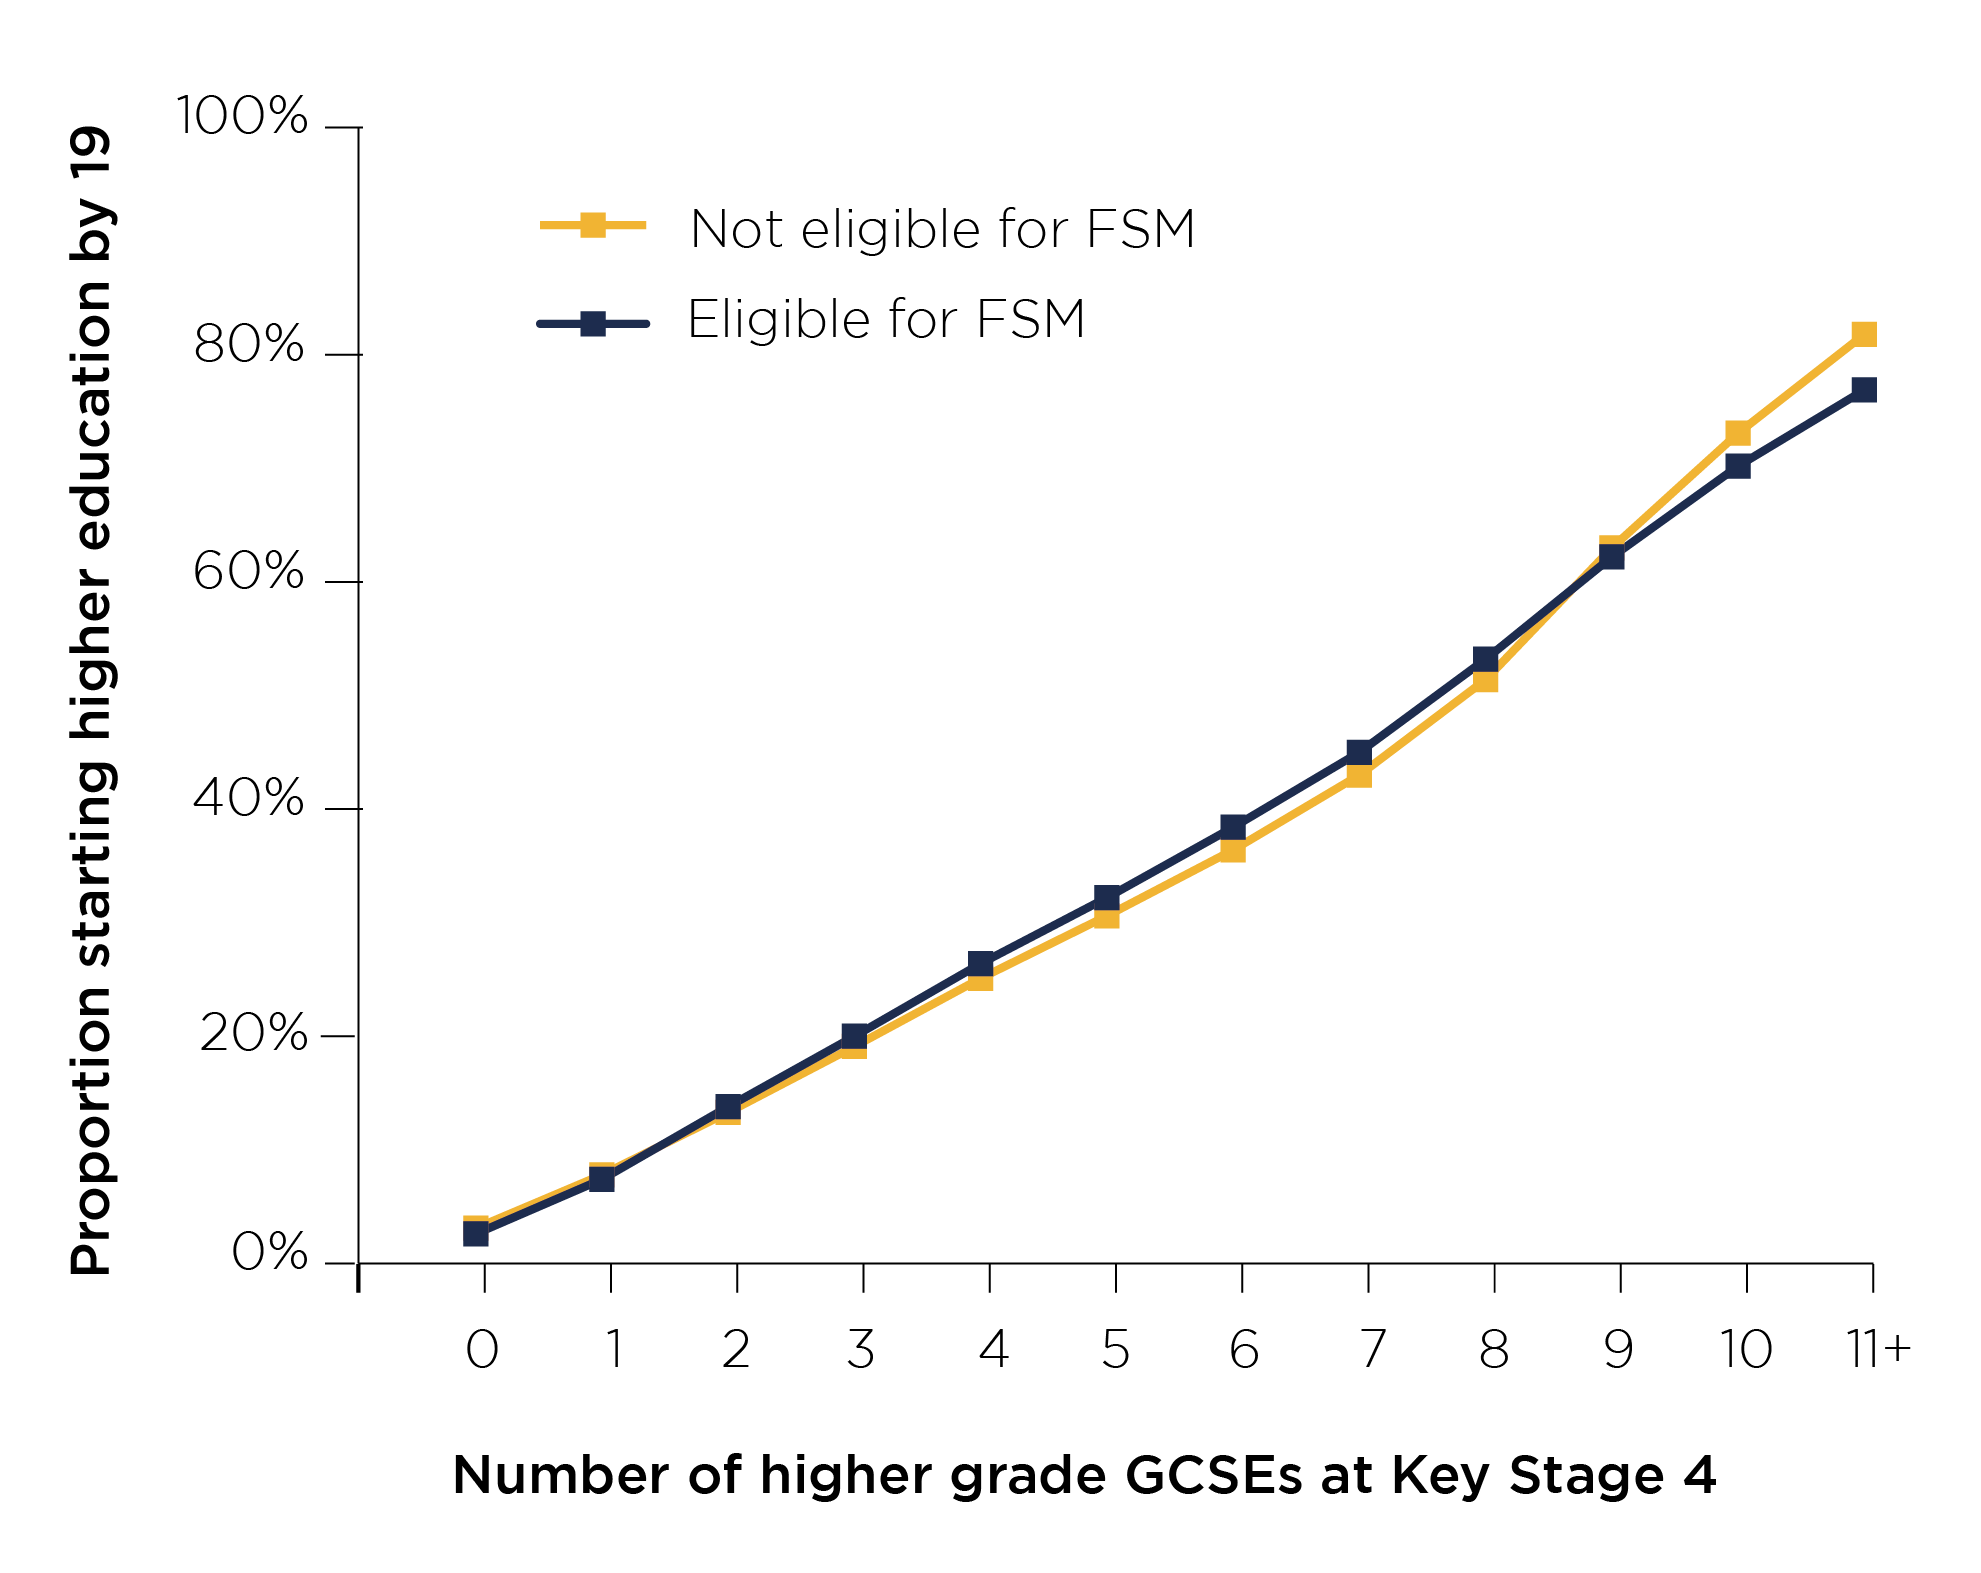
Figure 2 is a double line chart showing the proportions of school pupils between 2012-13 and 2016-17 who went on to enter higher education by the age of 19, by GCSE attainment and free school meal (FSM) status. It shows that, among pupils awarded the same number of higher grade GCSEs, the chance of entering higher education is pretty much the same whether they were eligible for FSM or not.
It shows that:
- Among pupils with no higher grade GCSEs at Key Stage 4, 2.6 per cent of those eligible for FSM, and 3.1 per cent of those not eligible for FSM, entered higher education by age 19.
- Among pupils with one higher grade GCSE at Key Stage 4, 7.4 per cent of those eligible for FSM, and 7.8 per cent of those not eligible for FSM, entered higher education by age 19.
- Among pupils with two higher grade GCSEs at Key Stage 4, 13.8 per cent of those eligible for FSM, and 13.3 per cent of those not eligible for FSM, entered higher education by age 19.
- Among pupils with three higher grade GCSEs at Key Stage 4, 20.0 per cent of those eligible for FSM, and 19.1 per cent of those not eligible for FSM, entered higher education by age 19.
- Among pupils with four higher grade GCSEs at Key Stage 4, 26.4 per cent of those eligible for FSM, and 25.1 per cent of those not eligible for FSM, entered higher education by age 19.
- Among pupils with five higher grade GCSEs at Key Stage 4, 32.2 per cent of those eligible for FSM, and 30.6 per cent of those not eligible for FSM, entered higher education by age 19.
- Among pupils with six higher grade GCSEs at Key Stage 4, 38.4 per cent of those eligible for FSM, and 36.4 per cent of those not eligible for FSM, entered higher education by age 19.
- Among pupils with seven higher grade GCSEs at Key Stage 4, 45.0 per cent of those eligible for FSM, and 43.0 per cent of those not eligible for FSM, entered higher education by age 19.
- Among pupils with eight higher grade GCSEs at Key Stage 4, 53.2 per cent of those eligible for FSM, and 51.4 per cent of those not eligible for FSM, entered higher education by age 19.
- Among pupils with nine higher grade GCSEs at Key Stage 4, 62.2 per cent of those eligible for FSM, and 63.0 per cent of those not eligible for FSM, entered higher education by age 19.
- Among pupils with 10 higher grade GCSEs at Key Stage 4, 70.2 per cent of those eligible for FSM, and 73.1 per cent of those not eligible for FSM, entered higher education by age 19.
Among pupils with 11 or more higher grade GCSEs at Key Stage 4, 76.9 per cent of those eligible for FSM, and 81.8 per cent of those not eligible for FSM, entered higher education by age 19.
Effects of the pandemic
The COVID-19 pandemic, and the consequent national lockdowns that began in March 2020 and continued through 2021, resulted in schools closing to most pupils, who had to continue their education at home. They also changed the operation of national tests and public exams, reducing the opportunity for disadvantaged pupils to demonstrate their knowledge in a standardised test, rather than relying on teacher grading. In disrupting education and assessment, impacting mental health and wellbeing, harming language and communication skills, and obstructing careers advice and guidance, the pandemic has almost certainly exacerbated these disparities.
The issue of learning loss during lockdowns has been widely acknowledged for both primary and secondary pupils, but the evidence shows that those pupils from more disadvantaged backgrounds suffered greater learning loss than their more advantaged peers.12 Regional disparities have also emerged. There has also been an increase since the beginning of the pandemic in children eligible for FSM.13
Digital and learning poverty remain an important factor, with many more pupils from deprived backgrounds reporting that they had no access to quiet study spaces, as well as limited access to technology to participate.14 The Department for Education has responded to this need by providing 1.9 million learning devices for learners by March 2022.15
The changes in how A-Levels and GCSEs were awarded during the pandemic have seen a big increase in top grades. In 2021, 44 per cent of A level grades were A or A*, compared with 25 per cent in 2019, the last year when national exams took place.16 While this applied to pupils from across the school system, these increases were unevenly distributed, with the proportions of top A-level grades awarded in 2021 to pupils in independent schools increasing by nine percentage points (from 61 to 70 per cent) – considerably greater than the six percentage points (from 38 to 44 per cent) seen overall.17
Although the actual numbers of entrants, including those in the most underrepresented groups, increased in both 2020 and 2021, these increases benefited more of those pupils whose background made them more likely to attend university in the first place. Among students from those communities most underrepresented in higher education, 6.1 per cent gained places at the most selective universities in 2021.18 Proportionally this was a 12.7 per cent increase on the rate in 2020, but it was accompanied by a similar increase in the proportion of students entering these universities from the areas with the highest representation.19 Figure 3 illustrates this.
Since the former numbers are still small in absolute terms, this means that the increase in headcount was larger among the more advantaged pupils. And since graduates from these universities are more likely to access professional careers, report higher life satisfaction and earn an average of £10,000 more annually, this disparity will continue to have an impact on the lives of these students.20
Figure 3: Entry rates to the most selective universities and colleges by Participation of Local Areas (POLAR) quintile for the 2017 to 2021 UCAS cycles
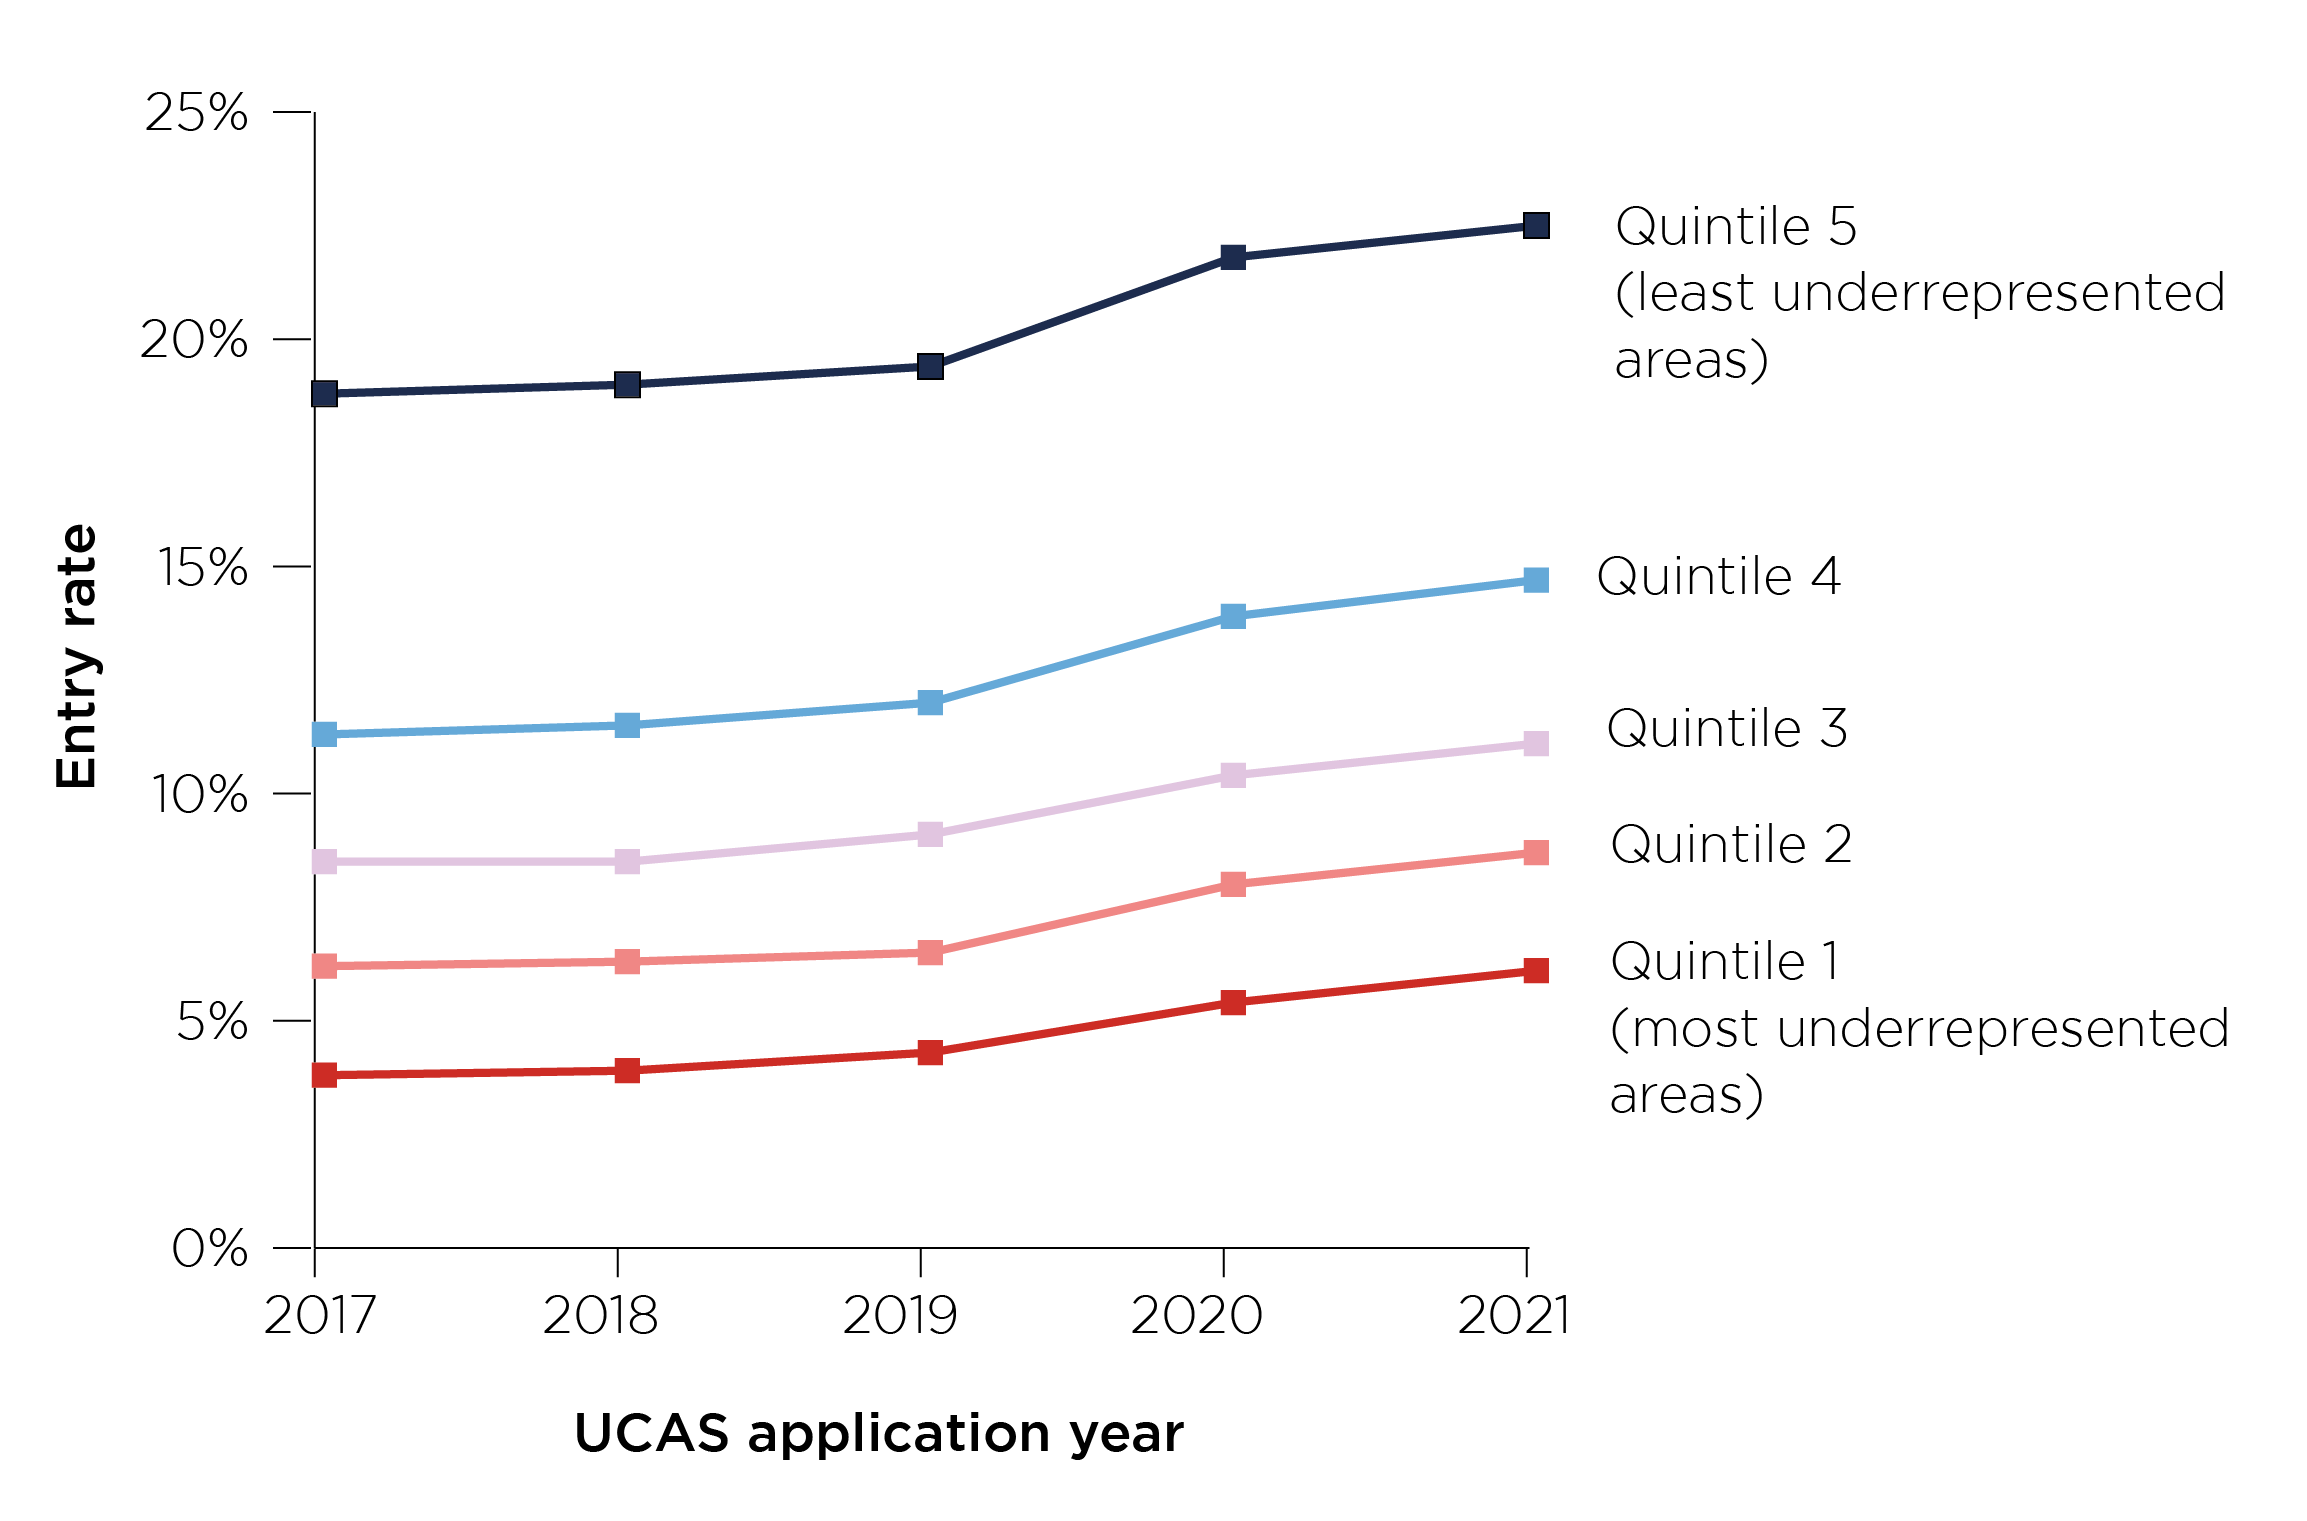
Figure 3 is a quintuple line chart displaying the entry rates to the most competitive (i.e. high-tariff) providers by POLAR4 quintile for 2017 to 2021 UCAS cycles. It shows that in 2021, the difference in entry rates between POLAR4 quintile 5 (least underrepresented areas) and quintile 1 (most underrepresented areas) increased by less than 0.1 percentage points compared with 2020, up to 16.5 percentage points. The ratio between the entry rates continued to decrease, so that UK 18-year-olds from POLAR4 quintile 5 areas were 3.7 times more likely to be placed at higher tariff providers than those from quintile 1 areas, down from 4.1 times in 2020.
It shows that:
- For Quintile 5 (the least underrepresented areas), the entry rate in 2017 was 18.8 per cent, in 2018 it was 19.0 per cent, in 2019 it was 19.4 per cent, in 2020 it was 21.8 per cent, and in 2021 it was 22.5 per cent.
- For Quintile 4, the entry rate in 2017 was 11.3 per cent, in 2018 it was 11.5 per cent, in 2019 it was 12.0 per cent, in 2020 it was 13.9 per cent, and in 2021 it was 14.7 per cent.
- For Quintile 3, the entry rate in 2017 was 8.5 per cent, in 2018 it was 8.5 per cent, in 2019 it was 9.1 per cent, in 2020 it was 10.4 per cent, and in 2021 it was 11.1 per cent.
- For Quintile 2, the entry rate in 2017 was 6.2 per cent, in 2018 it was 6.3 per cent, in 2019 it was 6.5 per cent, in 2020 it was 8.0 per cent, and in 2021 it was 8.7 per cent.
- For Quintile 1 (the most underrepresented areas), the entry rate in 2017 was 3.8 per cent, in 2018 it was 3.9 per cent, in 2019 it was 4.3 per cent, in 2020 it was 5.4 per cent, and in 2021 it was 6.1 per cent.
Benefits of higher education
As well as being a key factor for understanding who has the opportunity to go on to higher education, prior attainment has been reflected in how well students have done when they get there and what they have gone on to do once they graduate. Analysis for 2019-20, shown in Figure 4, identifies a difference of 23 percentage points in degree attainment between those who entered with A*A*A* at A-level and those who had entered with below DDD, with 98.4 per cent of the former gaining a 1st or 2:1 compared with 75.4 per cent of the latter.21 Those from disadvantaged backgrounds who have participated in higher education have been more likely to drop out, less likely to graduate with a first or upper second class degree, and less likely to progress into graduate-level employment than their more advantaged peers.22
Figure 4: Percentage of qualifiers by entry qualifications, 2019-20 graduates
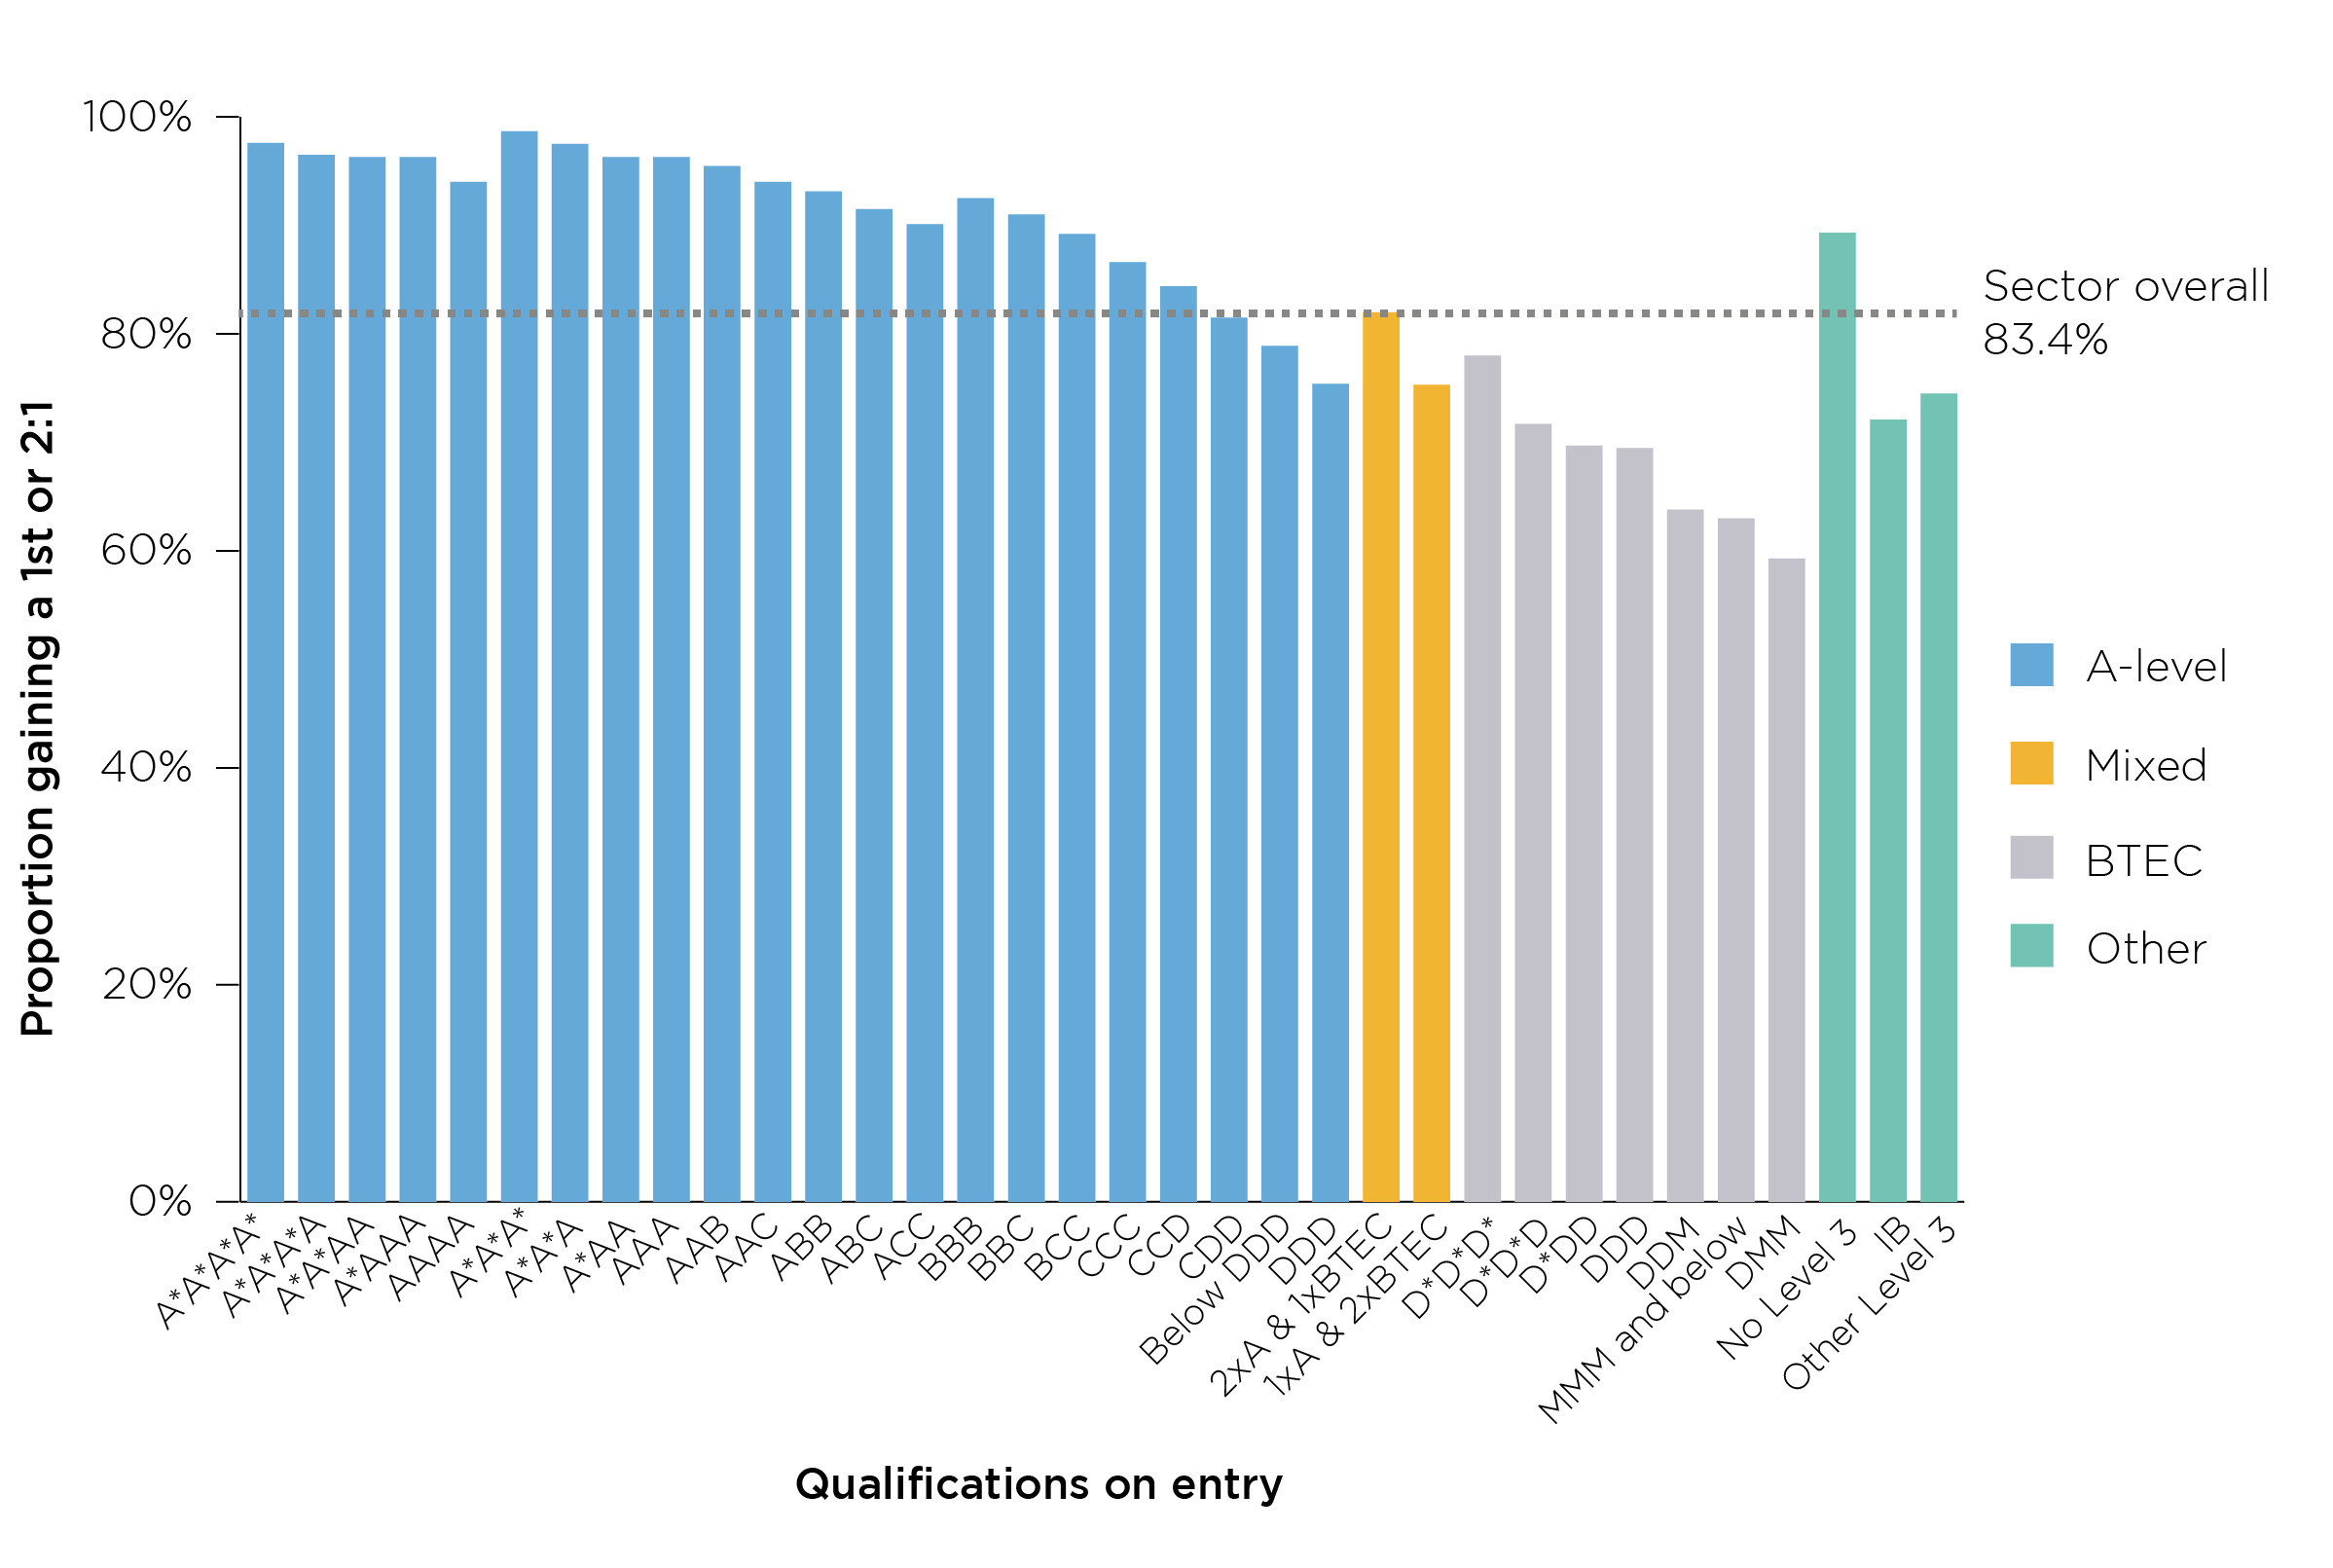
Figure 4 is a bar graph showing the proportion of 2019-20 graduates gaining a first or upper second degree based on their qualifications on entry to higher education. It shows that on the whole higher grades in these qualifications are associated with higher degree attainment.
For students with A-levels, it shows that:
- 6 per cent of those with grades of A*A*A*A* gained a 1st or 2:1.
- 5 per cent of those with grades of A*A*A*A gained a 1st or 2:1.
- 3 per cent of those with grades of A*A*AA gained a 1st or 2:1.
- 3 per cent of those with grades of A*AAA gained a 1st or 2:1.
- 0 per cent of those with grades of AAAA gained a 1st or 2:1.
- 4 per cent of those with grades of A*A*A* gained a 1st or 2:1.
- 5 per cent of those with grades of A*A*A gained a 1st or 2:1.
- 3 per cent of those with grades of A*AA gained a 1st or 2:1.
- 3 per cent of those with grades of AAA gained a 1st or 2:1.
- 2 per cent of those with grades of AAB gained a 1st or 2:1.
- 94 per cent of those with grades of AAC gained a 1st or 2:1.
- 4 per cent of those with grades of ABB gained a 1st or 2:1.
- 5 per cent of those with grades of ABC gained a 1st or 2:1.
- 1 per cent of those with grades of ACC gained a 1st or 2:1.
- 5 per cent of those with grades of BBB gained a 1st or 2:1.
- 0 per cent of those with grades of BBC gained a 1st or 2:1.
- 2 per cent of those with grades of BCC gained a 1st or 2:1.
- 6 per cent of those with grades of CCC gained a 1st or 2:1.
- 4 per cent of those with grades of CCD gained a 1st or 2:1.
- 5 per cent of those with grades of CDD gained a 1st or 2:1.
- 9 per cent of those with grades of DDD gained a 1st or 2:1.
- 4 per cent of those with grades below DDD gained a 1st or 2:1.
For students with mixed A-levels and BTECs, it shows that:
- 0 per cent of those with two A-levels and one BTEC gained a 1st or 2:1.
- 3 per cent of those with one A-level and two BTECS gained a 1st or 2:1.
For students with BTECs, it shows that:
- 78 per cent of those with grades of D*D*D* gained a 1st or 2:1.
- 7 per cent of those with grades of D*D*D gained a 1st or 2:1.
- 7 per cent of those with grades of D*DD gained a 1st or 2:1.
- 2 per cent of those with grades of DDD gained a 1st or 2:1.
- 8 per cent of those with grades of DDM gained a 1st or 2:1.
- 63 per cent of those with grades of DMM gained a 1st or 2:1.
- 3 per cent of those with grades of MMM and below gained a 1st or 2:1.
For other students, it shows that:
- 7 of those with an International Baccalaureate gained a 1st or 2:1.
- 0 of those with no Level 3 qualifications gained a 1st or 2:1.
- 5 of those with other Level 3 qualifications gained a 1st or 2:1.
Across the sector overall, 83.4 per cent of students gained a 1st or 2:1.
While there are substantial benefits to being a graduate, not all have benefited equally from their degree. Smaller proportions than average, both of graduates whose parents had no residual income and of black graduates, have gone on to a highly skilled job or further study. Both are groups whose attainment at school is likely to have been lower than average. Among those graduating in 2016-17, this outcome was observed in 74.0 per cent of white students and only 69.3 per cent of black students, and (as illustrated in Figure 5) was 72.7 per cent among those whose parents had a household residual income of £42,601 and above, compared with 65.0 per cent among those with no residual income.23
Figure 5: Students progressing into highly skilled employment or higher level study by household residual income
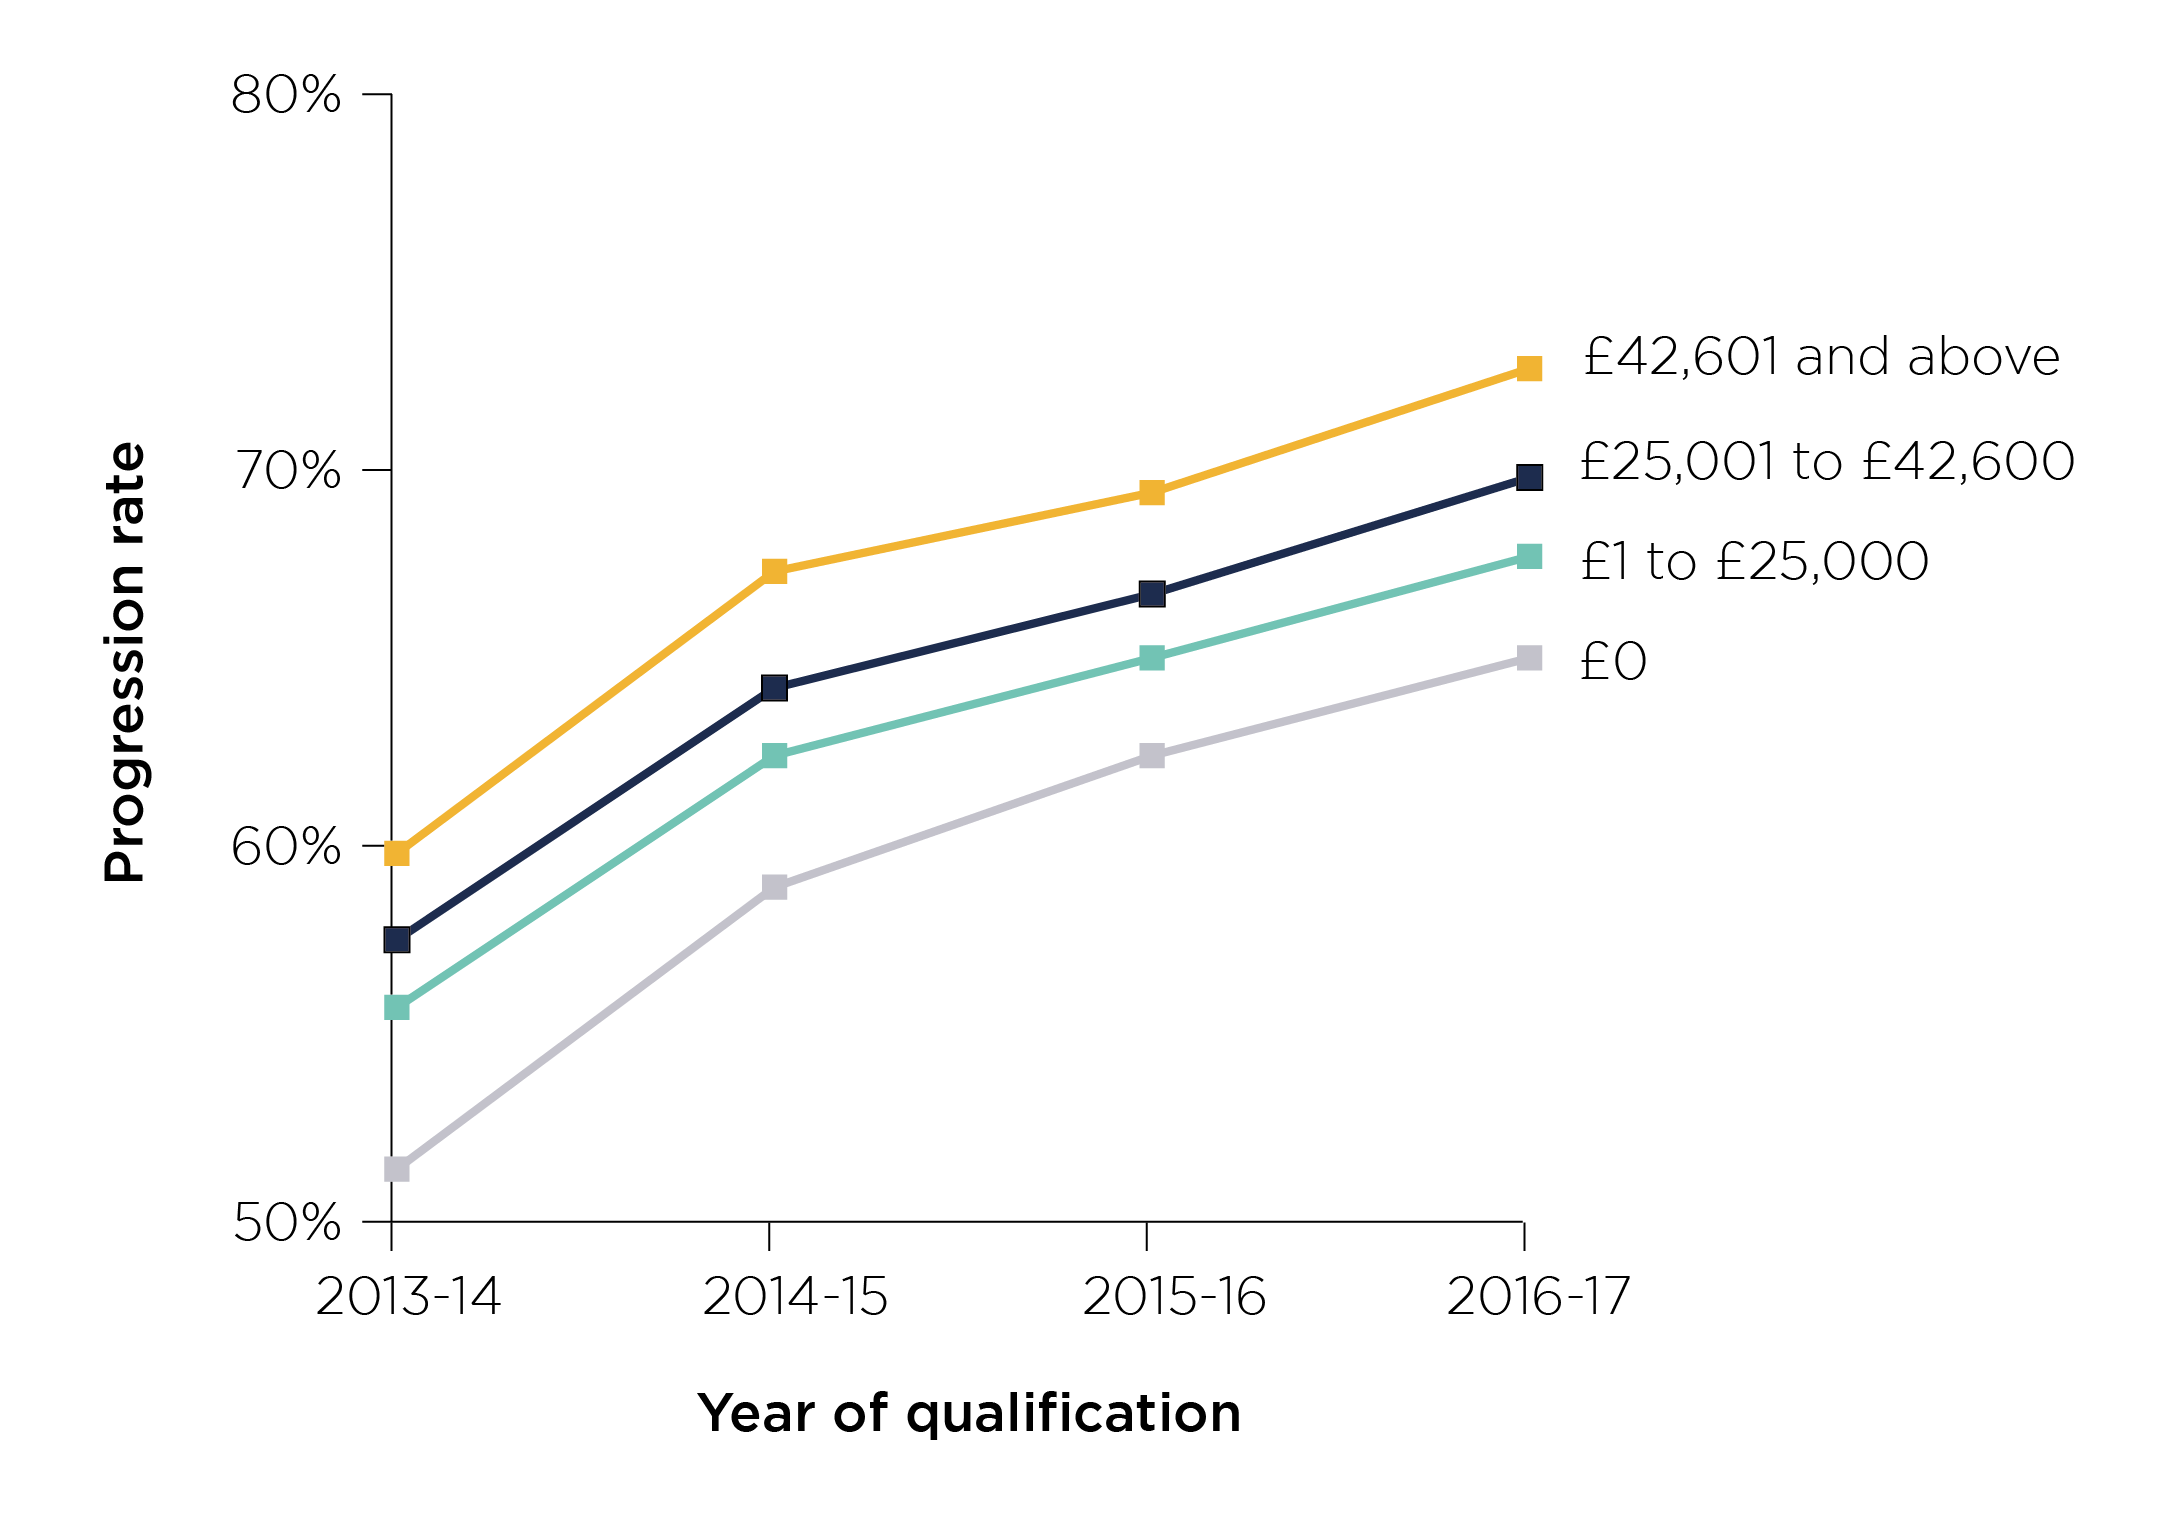
Figure 5 is a quadruple line graph showing progression rates from the academic years 2013-14 to 2016-17 for students with different levels of household residual income (HRI). It shows that, while progression rates for all groups increased over these four years, higher rates of progression remained associated with higher residual income.
It shows that:
- In 2013-14, 59.8 per cent of those with an HRI of £42,601 and above, 57.5 per cent of those with an HRI of £25,001 to £42,600, 55.7 per cent of those with an HRI of £1 to £25,001, and 51.4, progressed into highly skilled employment or higher level study.
- In 2014-15, 67.3 per cent of those with an HRI of £42,601 and above, 64.2 per cent of those with an HRI of £25,001 to £42,600, 62.4 per cent of those with an HRI of £1 to £25,001, and 58.9, progressed into highly skilled employment or higher level study.
- In 2015-16, 69.4 per cent of those with an HRI of £42,601 and above, 66.7 per cent of those with an HRI of £25,001 to £42,600, 65.0 per cent of those with an HRI of £1 to £25,001, and 62.4, progressed into highly skilled employment or higher level study.
- In 2016-17, 72.7 per cent of those with an HRI of £42,601 and above, 69.8 per cent of those with an HRI of £25,001 to £42,600, 67.7 per cent of those with an HRI of £1 to £25,001, and 65.0 per cent of those with an HRI of £0, progressed into highly skilled employment or higher level study.
The benefits of improving the chances of entering and succeeding at higher education are clear. Recent research from the Sutton Trust followed to the age of 30 three cohorts of pupils who sat their GCSEs between 2002 and 2004. It showed that attending university remained a key driver of social mobility. Disadvantaged young people who got a degree were more likely to gain a job in a higher income bracket. By the age of 30, people from disadvantaged backgrounds who did not enter higher education were much more likely to be in the lowest income groups.25
This benefit has held up during the pandemic. In 2020, 86.4 per cent of graduates of working age were in employment, compared with 71.3 per cent of non-graduates: the proportion of graduates not employed in graduate occupations decreased by 5.0 percentage points to 25.5 per cent between the respective third quarters of 2019 and 2020.26 The median salary for graduates was £35,000, £9,500 higher than for non-graduates. Postgraduates earned on average £42,000. While only 24.5 per cent of non-graduates were in highly skilled employment, the same was true of two-thirds of graduates.27
What universities, colleges and schools can do
The government has signalled that it expects ‘to see the whole higher education sector stepping up and taking a greater role in continuing to raise aspirations and standards in education’.28 Money spent by universities on access and participation should be ‘used effectively and in line with evidence to deliver real social mobility’29. The OfS supports this work and is keen to see the independent evaluation of all our interventions.
It is not reasonable that there should be a trade-off between access and quality, or that students who have travelled demanding routes to reach higher education should have lower expectations of their outcomes. Rather, universities and colleges have a responsibility to improve equality of opportunity and quality together.
It is also incumbent upon all involved in education, at whatever stage, to work to close the gap between disadvantaged pupils and their peers through improving attainment much earlier in life. To this end we will expect universities to continue to seek out strategic, enduring and mutually beneficial partnership with schools and third-sector organisations, and to experiment with new ways to improve the attainment of disadvantaged pupils.
Case study: Books and Stories, Bournemouth University
Bournemouth University developed Books and Stories in 2014, as a targeted intervention aiming to achieve demonstrable improvement in the reading ability of Year 6 pupils, and to advance their confidence in and attitudes towards reading. Selected local schools are asked to identify up to 20 Year 6 pupils with reading ages over a year lower than their actual age, and without special educational needs. The university selects 10 at each school to benefit from 10 weekly one-hour sessions, delivered by its staff with support from student ambassadors.
Each session consists of a 30-minute guided reading session, followed by an interactive activity to develop reading comprehension skills. They aim to:
- Support learners to develop specific literacy skills, including reading fluency and comprehension and expanded vocabulary.
- Record a significant improvement in learners’ reading skills, based on tests at the beginning and end of the programme.
- Reduce the attainment gap between disadvantaged and non-disadvantaged learners at Key Stage 2, enabling learners in the long run to progress to higher education.
Evaluation uses a Type 2 approach based on the OfS standards of evidence. Analysis of 70 pupils in seven schools in 2019-20 showed that 67 per cent had improved their reading age by an average of 12 months, while 38 per cent had improved by two years or more. There was a 35 per cent increase in reading confidence, and a 44 per cent improvement in pupils’ comparison of their own reading abilities with those of their peers.
The programme has expanded to delivery by the local authority in Weymouth and Portland, with aims to reach more learners across the region and nationally. A parallel programme, Maths Mates, is being piloted in three local primary schools with the aim of improving maths attainment among pupils at Key Stage 1.
These approaches will potentially be very diverse, and tailored to the specific circumstances of particular universities, their geographical regions, and the groups being targeted. Many universities have a long history of collaboration with schools. These have included:
- Raising the expectations (rather than simply the aspirations) of pupils and their parents, teachers and guardians.30 Findings from the formative evaluation of the Uni Connect programme show that 79 per cent of participants who responded to the survey had increased expectations for the future, while 94 per cent had better knowledge of higher education options.31
- Appointing ‘influencers’ and running dedicated open days and interactive events for pupils with experience of local authority care.32
- Sponsoring local schools, as 73 universities and colleges reported in their 2019-20 access and participation plans that they were doing or about to do. Some have set up maths schools, such as the Exeter Maths School sponsored by the University of Exeter and Exeter College. The Liverpool Institute of Performing Arts has incorporated a primary school and a sixth form college into its LIPA Learning Group. Bridgwater and Taunton College sponsors a multi-academy trust.
- Running summer school programmes for school pupils. Evidence suggests that participating in summer schools is associated with greater confidence and increased aspiration, and with higher GCSE grades and rates of progression to higher education.33
- Programmes of intervention in schools to raise attainment. The Education Endowment Foundation has rated interventions related to metacognition and self-regulation as highly impactful, and some universities and charities take this approach to raising attainment.34 Others focus their interventions on improvements to subject knowledge or to grades and capabilities: for example, Bournemouth University’s Books and Stories programme that has increased the reading age of participants.
- Supporting attainment at Level 3 through Access to HE courses taught in further education colleges.
- Providing initial teaching training and continuing professional development to teachers. The Sutton Trust found that ‘for poor pupils the difference between a good teacher and a bad teacher is a whole year’s learning’.35 A separate report also found six teacher characteristics associated with increased attainment, including a strong pedagogical knowledge.36 Evidence shows that high quality continuing professional development has an average effect on pupil attainment equivalent to a month of extra learning.37
- Broadening the available routes into higher education to include short courses and apprenticeships. Over 100 universities and colleges offer degree apprenticeships, but some young people lack the knowledge to make an informed choice. With strategic partnerships, providers can show how diverse the sector is and help young people to choose a path to a successful career.
- Staff and alumni involvement in school governor structures. For example, the University of Manchester has a longstanding staff and alumni school governor initiative. The university recently conducted an impact study showing that, if all universities in England and Wales adopted the initiative, they could fill more than 10 per cent of the current nationwide school governor vacancies.38
- Access and outreach work, which is often collaborative and can contain elements of raising attainment. For example, in the National Outreach Coverage project, between 2017-18 and 2019-20 over 80,000 activities related to skills and attainment were reported through tracking services in England.39
Case study: The Brilliant Club Scholars Programme
The Brilliant Club is a UK-wide charity that mobilises the PhD community to support students who are less advantaged to access and succeed at the most competitive universities.40 In 2020-21 it delivered the Scholars Programme to 15,000 pupils in schools across the UK.
In the Scholars Programme, PhD tutors share their subject knowledge and passion for learning with small groups of students aged eight to 18, over seven tutorials. These pupils are targeted as being least likely to access the most competitive universities because they have no parental history of higher education, are eligible for free school meals, or live in an area of postcode deprivation.
Courses are based on tutors’ own areas of research, and the students experience university-style learning and complete a challenging final assignment to build the knowledge, skills and confidence needed to progress to university. The programme includes two trips to universities so students can learn about university life.
UCAS evaluation shows that graduates of the programme are significantly more likely to progress to a competitive university than a control group with matched prior attainment (44 per cent compared with 28 per cent). The charity itself tracks intermediate outcomes, focusing on key skills that support academic achievement and university preparedness, such as written communication, subject knowledge, critical thinking and university self-efficacy.
Universities can also do more to develop more flexible programmes and courses of higher education that provide a better fit with the lives of prospective learners. There is increasing recognition that the traditional three-year degree is not accessible to many. People with caring responsibilities, who want to study alongside a job or who are disabled, may struggle to commit to even a part-time degree.
Degree apprenticeships represent a different kind of alternative, offering a high quality and increasing high-status route into education and employment, and have expanded greatly since their inception. A poll of GCSE candidates by the Sutton Trust in 2019 found that 64 per cent would consider an apprenticeship rather than going to university, if one was available for a job they wanted to do.41
The government is planning to launch a Lifelong Loan Entitlement from 2025 that will prioritise the skills employers need. Individuals will be entitled to a loan, equivalent to four years of post-18 education over their lifetime, allowing them to take anything from individual modules to full programmes of study at higher technical and degree levels. This will enable them to build up learning over their lifetime and choose how and when they study to acquire new skills.
Case study: Children’s University
Children’s University is a programme to improve the attainment and aspirations of primary pupils by supporting schools to provide a range of learning opportunities outside the school day. The aim is to improve pupil attainment and such other attitudes and skills as motivation, confidence and teamwork.
The Education Endowment Foundation, a charity focused on improving teaching and learning, particularly for socioeconomically disadvantaged pupils, through better use of evidence, has funded a trial of Children’s University.42 Over 2,500 pupils in Years 5 and 6 in 68 primary schools took part in a randomised control trial. Children in the schools receiving Children’s University chose from activities including trips to libraries and museums, after-school clubs and sports activities. Participation was rewarded through credits, certificates, and a ‘graduation’ event.
Pupils who took part in the Children’s University programme made slightly more progress in reading, maths, teamwork and social responsibility. This efficacy trial provided initial evidence that under ideal conditions well supported enrichment activities may improve children’s academic and non-cognitive outcomes. 150 primary schools are taking part in a further trial to establish whether this holds in everyday conditions.
What the OfS is doing
An OfS Topic briefing published in 2020 outlines the link between educational attainment in schools and colleges and access to and success in higher education. As well as linking to guidance and resources, it gives concrete recommendations for effective practice in this area.43
In early 2022 we set out new priorities for access and participation, building on earlier work. We said that universities and colleges should:
- partner with schools and other local organisations to raise the attainment of young people
- develop more diverse pathways into and through higher education through more flexible courses
- ensure access leads to participation on high quality courses and secures good graduate outcomes
- improve the quality and volume of evaluation of access and participation plan activity
- make access and participation plans more easily understandable by prospective students, their parents and other stakeholders.
We are asking universities and colleges to refocus their access and participation plans to show how they are addressing these new priorities, while taking all reasonable steps to comply with the provisions of their existing plans. Universities are asked to make changes to their existing plans for 2023-24, and then to renegotiate all their plans to cover the academic years 2024-25 to 2027-28.44 We will ask universities to make their plans more straightforward and accessible, while ensuring that they reflect both the needs of small providers and the increasing importance of degree apprenticeships.
We will review all current plans to capture the full scale of universities’ work on strategic school engagement, quality, and non-traditional pathways such as short courses and degree apprenticeships. We have also brought forward the cycle by a year, so that the new plans will run for up to four years from September 2024.
We are working to ensure universities and colleges generate robust evidence of what works and in what contexts, through increased emphasis on independent evaluation of activity and through ensuring that the findings from those evaluations are published. This will ensure that we can pursue the approaches that work and learn from those that do not. We will ensure that our access and participation work reinforces, and is seen as an important part of, our approach to quality and standards. And we will promote more and more impactful school-university partnership activity to address the disparities in attainment in early life.
In preparation for the government’s plans for the Lifelong Loan Entitlement, the OfS is running a trial to help universities and colleges develop of new, short courses at higher technical and degree levels. This will trial distribute funding of up to £2 million to around 20 colleges.
In the next phase of the Uni Connect programme, we are expecting partnerships to develop evidence-informed collaborative approaches to raise attainment in local state secondary schools, acting as a broker, drawing on the resources and input of local higher education providers. We expect them to continue to engage schools and colleges to deliver higher education outreach with the aim of supporting young people to make informed choices about their options in relation to the full range of routes into and through higher education, including through apprenticeships.
Conclusion
Young people want to improve themselves, their lives and careers through the opportunities available to them. Understanding the options that are available, including higher education and vocational courses, is important. But so is recognising that the most competitive options, and those with better career prospects, also have higher attainment expectations for entry. In practice, however, young people’s access to and ability to succeed at university or college has often been limited by their socioeconomic background among other factors. Helping to eliminate these barriers for disadvantaged pupils so that they can flourish at university and in later life is a simple question of fairness. But it also has the potential to benefit higher education and the country at large, by drawing on the untapped talent, resources and life experiences that these students represent.
To achieve this, those involved in higher education need to establish creative, sustained and effective partnerships with schools and others, not simply to raise the expectations of children, their parents and advisers, but to improve their attainment in practical terms.
Note: This page and PDF download were updated on 10 May 2022 to correct references to the Lifelong Loan Entitlement.
- In this brief, for the sake of readability, we have used ‘universities and colleges’, or sometimes simply ‘universities’, to refer to what our regulatory framework and other more formal documents call ‘higher education providers’.
- Education Endowment Foundation (EEF), ‘Closing the attainment gap’, 2018, (https://educationendowmentfoundation.org.uk/support-for-schools/bitesize-support/closing-the-attainment-gap).
- Education Policy Institute (EPI), ‘Education in England: Annual report 2020’, August 2020 (available at https://epi.org.uk/publications-and-research/education-in-england-annual-report-2020/), pp10-11.
- See ‘About the measure’ under OfS, ‘Key Performance Measure 2’ (available at https://webarchive.nationalarchives.gov.uk/ukgwa/20220407125428/https://www.officeforstudents.org.uk/about/measures-of-our-success/participation-performance-measures/gap-in-participation-at-higher-tariff-providers-between-the-most-and-least-represented-groups/).
- See OfS, ‘Standards of evidence and evaluation self-assessment tool’ (www.officeforstudents.org.uk/advice-and-guidance/promoting-equal-opportunities/evaluation/standards-of-evidence-and-evaluation-self-assessment-tool/).
- University College London Centre for Longitudinal Studies, ‘Millennium mothers want university education for their children’, 15 October 2010 (https://cls.ucl.ac.uk/millennium-mothers-want-university-education-for-their-children/); the Sutton Trust, ‘University aspirations 2019’ (https://www.suttontrust.com/our-research/university-aspirations-2019/).
- Harrison, Neil, and Waller, Richard, ‘Challenging discourses of aspiration: The role of expectations and attainment in access to higher education’, British Educational Research Journal, 19 September 2018 (https://bera-journals.onlinelibrary.wiley.com/doi/abs/10.1002/berj.3475); St Clair, Ralf, Kintrea, Keith, and Houston, Muir, ‘Silver bullet or red herring? New evidence on the place of aspirations in education’, Oxford Review of Education, 28 October 2013 (https://www.tandfonline.com/doi/abs/10.1080/03054985.2013.854201); Gorard, Stephen, See, Beng Huat, and Davies, Peter, ‘The impact of attitudes and aspirations on educational attainment and participation’, Joseph Rowntree Foundation, April 2012 (https://www.jrf.org.uk/report/impact-attitudes-and-aspirations-educational-attainment-and-participation).
- Gorard, Stephen, and Siddiqui, Nadia, ‘How trajectories of disadvantage help explain school attainment’, SAGE Open, 28 January 2019, (https://journals.sagepub.com/doi/full/10.1177/2158244018825171).
- Gov.UK, ‘Widening participation in higher education’, 2019-20 (https://explore-education-statistics.service.gov.uk/find-statistics/widening-participation-in-higher-education/2019-20).
- Gov.UK, ‘Widening participation in higher education’, 2019-20 (https://explore-education-statistics.service.gov.uk/find-statistics/widening-participation-in-higher-education/2019-20).
- See also the data note accompanying this Insight brief at www.officeforstudents.org.uk/publications/schools-attainment-and-the-role-of-higher-education/.
- Gov.UK, ‘Widening participation in higher education’, 2019-20 (https://explore-education-statistics.service.gov.uk/find-statistics/widening-participation-in-higher-education/2019-20).
- Education Policy Institute, ‘Understanding progress in the 2020-21 academic year’, 29 October 2021 (https://epi.org.uk/publications-and-research/epi-research-for-the-department-for-education-on-pupil-learning-loss).
- See ‘New eligibility since lockdown’ in Gov.UK, ‘Free school meals: Autumn term’ (https://explore-education-statistics.service.gov.uk/find-statistics/free-school-meals-autumn-term/2020-21-autumn-term).
- The Sutton Trust, 29 July 2021, ‘A-levels and university access 2021’ (available at https://www.suttontrust.com/our-research/a-levels-and-university-access-2021/), 3-4.
- Gov.UK, ‘Laptops and tablets data’, March 2022 (https://explore-education-statistics.service.gov.uk/find-statistics/laptops-and-tablets-data/2022-march).
- EPI, ‘Analysis: A-level results 2021’, 10 August 2021 (https://epi.org.uk/publications-and-research/analysis-a-level-results-2021/).
- EPI, ‘Analysis: A-level results 2021’, 10 August 2021 (https://epi.org.uk/publications-and-research/analysis-a-level-results-2021/).
- ‘Most selective’ refers to high-tariff providers.The Department for Education groups universities into higher, medium and lower tariffs based on the normalised mean tariff score of their intake.
- See ‘Placed applicants 2021’ under ‘Applicants by POLAR4’ at OfS, ‘Young participation by area: Get the area-based measures data’ (www.officeforstudents.org.uk/data-and-analysis/young-participation-by-area/get-the-area-based-measures-data/).
- Department for Education, ‘Graduates continue to benefit with higher earnings’, 25 April 2019 (https://www.gov.uk/government/news/graduates-continue-to-benefit-with-higher-earnings); the Sutton Trust, ‘Elitist Britain 2019’, 24 June 2019 (available at https://www.suttontrust.com/our-research/elitist-britain-2019/); Department for Business, Innovation and Skills, ‘The benefits of higher education participation for individuals and society: Key findings and reports – “the quadrants”’, 1 November 2013 (available at https://www.gov.uk/government/publications/benefits-of-participating-in-higher-education-key-findings-and-reports-quadrants).
- OfS, ‘Access and participation data for the higher education sector’ (available at https://webarchive.nationalarchives.gov.uk/ukgwa/20220407125350/https://www.officeforstudents.org.uk/data-and-analysis/access-and-participation-data-dashboard/sector-level-data/).
- OfS, ‘Access and participation data dashboard’ (www.officeforstudents.org.uk/data-and-analysis/access-and-participation-data-dashboard/).
- OfS, ‘Access and participation data dashboard’ (www.officeforstudents.org.uk/data-and-analysis/access-and-participation-data-dashboard/); OfS, ‘Difference in student outcomes: Further characteristics (OfS 2020.30, available at
- www.officeforstudents.org.uk/publications/differences-in-student-outcomes-further-characteristics/), p28.
- This data relates to entrants from 2011-12 onwards, meaning that the data for 2013-14 qualifiers does not include students who completed their qualification in four years. The difference in attainment rate between 2013-14 and 2014-15 results in part from this.
- The Sutton Trust, ‘Universities and social mobility: Summary report’, 24 November 2021 (available athttps://www.suttontrust.com/our-research/universities-and-social-mobility/).
- Office for National Statistics, ‘Graduates’ labour market outcomes during the coronavirus (COVID-19) pandemic: occupational switches and skill mismatch’, 8 March 2021 (https://www.ons.gov.uk/employmentandlabourmarket/peopleinwork/employmentandemployeetypes/articles/graduateslabourmarketoutcomesduringthecoronaviruscovid19pandemicoccupationalswitchesandskillmismatch/2021-03-08).
- Gov.UK, ‘Graduate labour market statistics’, 2020 (https://explore-education-statistics.service.gov.uk/find-statistics/graduate-labour-markets).
- ‘Letter from the Department for Education announcing the appointment of the new director for access and participation’, 23 November 2021, available at OfS, ‘Guidance from government’ (www.officeforstudents.org.uk/advice-and-guidance/regulation/guidance-from-government/).
- Gov.UK, ‘Opportunity for all: Strong schools with great teachers for your child’, 28 March 2022 (available at https://www.gov.uk/government/publications/opportunity-for-all-strong-schools-with-great-teachers-for-your-child).
- Archer, Louise, DeWitt, Jennifer, and Wong, Billy, ‘Spheres of influence: What shapes young people’s aspirations at age 12-13 and what are the implications for education policy?’, Journal of Education Policy, 9 May 2013 (https://www.tandfonline.com/doi/abs/10.1080/02680939.2013.790079); Khattab, Nabil, and Modood, Tariq, ‘Accounting for British Muslims’ educational attainment: Gender differences and the impact of expectations’, British Journal of Sociology of Education, 11 April 2017 (https://www.tandfonline.com/doi/abs/10.1080/01425692.2017.1304203); St Clair, Ralf, and Benjamin, Amanda, ‘Performing desires: The dilemma of aspirations and educational attainment’, British Education Research Journal, 2 January 2013 (https://bera-journals.onlinelibrary.wiley.com/doi/abs/10.1080/01411926.2010.481358).
- IPSOS Mori, ‘Formative evaluation of Uni Connect phase two: survey of school and college staff’, 26 March 2021 (available at www.officeforstudents.org.uk/publications/formative-evaluation-of-uni-connect-phase-two-survey-of-school-and-college-staff/).
- OfS, ‘Consistency needed: Care experienced students and higher education’, Insight brief #8, April 2021 (available at www.officeforstudents.org.uk/publications/consistency-needed-care-experienced-students-and-higher-education/); OfS, ‘Topic briefing: Care experienced students and looked after children’ (www.officeforstudents.org.uk/advice-and-guidance/promoting-equal-opportunities/effective-practice/care-experienced/examples/).
- Transforming Access and Student Outcomes in Higher Education (TASO), ‘Summer schools’ (https://taso.org.uk/intervention/summer-schools/).
- EEF, ‘Metacognition and self-regulation’ (https://educationendowmentfoundation.org.uk/education-evidence/teaching-learning-toolkit/metacognition-and-self-regulation).
- The Sutton Trust, ‘Improving the impact of teachers on pupil achievement in the UK: Interim findings’, 21 September 2011 (available at https://www.suttontrust.com/our-research/improving-impact-teachers-pupil-achievement-uk-interim-findings/).
- The Sutton Trust, ‘What makes great teaching?’, 30 October 2014 (available at https://www.suttontrust.com/our-research/great-teaching/).
- EPI, ‘The effects of high-quality professional development on teachers and students: A cost-benefit analysis’, 28 April 2021 (available at https://epi.org.uk/publications-and-research/the-effects-of-high-quality-professional-development-on-teachers-and-students/).
- The University of Manchester, ‘Help plug the gap in school governor vacancies’ (https://stories.manchester.ac.uk/scaling-the-school-governor-initiative/index.html).
- The Higher Education Access Tracker, ‘Current projects’ (https://heat.ac.uk/research-and-evidence/currentprojects/).
- See https://thebrilliantclub.org/.
- The Sutton Trust, ‘University aspirations 2019’ (https://www.suttontrust.com/our-research/university-aspirations-2019/).
- See https://educationendowmentfoundation.org.uk/.
- OfS, ‘Topic briefing: Strategic relationships with schools and raising attainment’, 27 July 2020 (www.officeforstudents.org.uk/advice-and-guidance/promoting-equal-opportunities/effective-practice/strategic-relationships-with-schools/).
- OfS, ‘Our approach to access and participation’ (www.officeforstudents.org.uk/advice-and-guidance/promoting-equal-opportunities/our-approach-to-access-and-participation/).
Describe your experience of using this website