Beyond the bare minimum: Are universities and colleges doing enough for disabled students?
Disabled students are now a vital and significant part of campus life. However, challenges remain. Disabled students are less likely to continue their degrees, graduate with a good degree, and progress onto a highly skilled job or further study. This Insight brief asks what universities and colleges are doing to rectify these problems. What can the data tell us about the extent of these access and participation gaps? Are teaching and learning practices inclusive enough? Are funding changes exacerbating the difficulties that disabled students face?
- Date:
- 18 October 2019
Read the brief
Download the Insight brief as a PDF
Review of support for disabled students in higher education in England
Report to the Office for Students by the Institute for Employment Studies and Researching Equity, Access and Participation
Read the Insight brief online
Introduction
Disabled students now make up a significant part of the student population. In 2017, 13.2 per cent of students attending an English university or college reported having at least one disability.1 Disabled students contribute to a more diverse student body and bring a wider variety of views to the seminar room. Students and staff have campaigned for more inclusive practices on campus and against government reforms to their funding. Wider acceptance in society has broadened their opportunities for employment after graduation. Such contributions have made universities and colleges more accessible than ever before.
However, challenges and barriers remain. Students who report a disability have lower degree results overall and lower rates of employment after graduation than non-disabled students.2 They may be unaware of the support that is available to them: a recent study by the Department for Education showed that only 40 per cent of disabled students knew about of Disabled Students’ Allowance (DSA) before starting their course.3 There remains much to be done to integrate disabled students fully into the learning and life of universities and colleges.
The social model of disability is widely accepted as the most effective way that universities and colleges can respond to the needs of disabled students.4 The social model developed out of an understanding that disability is not something medical to be treated, but rather a failing on the part of society. Understood this way, a response to disability is not about ‘fixing’ the individual, but rather about restructuring the environments and attitudes around them.5 By building inclusive practices into an institution’s structure and operations, fewer reasonable adjustments will be needed over time. Where such adjustments are needed, the institution can be much more responsive to individual needs.
In a university setting, an example of inclusive practice would be to reform a service or practice so that all students have an equal opportunity to thrive. In relation to accommodation and academic services, for example, this could involve reviewing the accessibility of buildings, equipment and learning resources, and taking steps to address any barriers that are identified. In relation to assessment, it could involve reviewing the methods used throughout an institution to ensure they are suitable for students reporting different disabilities. This more flexible approach can also help students who are not disabled, such as those with caring responsibilities, and those who choose not to disclose a disability.6
A reasonable adjustment might be alternative forms of assessment for individual students. For example, students with learning differences or deaf students could benefit from a short 10-minute tutorial before the start of an assignment. An initial tutorial would give students the opportunity to discuss their ideas. This would ensure that they did not misinterpret the assignment. At a second tutorial, the student could share a brief sample of their work, reassuring them that they are on the right lines. This is not about lowering academic standards. Rather, it is about making reasonable adjustments so that all students have an equal opportunity to demonstrate their knowledge, skills and understanding. It also helps to promote student choice and independence.
The social model is not universally applied and remains aspirational. As a recent study from the University of Bristol stated: ‘Despite verbal adherence to the “social model of disability”, many institutions still saw a disabled person as a “problem” to be solved.’7
This Insight brief is timely. There is a real appetite for change driven by disabled students, the government and the new regulatory powers of the Office for Students (OfS). Disabled students and the National Union of Students (NUS) have raised issues around the reforms to the DSA, availability and suitability of assistive technology, and the provision of support services, especially for mental health.8 Responding to these concerns, in June 2019 the government announced the establishment of a Disabled Students’ Commission to address the barriers faced by disabled students and ensure they have the best chance to succeed.9
The OfS has an important role in helping to effect a change in culture and practice through regulatory pressure, targeted funding and sharing of effective practice. In order to charge fees of up to £9,250, higher education providers must submit access and participation plans. These plans require providers to identify the different outcomes specific groups of students experience in relation to access, continuation and attainment, and progression into further study and highly skilled jobs. We look at the measures the provider intends put in place to reduce and remove these gaps, and the progress it will make during the next five years. The OfS monitors these plans and takes action where universities and colleges fall short.
One of our key performance measures is to close the attainment gap, currently of 2.8 percentage points, between the proportions of disabled and non-disabled students graduating with first and upper second class degrees.10 We distribute £40 million annually to universities and colleges to help them create more inclusive environments for disabled students. This year, we will review this funding to ensure it is being used where most needed.
Working with the sector, we have set up the Centre for Transforming Access and Student Outcomes in Higher Education (TASO) to highlight and disseminate examples of effective practice. Alongside this Insight brief we are publishing our second report on how effectively universities and colleges are supporting disabled students, drawing on the funding and student finance available to them.11
In this context, this Insight brief looks at three aspects of disabled students’ experience:
- disclosure and data
- teaching and inclusive practices
- funding and legal protection.
Key points
- The OfS is concerned about persistent gaps in access, success and progression for disabled students. We are looking to ensure that universities and colleges close these gaps through our regulation of providers’ access and participation plans and our funding and promotion of effective practice.
- Teaching and learning in higher education is becoming more inclusive, but these positive developments are uneven. Universities and colleges could go further by, for example, offering alternative formats of course materials as standard, and ensuring more buildings are accessible.
- Through the Disabled Students’ Commission, we will bring together a range of experts and educators, including a student representative, to highlight the barriers which remain and explore ways to dismantle them.
Disabled students have a wide array of impairments. These may include:
- specific learning differences, such as dyslexia or attention deficit hyperactivity disorder
- mental health conditions, including anxiety, anorexia or depression
- physical disabilities affecting mobility or dexterity
- sensory impairments such as deafness or severe sight loss
- social or communication impairments, such as Asperger's syndrome or another autistic spectrum disorder
- long-term health conditions, including cancer, Crohn’s disease or HIV.
Between 2010 and 2017, the proportion of students in England self-reporting a disability increased from 8.1 per cent to 13.2 per cent. Much of this increase has been driven by students reporting mental health issues, the incidence of which has grown from 0.6 per cent of all students in 2010 to 3.2 per cent seven years later. The proportion of those reporting a social or communication impairment has more than trebled from 0.1 per cent to 0.5 per cent of all undergraduate students over the same period.12
This welcome increase of declared disabled students entering higher education has been attributed to a number of factors: availability of funding, greater social acceptance of disabilities, reforms at school level, greater efforts by colleges and universities to understand the makeup of their students, and changes in the law.13 It is also potentially life-changing for individual students: disabled people with a degree have employment rates of 74 per cent, compared with 49 per cent for those disabled people whose highest qualifications are at GCSE level. While there is still a substantial employment rate gap between disabled and non-disabled graduates, it is smaller than for other qualification levels, at 15 percentage points for those with a degree.14
Definitions
The social model: This approach developed out of an understanding that disability is not something medical to be treated, but rather a failing on the part of society. Understood this way, a response to disability is not about ‘fixing’ the individual, but rather about restructuring the environments and attitudes around them.
Access and participation plans: In order to charge higher level tuition fees, providers must submit plans to the OfS outlining how they will improve equality of opportunity for underrepresented groups – including disabled students – to access, succeed in and progress from higher education. The OfS monitors access and participation plans to make sure that the providers honour the commitments they make to students in these plans, and take action if they do not.
Figure 1: Employment rates and gap by highest qualification, January to March 2019
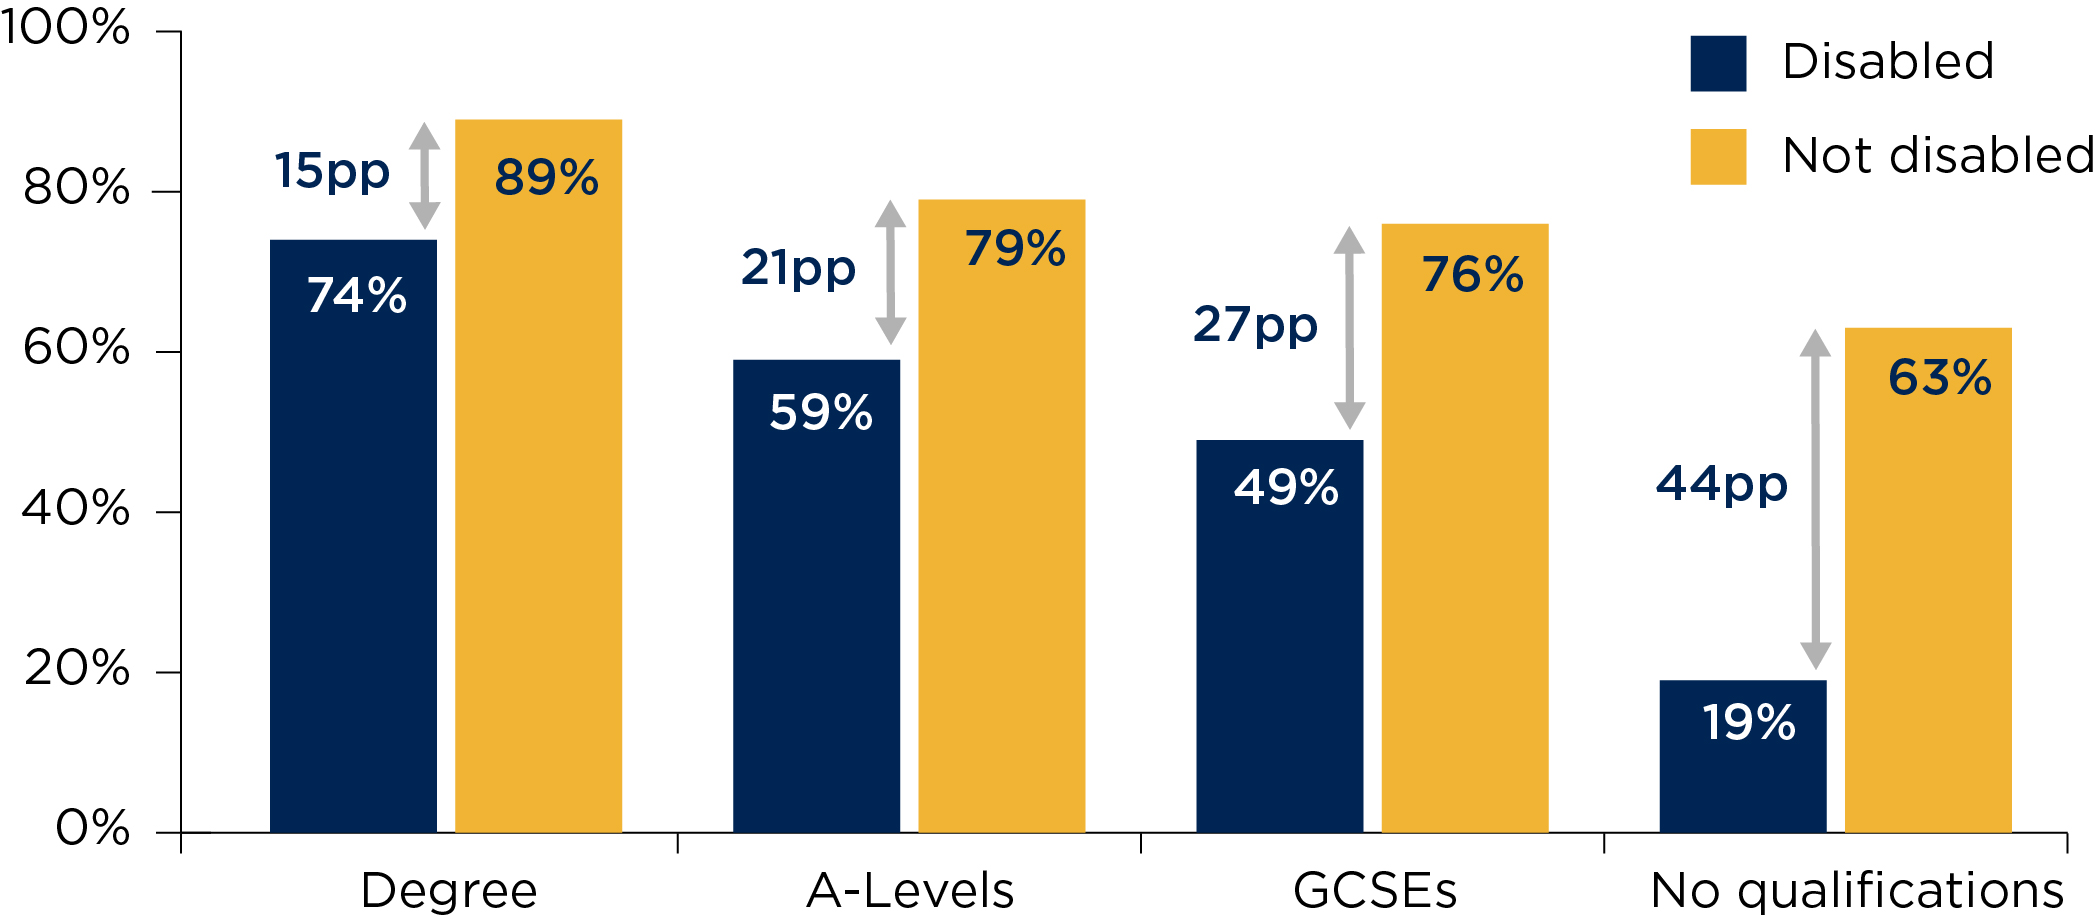
Figure 1 is a double bar graph which shows the differences in employment rates and the gap between them for disabled and not disabled people by highest qualification in the UK. It covers the period from January to March 2019 and the data comes from the Office for National Statistics Labour Force Survey, quarter one 2019 microdata.
The graph shows that disabled people whose highest qualification is a degree have the highest rate of employment of all disabled people. While a smaller proportion are employed versus their non-disabled peers, the gap between the two rates is the smallest of the qualification levels.
- Degree: disabled people, 74 per cent; not disabled people, 89 per cent; the gap between these two rates is 15 percentage points.
- A-Levels: disabled people, 59 per cent; not disabled people, 79 per cent; the gap between these two rates is 21 percentage points.
- GCSEs: disabled people, 49 per cent; not disabled people, 76 per cent; the gap between these two rates is 27 percentage points.
- No qualifications: disabled people, 19 per cent; not disabled people, 63 per cent; the gap between these two rates is 44 percentage points.
Funding changes
The rise in students reporting disabilities and recent changes in government funding make the more widespread take-up of the social model all the more pressing. What is required is not only a more inclusive learning environment but a cultural shift. The government changed the criteria for DSA in 2015, meaning that non-medical help such as note-takers would no longer be covered. This was on the understanding that universities and colleges would meet the shortfall by extending adjustments for individual students into more sustainable inclusive practices across the board, rather than seeing a decline in provision for disabled students.15
To give universities and colleges time to adjust to this new funding regime and expectations, the former Higher Education Funding Council for England (HEFCE), and more recently the OfS, have been distributing an increased level of funding, rising from £20 million in 2015 to £40 million annually from 2016 onwards. The funding has been allocated explicitly to support providers to develop inclusive teaching practices and further the adoption of the social model.16
Issues of funding have become more of a concern for individual students since 2015 as, to claim assistive technology, they have had to pay the first £200 themselves. In 2015, there was an 18 per cent fall in the number of students receiving funding for assistive technology compared with 2014.17 Much of this fall can be attributed to students already owning a laptop which they can use to access assistive software. There are, however, anecdotal accounts of disabled students who are making do with computers which are not powerful enough to run the required software because they are unable or unwilling to pay £200 towards another machine. Some providers now pay this £200 for students on a means-tested basis.18
The uptake of DSA overall has declined from a high of 7.3 per cent of UK students studying in England claiming it in 2014-15, reversing an upward trend of more than a decade. Now 6.8 per cent receive DSA to help them complete their course.19 It is important to note that not all disabled students studying in England can apply for DSA. International students cannot claim the benefit. Students undertaking degree apprenticeships are not eligible, as their employer is responsible for making reasonable adjustments. Those who cannot afford and whose provider does not pay for the necessary assessment or doctor’s letter cannot claim. At postgraduate level, the maximum support a student can claim is lower by a third than that available at undergraduate level.20
The law and regulation
Since 2001, universities and colleges have had a legal requirement to make ‘reasonable adjustments’ for disabled students. Under the Equality Act 2010, universities and colleges have a duty to ensure equality of opportunity for disabled students by:
- changing rules or practices
- altering or removing physical barriers
- providing support services or devices.21
There are a number of avenues for recourse when a disabled student feels a provider has not done enough. They can raise the issue with their provider, make a complaint to the Office of the Independent Adjudicator after they have exhausted the provider’s internal complaints procedure, and take their provider to court. In 2018, the largest amount of compensation recommended by the Office of the Independent Adjudicator was to a disabled student who complained about the non-medical support they received from their provider.22 This type of action does, however, place the onus on the student to challenge their university or college, which takes time and can be stressful.
Through our regulation of access and participation plans, we require providers to analyse the position of students reporting different types of disability and their intersection with other characteristics, to identify any gaps in relation to access, student success and progression into further study and work for these students. Providers must establish targets and plans to address these gaps over a period of five years, and to demonstrate how they will evaluate whether they are succeeding.
We also use funding to promote and support effective and inclusive practice, for example, the adoption of social models throughout an institution, and the identification and sharing of effective support practices.
Through this combination of pressure on individual higher education providers and sector-wide support, we expect universities and colleges not only to fulfil their duties under the Equality Act but also to provide the best possible learning environment for disabled students.
Disabled students’ participation and outcomes
Our analysis shows that, at sector level, undergraduate disabled students are doing less well than non-disabled students in terms of continuing their course (0.9 percentage points), degree attainment (2.8 percentage points), and progression onto highly skilled employment or postgraduate study (1.8 percentage points).23
These gaps are more uneven at provider level, with some universities and colleges doing very well and others less so. For example, 54 per cent of universities and colleges had a gap of less than 2.5 percentage points (either positive or negative) between the continuation rate for their non-disabled and disabled students. In rates of attainment and progression, 33 per cent and 41 per cent of providers respectively achieve figures within this range.24
While overall these gaps are much less pronounced than those between black and white students or between students from the most and the least educationally advantaged neighbourhoods, they mask differences when disability is separated into more granular categories.25 For example, while the difference in continuation rates between non-disabled and disabled students is overall fairly small, this hides substantial variation when looking at specific types of impairment. When looking at full-time undergraduate students in 2016, those with cognitive or learning difficulties had higher continuation rates (91.4 per cent) than non-disabled students (90.3 per cent) while students with a mental health condition have the lowest (86.8 per cent). For part-time undergraduates, in 2015, students with a mental health condition had a continuation rate of only 52.1 per cent compared with 64.1 per cent for non-disabled students.26
There is likewise a double-figure percentage point gap in progression, this time for students with a social or communication impairment. For full-time undergraduates who graduated in 2016-17, only 61.8 per cent of those with a social or communication impairment had progressed into highly skilled work or postgraduate study after six months compared with 73.3 per cent of their non-disabled peers.27
Looking at the gaps by disability type highlights, therefore, that not all disabled students’ needs are being met at all points of the student lifecycle. This is borne out by the National Student Survey which, between 2009 and 2013, showed that students with a declared disability had a consistently lower than average overall satisfaction rate. This result persists even when other factors (such as choice of subject, gender and ethnicity) were taken into account.28
Thus, it is the variability in disabled students’ experience of support, teaching and career advice at university or college which is at issue. This analysis suggests that universities and colleges need to be particularly attentive to the granular detail of their student data, especially where multiple characteristics intersect to entrench disadvantage.
Figure 2: Gaps in continuation, attainment and progression rates between non-disabled students and disabled students29
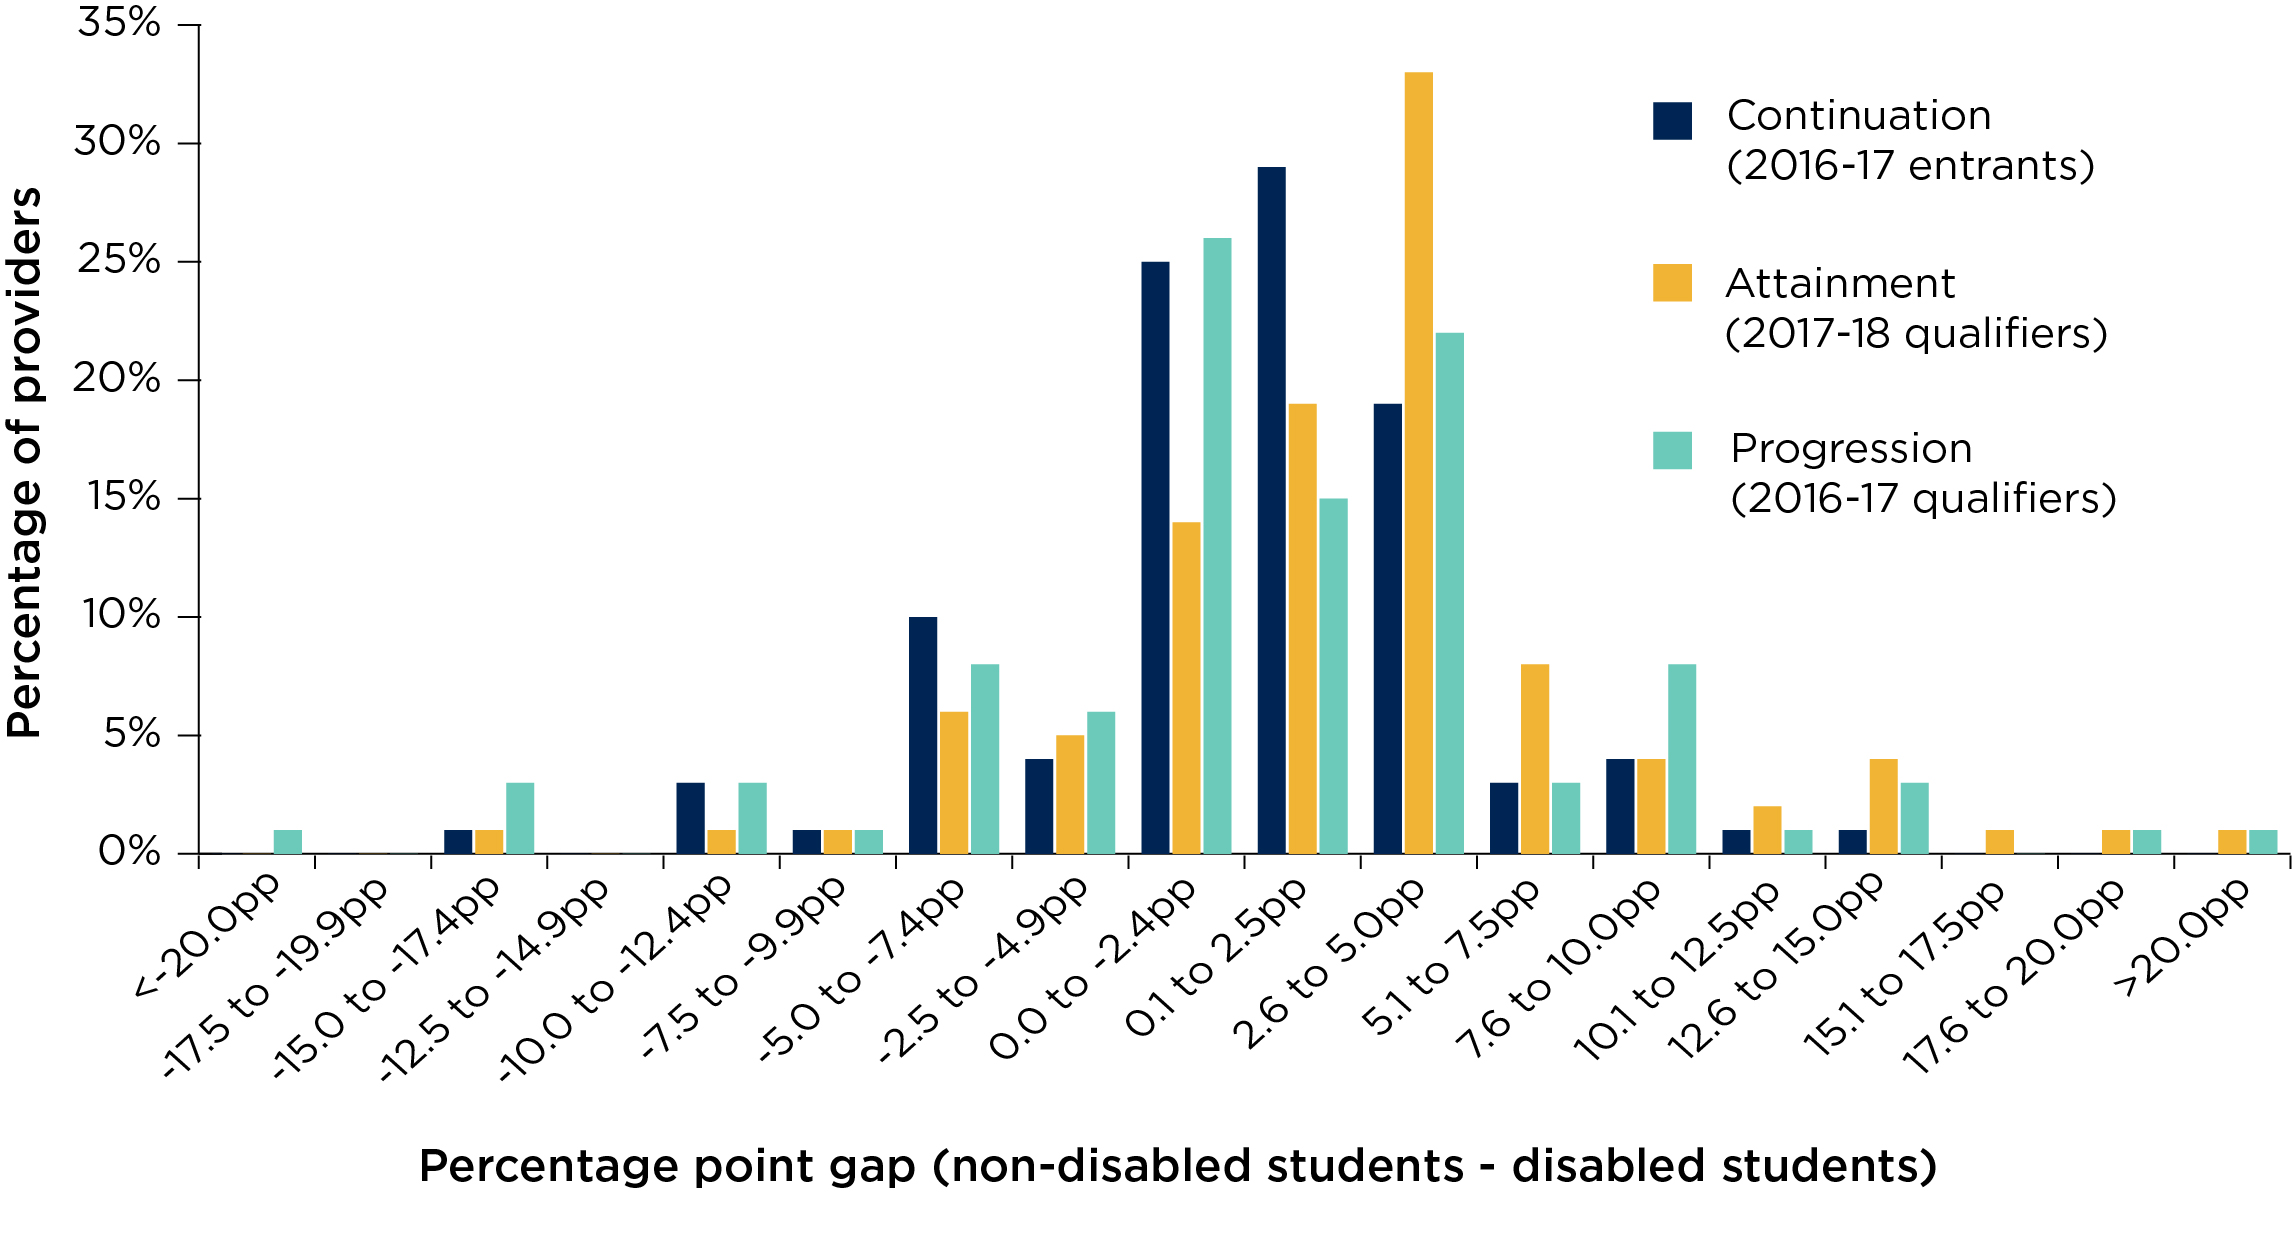
Figure 2 is a triple bar chart showing the gaps in continuation, attainment and progression rates between non-disabled students and disabled students by percentage of providers. The data comes from the OfS access and participation data, collected between 2016 and 2018.
It shows that 54 per cent of universities and colleges had a gap of less than 2.5 percentage points (either positive or negative) between the continuation rate for their non-disabled and disabled students. In rates of attainment and progression, 33 per cent and 41 per cent of providers respectively achieve figures within this range.
| Range of gaps in percentage points | Continuation | Attainment | Progression |
|---|---|---|---|
|
<-20.0 ppts |
0% |
0% |
1% |
|
-17.5 to -19.9 ppts |
0% |
0% |
0% |
|
-15.0 to -17.4 ppts |
1% |
1% |
3% |
|
-12.5 to -14.9 ppts |
0% |
0% |
0% |
|
-10.0 to -12.4 ppts |
3% |
1% |
3% |
|
-7.5 to -9.9 ppts |
1% |
1% |
1% |
|
-5.0 to -7.4 ppts |
10% |
6% |
8% |
|
-2.5 to -4.9 ppts |
4% |
5% |
6% |
|
0.0 to -2.4 ppts |
25% |
14% |
26% |
|
0.1 to 2.5 ppts |
29% |
19% |
15% |
|
2.6 to 5.0 ppts |
19% |
33% |
22% |
|
5.1 to 7.5 ppts |
3% |
8% |
3% |
|
7.6 to 10.0 ppts |
4% |
4% |
8% |
|
10.1 to 12.5 ppts |
1% |
2% |
1% |
|
12.6 to 15.0 ppts |
1% |
4% |
3% |
|
15.1 to 17.5 ppts |
0% |
1% |
0% |
|
17.6 to 20.0 ppts |
0% |
1% |
1% |
|
>20.0 ppts |
0% |
1% |
1% |
Data collection and improving disclosure
Access and participation data cannot tell us everything we need to know about disabled students. The OfS measures access through examining the makeup of the student population. This can tell us, for example, whether disability is reported disproportionality by students of different genders, ethnicity or educational background. Because of differences in how secondary school pupils and students in higher education are recorded, however, we cannot measure whether disabled young people are entering higher education at a lower rate than their non-disabled peers. There are small-scale studies which suggest this might be the case.30
Disclosure remains an issue for all statistics on disabled students. Many applicants and students with impairments do not disclose them because of a continuing social stigma or fears of being discriminated against, or because they do not identify themselves as disabled. There are a number of ways in which the disclosure process could be made less laborious.
For example, currently students with multiple disabilities can only choose the ‘multiple disabilities’ category on their UCAS form. They are then asked which is their ‘primary’ disability. We have discussed with the Higher Education Statistics Agency the possibility of separating out the ‘multiple disabilities’ category into the separate disabilities. This separation would allow universities and colleges to better meet the need of their students, and improve the quality of the data on disabled students overall.
In a further example, politicians from various parties have called for students who have been diagnosed with learning differences while at school to be able to carry this diagnosis over into higher education without having to pay for a new assessment.31
Beyond the data story
The accounts of disabled students themselves point to remaining barriers and what can be done to remove them. Recent studies and government reports detail numerous incidences of disabled students not receiving support until well into their first term, often meaning they fall behind in their course and, in extreme cases, have to repeat a year.32
Students have raised concerns about the lack of clarity around returning to their course after an interruption in their studies.33 Disabled students continue to experience microaggressions.34 Accessible student halls tend to be more expensive, and many teaching spaces are not fully accessible.35 Disabled students are less satisfied with their professional placements and report more difficulties with them than non-disabled students.36
While targeted funding, the drive for accessible campuses, and the hard work of university and college staff since the 1990s have seen more disabled students than ever enter and succeed in higher education, it is evident that much remains to be done. Reading the quantitative and qualitative evidence in tandem shows that many disabled students are achieving despite the barriers which remain in their way, not because these barriers have been entirely removed.
The rest of this brief looks at disabled students’ needs and whether or not they are being met. In this way, we can see clearly where the sector is doing well and where it needs to improve.
Good practice example: University of Warwick
Accessible spaces: Accessible sensory study rooms
The library has a number of rooms with a range of software and additional facilities including different types of seating, lighting and resources. The rooms are publicised on the library website, and can be booked. One room contains various lighting options including a bubble tube and LED strip lighting. Seating options include a rocking chair, bean bag, soft seating and wobble cushion. Relaxation music and headphones are provided, and various sensory objects and a yoga mat are also available.
How embedded is the social model?
In 2017, HEFCE commissioned a survey on the extent to which the social model was being adopted in universities and colleges. The survey asked 105 universities and colleges about a range of issues, including:
- assistive technology
- learning resources, including staff training and induction
- inclusive learning in module and programme development and evaluation
- alternative assessment methods for disabled students
- counselling services and administrative processes to identify potential wellbeing issues
- accessibility plans for social and recreational spaces, teaching and learning facilities and accommodation.37
A follow-up report surveyed 67 universities and colleges, some of which had taken part in the previous survey. In many areas, the surveyed universities and colleges are demonstrating evidence of good inclusive practices: 95 per cent have made books available in an electronic form, 82 per cent provide mind mapping software, 78 per cent have document reading software, 95 per cent offer alternative assessment methods, and 100 per cent make course materials available online.38 Overall, providers scored themselves at 6.2/10 for inclusiveness.39
This overall improvement is welcome. However, in other areas progress is less clear cut. The vast majority of universities and colleges surveyed (80 per cent) are recording some of their lectures, but only a small minority (8 per cent) are recording all of them. Only two of the six further education colleges that answered this question were recording any of their lectures.40 This uneven support means that many disabled students may not be getting the help they need. Recording all lectures also benefits non-disabled students: at the University of Huddersfield, at least half of all students viewed the recorded lectures.
Good practice example: University of Huddersfield
Widespread use of lecture capture
The university has automatic video recording of all lectures. The only lectures not recorded are those where the tutor requests to opt out for pedagogical reasons. Recordings are available to all students, not just those with a disability or personal learning support plan, and the university monitors usage. The latest data shows that at least half of all students accessed a lecture recording in the past year.
Recordings enhance the learning experience, particularly for students from underrepresented groups, international students and others for whom English is not their first language. The lecture capture system allows students to bookmark recordings to highlight important sections, to add notes to recordings to assist their learning, and to share these bookmarks and notes with their peers.
The university is now looking at enhancing its ability to caption videos for hearing-impaired students.
In terms of estates accessibility, university libraries are a relative success story: 71.4 per cent of respondents report that their libraries are 90 to 100 per cent accessible. The accessibility of teaching and learning spaces is decidedly patchier, with only 29.8 per cent of universities and colleges reporting that 90 to 100 per cent of such spaces were fully accessible.41
Student accommodation is the most varied. Just over a quarter (26.5 per cent) of providers report that zero to 10 per cent of their accommodation is fully accessible, compared with 8.2 per cent reporting that 90 to 100 per cent is.42 Having only a certain proportion of accessible student accommodation is not a problem in itself. However, qualitative studies have shown that such accommodation tends to be newer and therefore more expensive.43 This limits disabled students’ choice and in effect forces them to pay a premium.
Universities and colleges also need to do more to encourage students to disclose disabilities during their degree. In the most recent survey, only 76 per cent of respondents said that they encouraged disclosure at all stages of the student life cycle.44
These uneven levels of support mean that the onus remains on disabled students to ask for inclusive teaching practices, rather than such practices being the norm. For disabled students, recorded lectures and online learning allow them to keep up with work if they are unable to take their own detailed notes or attend in person. These technologies can benefit other students, such as those with caring responsibilities, commuter students, or those who find recordings useful for revision.
On a more positive note, the survey shows that universities and colleges are listening to their disabled students. Providers mainly engaged with the student body on issues around disability support through their students’ union (93 per cent). A high proportion also used survey feedback (88 per cent) and focus groups (70 per cent) to obtain the views of disabled students about the support they provided.45 Overall, 97 per cent of surveyed providers consulted with disabled students to obtain their view of the support on offer.46 The approaches to feedback include student surveys, looking at attainment and retention, focus groups, analysing service usage data, and monitoring attendance. This engagement is necessary if the social model is to be successfully implemented.
Good practice example: South Essex College
Supporting transitions
The college has considerable experience of supporting disabled learners’ progression from further to higher education, both within the college and to other higher education providers. Students are supported by a personal higher education disability adviser throughout their transition from further to higher education. The adviser provides encouragement, and gives impartial advice about options for accessing support to help them make informed decisions about their next educational step.
A key element of this support is through the annual review process of education, health and care (EHC) plans that students have while studying at further education level. Although the plan expires when they enter higher education, it provides evidence for their needs assessment. The college identifies the aspects within students’ EHC plans that it is able to continue to support at higher education level, thus helping to smooth the transition.
Overall, universities and colleges are getting better at being accessible, but only some of the time. In many cases, support remains individualised and relies on individual students disclosing their disability.
Conclusion
While universities and colleges have outwardly embraced the social model, they still have much to do if they are to realise full inclusivity for disabled students. Much remains to be done to ensure that disabled students have the same opportunities and experiences as their non-disabled counterparts. The coverage of inclusive pedagogy remains irregular at best, with only a small minority of providers recording all lectures and providing all computers with accessibility software. More needs to be done to listen to disabled students’ voices.
Effective practice for universities and colleges47
To better support disabled students and progress towards a more inclusive environment, universities and colleges need:
- their senior management to commit to inclusive practice and culture
- to involve all university staff in encouraging students to disclose an impairment.
- more comprehensive written policies detailing inclusive support
- to take a whole institution approach to inclusive support
- build considerations of inclusivity/accessibility into curriculum design and programme review
- to offer alternative formats of lectures and course materials as standard practice
- to build considerations of inclusivity and accessibility into purchasing of services and equipment
- better sharing of good practice internally and across the sector
- better advice, guidance and training on digital accessibility for staff.
To help universities and colleges fully realise the social model, the OfS will continue to monitor and challenge through access and participation plans, ensuring that disabled students’ experience of university and their outcomes continue to improve. We will discuss with the Higher Education Statistics Agency the possibility of splitting the ‘multiple disabilities’ category into their constituent parts. Through TASO we will share effective practice. We will help address entrenched barriers by, for example, funding conversion courses into artificial intelligence and data security that will target underrepresented groups, including disabled people.
We will support the Disabled Students’ Commission, allowing better understanding of the issues and barriers disabled students face. The commission will include a student representative and will canvas disabled students on their views. It will offer practical advice and guidance to help universities and colleges become even more welcoming to disabled students. It will be an independent body which will challenge government, the OfS, and universities and colleges to provide better support for disabled students.
This year we are reviewing our approach to teaching funding, including the disabled students’ premium. This amounted to £40 million in 2019-20 and was allocated to providers using a formula which looked at how many students they had who either had self-declared disabilities or received DSA. Currently disabled students premium funding supports the costs of activities that will promote inclusion and remove barriers to participation and success for disabled students. One of the first things the Disabled Students’ Commission will report back on is the best uses for this funding.
It is by listening to students, fully implementing inclusive teaching and learning practices, and sharing effective practice that the sector can close gaps in the experience and outcomes of disabled students, and ensure equality of opportunity for all.
1 OfS, ‘Equality and diversity data’.
2 OfS, ‘How do student outcomes vary by disability status?’.
3 Department for Education, ‘Evaluation of Disabled Students’ Allowances (DSAs)’, January 2019, p9.
4 Barnes, Colin, ‘Disability, higher education and the inclusive society’, British Journal of Sociology of Education, 2007, pp135-145.
5 Oliver, Michael, Social work with disabled people, 1983, pp23-27.
6 Madriaga, Manuel, Katie Hanson, Caroline Heaton, Helen Kay, Sarah Newitt and Ann Walker, ‘Confronting similar challenges? Disabled and non‐disabled students’ learning and assessment experiences, Studies in Higher Education, 2010, pp647-658.
7 University of Bristol, ‘Getting things changed: Final report’, May 2018, p4.
8 NUS, ‘Anti-cuts’; Policy Connect and the All-Party Parliamentary Group for Assistive Technology, ‘Accessible virtual learning environments: Making the most of the new regulations’, September 2018, pp12-15; Weale, Sally, ‘Bristol University faces growing anger after student suicides’, Guardian, 26 May 2018.
9 Department for Education, ‘New group to boost support for disabled students’, June 2019.
10 OfS, ‘Official statistic: Key performance measure 5’.
11 Institute for Employment Studies, ‘Review of support for disabled students in higher education in England’, October 2019 (available to download from the top of this page).
12 OfS, ‘Equality and diversity data’.
13 Vickerman, Philip, and Milly Blundell, ‘Hearing the voices of disabled students in higher education’, Disability & Society, 2010, pp23-24; John TE Richardson, ‘The representation and attainment of students with a hearing loss in higher education’, Studies in Higher Education, 2001, p187.
14 House of Commons, ‘People with disabilities in employment’, October 2019, p10.
15 OfS, ‘Disabled students’.
16 OfS, ‘Disabled students’.
17 Figure calculated using the interim 2015-16 data compared with 2014-15 data at the same stage. The data is 26,400 students in 2014-15 and 21,700 students in 2015-16. Student Loans Company, ‘Student support for higher education (HE)’.
18 Policy Connect and the All-Party Parliamentary Group for Assistive Technology, ‘Disabled Students' Allowances: Giving students the technology they need to succeed’, July 2019, p13.
19 Higher Education Statistics Agency, ‘Widening participation summary: UK Performance Indicators 2017/18’.
20 ‘Help if you're a student with a learning difficulty, health problem or disability’.
21 ‘Disability rights: Education’.
22 Office of the Independent Adjudicator, ‘Annual report 2018’, 2018, p22.
23 OfS, ‘Guide to the access and participation data resources: Findings from the data’.
24 OfS, ‘Guide to the access and participation data resources: Findings from the data’.
25 OfS, ‘Guide to the access and participation data resources: Findings from the data’.
26 OfS, ‘Access and participation data dashboard’.
27 OfS, ‘Access and participation data dashboard’.
29 OfS, ‘Guide to the access and participation data resources: Findings from the data’.
30 Research from the National Deaf Children’s Society has shown that while young deaf people are as likely to go to university as their hearing counterparts, they are half as likely to go to a Russell Group university. National Deaf Children’s Society, ‘Deaf students 50 per cent less likely to go to top universities’, July 2018.
31 House of Lords Hansard, ‘Disabled Students’ Allowance’ 8 May 2019; House of Lords Hansard, ‘Disabled Students’ Allowance’, 27 February 2018; House of Lords Hansard, ‘Dyslexia: Disabled Students’ Allowance’, 13 November 2017.
32 Department for Education, ‘Evaluation of Disabled Students’ Allowances (DSAs)’, January 2019, p94; Hewett, Rachel, Sue Keil and Graeme Douglas, ‘Experiences of blind and partially sighted young people as they make the transition into Higher Education’, November 2015, p30.
33 Weale, Sally, ‘Bristol University faces growing anger after student suicides’; Yokoyama, Erica, and Una Yates, ‘“Confusing and very difficult” – college suspension policies revealed’, Oxford Student, 18 February 2019.
34 Osborne, Tanya, ‘Not lazy, not faking: Teaching and learning experiences of university students with disabilities’, Disability & Society, 2019, pp241-242.
35 Hewett, Rachel, Sue Keil and Graeme Douglas, ‘Experiences of blind and partially sighted young people as they make the transition into Higher Education’, November 2015, pp35-37; ‘Oxford’s accessibility crisis’, Cherwell, 24 November 2018; ‘How accessible is UEA?’, Concrete, 19 November 2018.
36 Hill, Shirley and Angela Roger, ‘The experience of disabled and non-disabled students on professional practice placements in the United Kingdom’, Disability & Society, 2016, pp1212-1213.
37 Institute for Employment Studies, ‘Models of support for students with disabilities’, October 2017.
38 Institute for Employment Studies, ‘Review of support for disabled students in higher education in England’, pp68, 58, 53.
39 Institute for Employment Studies, ‘Review of support for disabled students in higher education in England’, p14.
40 Institute for Employment Studies, ‘Review of support for disabled students in higher education in England’, pp55-56.
41 Institute for Employment Studies, ‘Review of support for disabled students in higher education in England’, p75.
42 Institute for Employment Studies, ‘Review of support for disabled students in higher education in England’, p75.
43 Hewett, Rachel, Sue Keil and Graeme Douglas, ‘Experiences of blind and partially sighted young people as they make the transition into Higher Education’, November 2015, pp35-37.
44 Institute for Employment Studies, ‘Review of support for disabled students in higher education in England’, pp39-40.
45 Institute for Employment Studies, ‘Review of support for disabled students in higher education in England’, pp86-87.
46 Institute for Employment Studies, ‘Review of support for disabled students in higher education in England’, p114.
47 Institute for Employment Studies, ‘Review of support for disabled students in higher education in England’, p5.
Going to university almost halves disability job gap
A disabled student’s insight: Contextualising statistics
Describe your experience of using this website